US/UK M&A deal monitor has been saved

Perspectives
US/UK M&A deal monitor
Decision time
Over the past two years, the US/UK M&A corridor has been characterized by record activity. Even with uncertainty on the horizon—Brexit, technology and innovation, and US tax changes—the United States and the United Kingdom remain two of the world’s most competitive and creative economies. Their size, scope, and potential will drive future dealmaking.
Fifth edition of the Deloitte US/UK M&A deal monitor
The Deloitte US/UK M&A deal monitor follows trends and analyzes underlying driving forces in the most active merger and acquisition arena in the world economy today. In our fifth edition, we focus on the latest half year of mergers and acquisitions (M&A) activity (July 2017 to December 2017) between the United States and the United Kingdom, set in the context of the most recent eight quarters in the US/UK corridor.
The global flow of mergers and acquisitions is an indicator of the vitality of the global corporate economy and the US/UK M&A corridor—the biggest bilateral deal corridor in the world by value and volume—has seen record activity over the past two years.
As asset valuations climb ever higher, financial conditions remain easy. Private equity buyers are sitting on a $1 trillion mountain of undeployed capital, while strategic buyers are cash rich and have the advantage of share valuations that give them powerful financial leverage when it comes to dealmaking. It looks like a perfect setting for another record year for M&A in 2018 and the global M&A flow is strong and getting stronger.
The outlook for the US/UK M&A corridor includes some unique challenges. In this report, we take a closer look at three issues that are critical to the evolution of dealmaking between the United States and the United Kingdom:
- Brexit, the United Kingdom’s exit from the European Union: We set out to clarify some of the uncertainties surrounding the process, the likely final terms of the separation, and the United Kingdom’s ongoing trading relationships.
- Innovation and technology: Technology continues to drive the US/UK deal corridor as both economies are viewed as centers for technology, innovation, and collaboration. We take a look at why they are attractive as key innovation hubs.
- US tax reforms: We explore the impact they may have on transatlantic M&A.
Key themes
- UK investors see an ever-increasing attractiveness to the US market: deal volumes increased by 24 percent between H2 2016 and H2 2017.
- US investors took a step back, reflected in a 14 percent decrease in the same period.
- Despite uncertainties rooted in Brexit, technology and innovation, and US tax reform, the US/UK deal corridor remains the most active in the world.
- Dealmaking momentum is expected to continue in 2018:
- Organizations must digitize and acquiring the tech assets to enable digitization is one of the key drivers of M&A.
- Corporations have elevated levels of balance sheet cash and are citing M&A as the mostly likely way they’ll use this cash.
- Financing is still freely available in the United States.
- The Brexit decision has now been a factor for 18 months: Investors can no long take a “wait and see” position; it’s decision time, despite the unknowns.

H2 2017 interactive graphs
US/UK cross border M&A deals
- Source: Thomson One Banker
US/UK deal volume and value by industry Q1 2016-Q4 2017
- Source: Thomson One Banker
Corporate and private equity deals by volume
- Source: Thomson One Banker
N.B Deal value calculations are based on M&A deals for which value is disclosed – values are not disclosed for a significant proportion of M&A deals. Volume calculations are based on all announced deals whether or not value is disclosed.
US outbound deal volume by UK regions since Q1 2016


UK outbound
US outbound
London
214
South East
118
East
50
North West
35
South West
36
West Midlands
28
East Midlands
26
Scotland
26
Yorkshire & The Humber
26
Wales
14
North East
6
Northern Ireland
6
Offshore
1
Others
101
- Source: Thomson One Banker
UK outbound deal volume by US States since Q1 2016
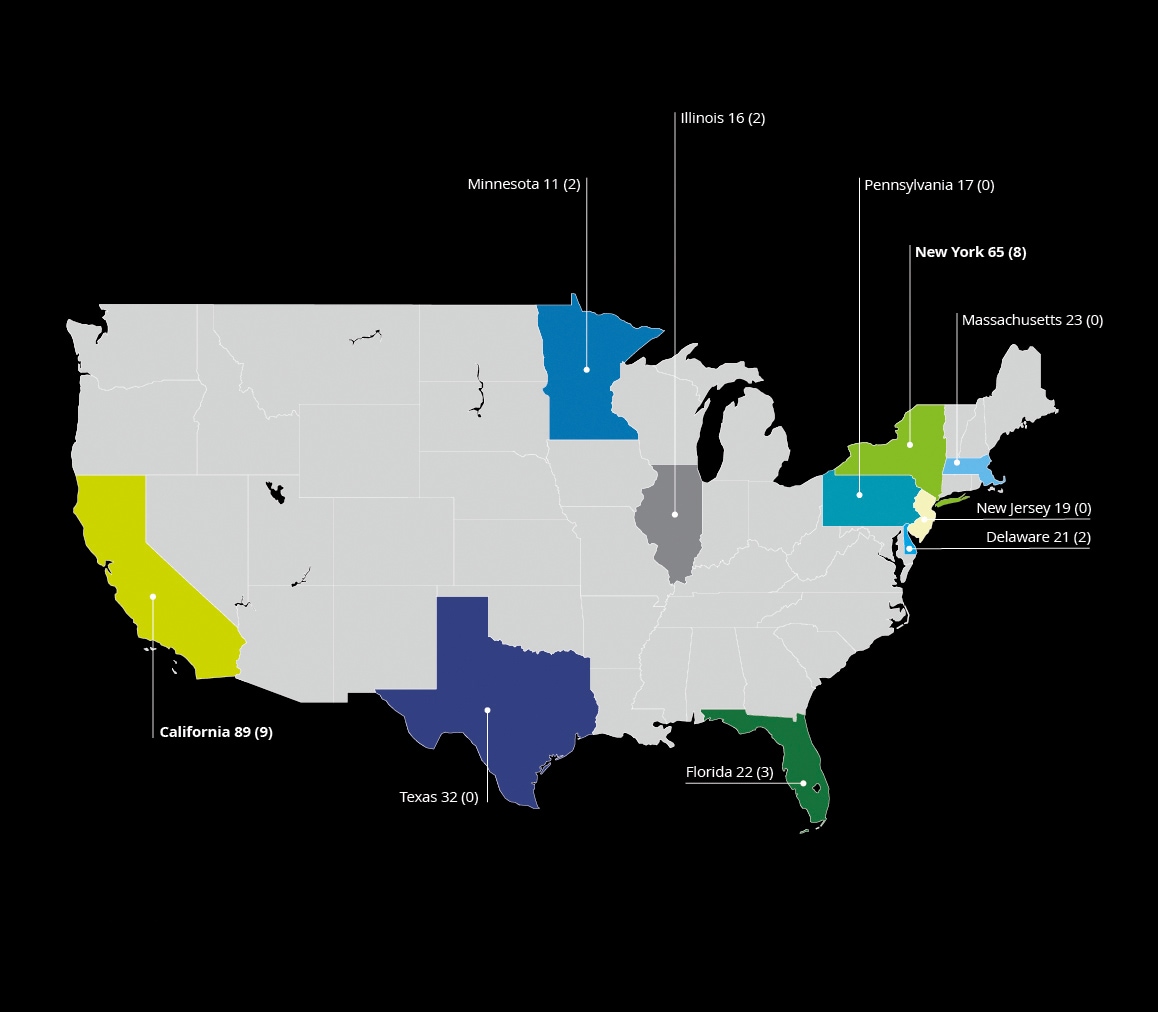

US outbound
UK outbound
California
89
New York
65
Texas
32
Massachusetts
23
Florida
22
Delaware
21
New Jersey
19
Pennsylvania
17
Illinois
16
Minnesota
11
Others
121
- Source: Thomson One Banker
N.B Deal value calculations are based on M&A deals for which value is disclosed – values are not disclosed for a significant proportion of M&A deals. Volume calculations are based on all announced deals whether or not value is disclosed.
Get in touch


Recommendations

Total M&A Solution™
Accelerate the future of the deal