


US Economic Forecast: Volume 3 Issue 2 has been saved

US Economic Forecast: Volume 3 Issue 2
23 June 2015
Unexpected weakness in the first quarter and indications that the second quarter will also be weak make our previous forecast for 2015 unlikely (or, at least, highly improbable).
 The US economy has been hard on optimists over the past five years, and recent data have followed this pattern. Deloitte’s economics team has been optimistic, but we’ve been forced to rethink our near-term outlook. It’s not that we’ve become suddenly pessimistic—but we have had to face the facts. Unexpected weakness in the first quarter and indications that the second quarter will also be weak make our previous forecast for 2015 simply impossible (or, at least, highly improbable). John Maynard Keynes is supposed to have said, “When the facts change, I change my mind. What do you do, sir?” And there’s not much question about the facts for the first half of 2015.
The US economy surprised us in two ways in the first half of this year:
- The dollar’s impact on US trade—especially on exports—was stronger and faster than past experience would have indicated.
- The immediate impact of lower oil prices on US energy investment was larger than we expected. And, US consumers did not respond to lower gasoline prices by increasing other purchases. Instead, the US household savings rate went up a full percentage point, from 4.4 percent in November to 5.4 percent in January, even as oil prices were falling at a rate of over $13 per month. The lack of an offset for lower energy investment spending has definitely hurt GDP in the short run, even if we can expect non-energy firms—which account for most of the economy—to eventually greenlight a lot more investment spending based on cheaper-than-expected energy prices.
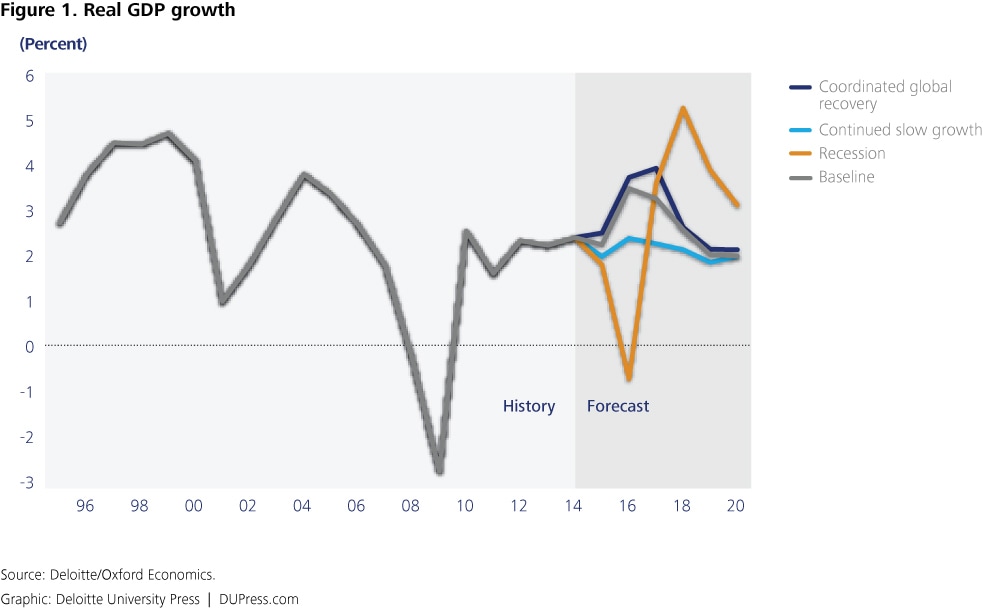
With GDP growth of 0.2 percent in the first quarter (as of the first release) and expected GDP growth below 1.0 percent in the second quarter, it is virtually impossible for GDP growth in 2015 to reach our previously expected 3.5 percent. In fact, it may be difficult for growth to reach 2.5 percent in 2015, even if we see GDP growth rates in the 3–4 percent range in the second half of the year.
We’ve also taken this opportunity to revisit our medium-term productivity forecast. We had a very generous assumption for average productivity growth in our previous forecasts. Our new forecast includes a lower projection for business investment and a lower assumption for multifactor productivity growth, giving us a productivity growth forecast of 1.3 percent in our baseline.
But we remain optimistic! We still expect strong growth after the second quarter of 2015, and for growth to reach 3.5 percent in 2016. We continue to see plenty of room for labor force growth as the economy picks up and people are enticed back into searching for jobs. Add the relatively large number of potential workers who will be willing to reenter the job market once they think it is worthwhile, and continued productivity growth, and there is little chance of accelerating inflation. And yes, lower oil prices—even if they are now slowly moving back up—will be good for the economy. We might just have to wait another quarter or two before we experience it.
Deloitte Oil price forecast
The oil price forecast underlying our economic forecast is provided by Deloitte MarketPoint LLC (DMP). DMP uses a proprietary fundamental economic model of the global oil market which simultaneously simulates global market competition and supply-demand equilibrium across the crude and refined products supply chain.
DMP’s latest Spring 2015 Reference Case Forecast is now reflected in the Deloitte baseline US economic forecast. DMP expects the Brent price to average $66 per barrel in 2015 and then rise gradually over the next few years until it reaches a new steady range of $75–85/bbl through 2025. This new equilibrium price is approximately $20/bbl lower than the steady state in previous forecasts, because it reflects two new circumstances in the marketplace:
- Prior to the “shale revolution,” there was a scarcity premium of roughly $10–20/bbl in place. With the newfound abundance of tight oil in the United States and potentially other areas around the globe, that scarcity premium has been nearly eliminated. This scarcity premium could return quickly with major changes to the market such as new tight oil production regulations or geopolitical issues creating or threatening supply disruptions.
- Producers in US tight oil plays continue to improve their margins through technological innovation. While their margins will be lower in the new equilibrium-price environment, they should still be able to operate profitably.
For more information, please contact Deloitte Marketpoint (www.deloittemarketpoint.com).
Scenarios
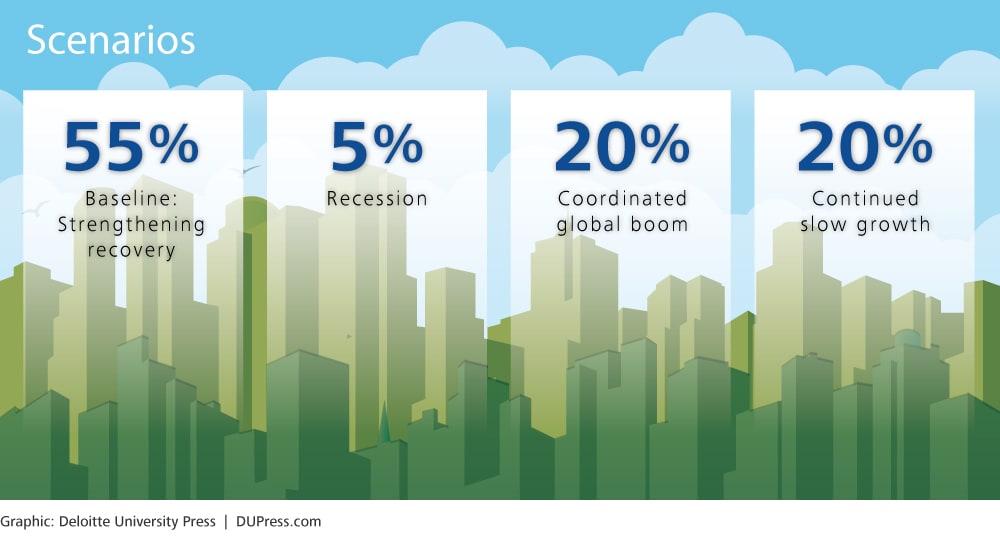
There are plenty of reasons why actual economic growth might be better or worse than Deloitte’s forecasted baseline. The Deloitte forecast, therefore, includes four different scenarios to illustrate possible future paths of the US economy that are worth thinking about. Deloitte’s economic forecasting team places subjective probabilities on each of the scenarios.
The baseline (55 percent): The most likely outcome for the economy is a burst of mildly faster growth as risks from abroad and at home fade away. Continued improvement in the labor market and growing demand from abroad increase demands on US producers, and the continued low cost of capital and low oil prices add to the pressure to build capacity. Growing business investment cements the recovery and, as hiring picks up, the labor force participation rate of younger cohorts will begin to rise. The large amount of slack will prevent rising demand from being translated into inflation, despite relatively accommodative Fed policy.
Recession (5 percent): One or more countries are forced to exit the euro, raising questions about the valuation of euro assets. These questions then affect several US financial institutions that find themselves long on euro assets at the wrong time. The result is a global financial panic. China’s own financial bubble finally catches up with the country, adding to the panic. Chinese and East Asian growth sputter while Europe plunges back into recession. Capital flows into the United States to avoid risk in Europe and Asia, and the US dollar appreciates. The combination of low foreign demand and financial panic throws the US economy into recession. Timely Fed action offsets the financial crisis after several months, but the impact of low demand, a troubled financial system, and the resulting hit to confidence keep the economy growing slowly. An eventual recovery leads to relatively fast growth several years from now.
Continuing slow growth (20 percent): Weak economic conditions abroad, incomplete fixes to the financial system, and a mismatch between labor needs and the skills of the labor force slow US economic growth to 2 percent for the foreseeable future. As the long-term unemployed become essentially unemployable, the labor force participation rate remains low, and, wages start to rise. The hoped-for improvement in competitiveness from domestic energy production proves to be less impressive than expected. Incipient signs of inflation cause the Fed to raise interest rates to prevent inflation from getting out of hand.
Coordinated global boom (20 percent): European restructuring is successful, and Europe starts recovering quickly. Emerging markets also pick up momentum as financial problems are resolved in China, and India and Brazil start to adopt more reforms. Capital flows out of the United States and into Europe and the developing world, which causes the dollar to depreciate, further enhancing US exports. Lower energy prices in the United States make the country even more competitive. At home, the resolution of budget issues at both the federal and state levels allows more money to flow into infrastructure investment, creating short-term demand and long-term productivity growth. Growth attracts workers back into the labor market, preventing inflation from picking up and allowing the Fed some room to leave interest rates low in the near term, although booming growth eventually pushes interest rates up above the baseline level.
What’s been happening?
For the second year in a row, first-quarter GDP delivered a rude awakening to forecasters expecting that this year would (finally) see GDP growth accelerate. Yes, there were plenty of special factors at work. But with just 2.2 percent growth in the fourth quarter of 2014, and second-quarter prospects looking dim, that’s a three-quarter run of poor to mediocre growth. The US economy hasn’t yet reached “escape” velocity.
That’s not to say that there hasn’t been some good news along the way. Despite weak output growth, employment growth dipped below 100,000 for just one month—and has otherwise maintained a pace of 200,000 per month since March 2014. That’s a great record for a labor market that just a few years ago was considered practically moribund. That consumers chose to save, rather than spend, their windfall from lower oil prices isn’t so bad, either. Keeping consumer balance sheets healthy is pretty important for the long-run stability of the economy. And US consumers are forcing global policymakers to confront the need for other drivers of global demand.
Many of the conditions that should generate faster growth remain in place.
- Oil prices remain relatively low, at around $60 per barrel. There is no reason to think that non-energy industries will find the decline in oil prices to be anything but beneficial. While it may take time, the oil price collapse of late 2014 should eventually be reflected in more investment spending.
- Residential construction is still below the level required to house the new households that will be forming as the labor market improves. It is certainly possible that the new housing construction will take the form of multiunit buildings rather than single family homes. But the pent-up demand is there.
- The strong job market has been accompanied by a pick-up in wages. That will strengthen household balance sheets—and consumers will eventually open their wallets and spend the extra income.
Despite signs that growth will accelerate soon, the Fed is likely to be very careful in deciding when to tighten policy. The consensus among Fed watchers is that the Fed will take its first tightening action at the September meeting. That’s a delay from a few months ago, when the consensus expected the June meeting to be the time of the first funds rate hike. But it’s not clear that there will be enough positive news by September, especially since the GDP release in August (for the second quarter) is likely to be weak as well. The Deloitte forecast has the first funds rate hike at the January FOMC meeting.
The current Congress is proving to be surprisingly effective in some ways. The most dramatic example was the elimination of one of several “temporary” measures that are effectively permanent but require renewal each year. The renewal process for these measures creates substantial business uncertainty without any reason other than (perhaps) additional business for the lobbying profession. But in April Congress made the “doc fix” (the suspension of what would otherwise have been an unrealistically large cut in payments to Medicare providers) permanent. Could this be a precursor to similar a greement on making the R&E tax credit—a subject of great interest to business—permanent as well?
Congress also passed a (nonbinding) budget resolution—the first time in five years that it has completed this initial step in the budget process. That’s less impressive than it seems, as the resolution doesn’t require presidential approval. The hard part will be writing the 13 appropriations bills to meet the targets set in the resolution. Since the budget resolution was passed on a party-line vote, this may prove more difficult than some observers expect. And the debt ceiling limit continues to loom. In fact, it’s already in effect as of March 15. But the Treasury has a number of “extraordinary measures” that will allow Congress to put off raising the ceiling until next fall (or, by some accounts, next January), which means this summer will likely see heated debate about both the debt ceiling and the appropriations bills.
Sectors
Consumers
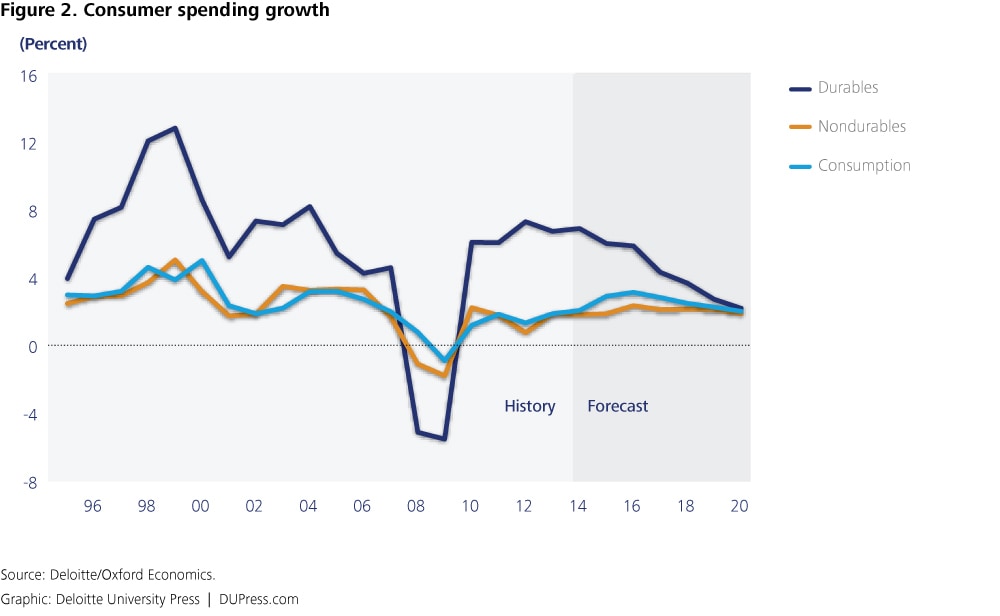
Ah, the US consumer—long-time supporter of the global economy, and still surprisingly resilient. Of course, consumers can’t spend money they don’t have, and their incomes largely depend on having jobs. Job growth has picked up. But US consumers have started sending a message to the rest of the world. They cannot continue to play Atlas, holding the global economy on their shoulders as they did in the 2000s. Our forecast expects the US savings rate to settle in at about 4.5 percent, about a percentage point lower than the current level. This is a good bit higher than in the previous decade, but consistent with consumers’ behavior in the 1990s.
US households actually face some pretty daunting obstacles in their pursuit of the good life. The biggest of these is growing income and wealth inequality. The recent publication of Thomas Pikkety’s book on inequality has created a surprising stir for a 600+ page tome on economics, replete with charts and data. For a brief summary of some of the problems raised in the book, see the Deloitte Review article “Mind the gap” by Ira Kalish.1 The great interest in the topic suggests that US economic policy debates are likely to focus more on inequality than they did in the past.
Many US consumers spent the 1990s and the 2000s trying to keep up their spending when incomes were stagnant. After all, they kept being assured that technology was transforming the US economy and should be transforming their lives. But now they are wiser (and older, which is another problem as retirements loom without sufficient savings). As long as a large share of the gains from technology and other economic improvements flow to a relatively small number of households, overall US consumer spending is likely to remain relatively restrained.
Consumer news
Real personal consumption expenditures fell slightly in the first quarter after rising over 4.0 percent in four of the previous five quarters. The savings rate rose to over 5 percent for the three months ending in March. What happened? US consumers banked the savings from lower gasoline prices, a surprising change from past behavior.
Retail sales rose in March but were flat again in April. Although this reflected auto sales, non-auto retail sales followed this pattern as well. This occurred despite the fact that both major surveys of consumer confidence are at very high levels—levels that are normally seen during periods of strong economic recovery.
Housing
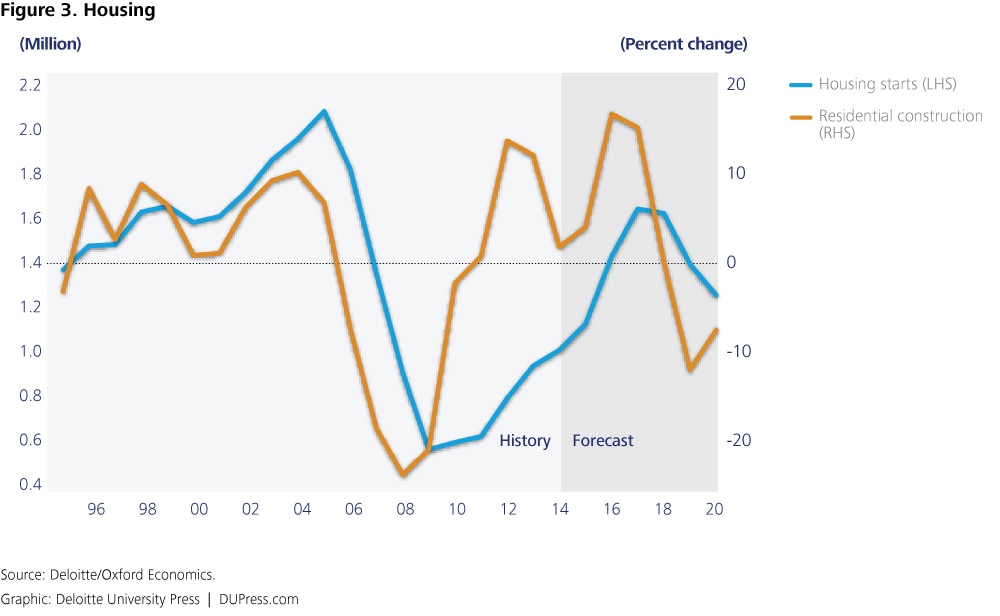
It happens every year. Young people become old enough to leave home and start their own households. But it stopped happening during the recession. The number of households didn’t grow nearly enough to account for all the newly minted young adults. We expect those young adults would prefer to live on their own and create new households; as the economy recovers, they will do exactly that.
This means some positive fundamentals for housing construction in the short run. The United States hasn’t been building as many new housing units as the population would normally require for about seven years, since 2008. In fact, housing construction was hit so hard that the oversupply turned into an undersupply, so there’s a hole that needs to be filled. But the hole isn’t as large as you might think. Several factors offset each other:
- If household size returns to the levels we experienced in the mid-2000s, we would need an additional 3.2 million units.
- On the other hand, household vacancy rates are much higher than normal. If household vacancy returned to normal, an additional 2.5 million units would be available—which would fill 78 percent of the pent-up demand for housing units.
- But are the existing vacant houses in the right place or condition, or are they the right type, for that pent-up demand? The future of housing may look very different than in the past. Growth in new housing construction has been concentrated in multifamily units. If that continues, we may find it is related to the fact that existing single-family units are not needed, despite strong demand for apartments.
We developed our housing forecast based on these factors. We assumed that the demand for housing (in the form of falling size of the average household) picks up in 2016, vacancy rates gradually drop, and household depreciation starts falling after about 2.5 million housing units are removed from the housing stock. Despite these relatively robust assumptions, slowing population growth suggests that we will have a short-lived housing boom in which starts hit the 1.5–1.6 million level, followed by a period of contraction until starts reach the level of long-run demand. We estimate this to be just 1.2 million units in the medium term. Housing will contribute to growth in 2016 but subtract from growth by 2018 as the pent-up demand goes away. In the long run, the slowing population suggests that housing will not be a growth sector (although specific segments, such as old-age housing, might well be very strong).
Housing credit remains tight and may be a key culprit in keeping individual purchases of single-family houses low. Young adults also seem to be showing a preference for living in urban rather than suburban communities. There may be some significant changes from the post–World War II model of single-family home ownership in store.
Housing news
Housing permits and starts bounced up in March to over 1.1 million units. That’s a record for this recovery. Much of the strength in housing is in construction of multiunit buildings, which have returned to their pre-recession levels. Construction of single-family homes remains weak. Contract interest rates on conventional home mortgages have been flat for a long time, at around 4.0 percent. The Case-Shiller home price index seems to have stabilized, and even rose slightly in February. All of this left affordability unchanged in the past few months.
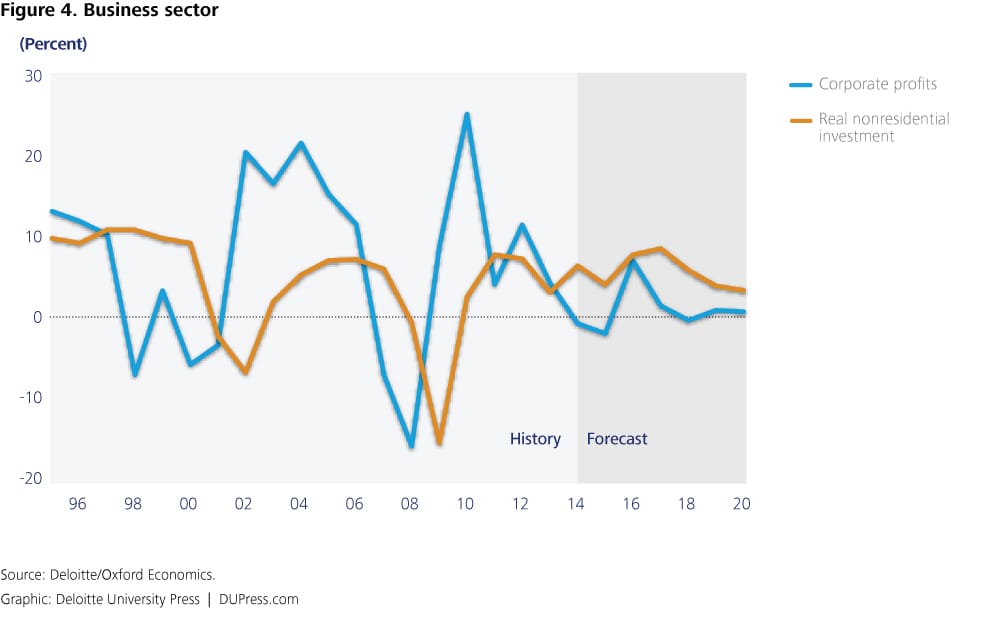
Business investment
There has been a lot of sad talk about the impact of political uncertainty on business decisions since the end of the recession. In fact, relative to GDP, business investment was one of the better-performing sectors in this recovery. With strong profit growth, however, businesses might have been expected to invest even more. The reasons for this are complex.2 Many businesses are still waiting for assurance that they will have customers. Once those customers return, there will be more reason to ramp up investment. Watch what businesses do, not what they say.
The fall in oil prices is a complicating factor in this positive outlook. Oil and gas extraction accounted for 6 percent of all nonresidential fixed investment in 2013. That’s a hefty amount (considerably larger than the value-added share of the sector). So it’s not surprising that, when investment in mining exploration, shafts, and wells fell almost 50 percent at an annual rate in the first quarter, total business investment looked very weak. Other types of investment, including equipment investment, also experienced a weak first quarter. This may reflect a decline in production of energy-related equipment and machinery. However, it seems unlikely that the big drop in the price of oil in late 2014 won’t eventually affect the 94 percent of business investment which is not related to oil and gas extraction.
Business investment news
Business fixed investment grew very slowly in the fourth quarter. Equipment investment fell 1.9 percent after rising at over 11 percent for the previous two months. Structures investment grew 2.6 percent, down a bit from the third quarter.
Nondefense capital goods shipments—the best high-frequency measure of equipment spending—were up in April and March after falling substantially in February. Figures for capital goods shipments less aircraft were similar.
Private nonresidential construction rose in March by 1.0 percent after rising 0.5 percent in February. Office and Manufacturing contributed significantly to the increase, while a decline in Commercial construction offset some of the rise.
Interest rates remained stable. The stock market has continued to rise, although at a slower rate than last year (with a 12-month growth rate of around 12 percent in April 2015 compared to 18 percent in April 2014). The cost of capital remains quite low, and profits are still at near-record levels of national income.
Foreign trade
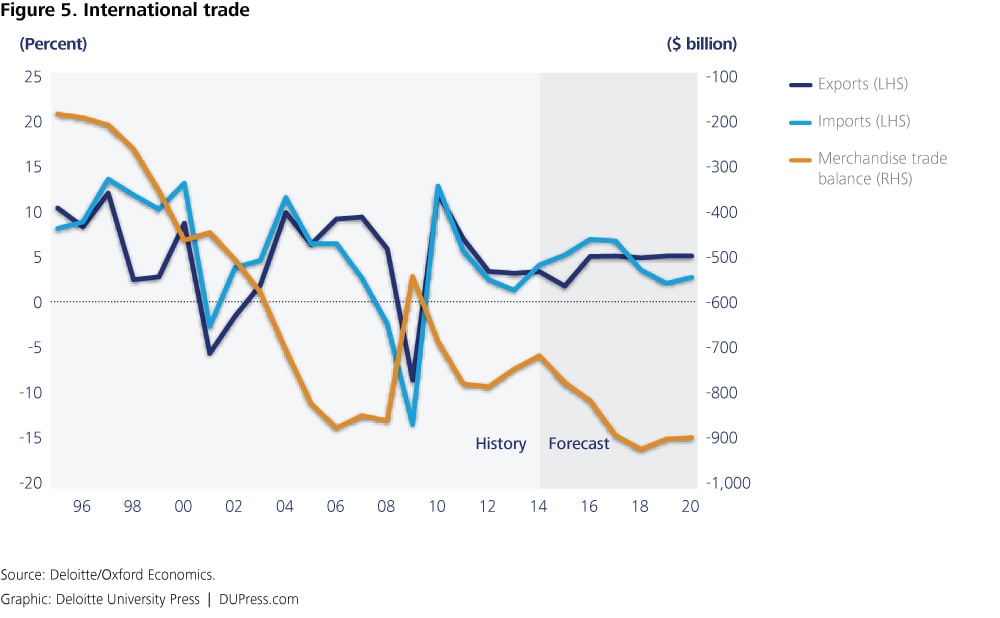
The United States has long had a voracious appetite for foreign goods, and that’s not going to stop. In the baseline forecast, imports accelerate along with GDP growth.
However, exports look to prove a pleasant surprise. Not in the near term, as the dollar is up quite a bit recently—over 12 percent in the past year. That’s a consequence of the continued desire of investors around the world to hold safe US assets. But the dollar rise also contributes to the possibility of US export growth in the future. Once foreign risks recede, capital will flow out of the United States, and the dollar will fall. The possibility of a depreciating dollar is welcome because it could help improve US competitiveness and put capital where it does the most good globally in the long run.
A variety of improvements, ranging from the United States’ lead in technology to cheap natural gas, will also help make US manufacturing more competitive with foreign goods.
This forecast assumes that both China and Europe overcome their financial problems and begin to grow again. Growth in these areas represents opportunity for US firms, which we think the firms are ready to take advantage of.
Foreign trade news
US trade figures in February and March were affected by the strike/slowdown at the Port of Los Angeles/Long Beach. January imports fell 3.6 percent, and February imports another 4.2 percent. After the problem was solved in late February, the ports worked overtime to bring in the backlog, and March imports were up 7.7 percent. Exports saw a similar, but more muted, pattern. As a result, it is difficult to interpret recent trade data. However, it is likely that exports are trending lower because of the appreciation of the dollar.
The trade-weighted dollar rose at an average rate of over 2.0 percent per month in December and January. That reflected not only the fall of the euro on the news of Greek elections but also the continued decline of the Canadian dollar and the Mexican peso. Both of the other major North American currencies have been depreciating against the dollar as oil prices fall, and together they account for a larger share of US trade than the Eurozone. The yen was also appreciating, but it leveled off in January.
Europe is once again showing signs of recovery. Industrial production has been up in three of the last four months in the European Union. Of course, much depends on whether European policymakers can move beyond the current perceptions of risk in the euro system. Greece met a mid-May payment deadline, but a long-term solution remains elusive, and the risk of a blow-up remains significant.
The Chinese authorities are trying to manage a bursting financial bubble while preventing future speculation. This is difficult (as both US and European authorities know quite well). The result is easing monetary policy coupled with regulations to prevent the additional liquidity from being used in ways that might create future harm—and what appears to be slowing growth. Slowing growth in China poses significant risks to growth in East Asia, and in the United States.
Government
Government spending on goods and services has been stagnant, and we don’t expect much change in the next few years. That’s actually an improvement from the 2010 to 2013 period, when government spending provided a large drag on economic growth.
At the federal level, it is hard to see Congress and the president agreeing on significant new spending. And there is a risk that spending will fall even further. That might be good for longer-term federal finances, but would put additional pressure on near-term economic growth.
State and local governments are no longer cutting spending; They are getting some good revenue news from rising house prices and growing employment. But those pesky pension liabilities continue to restrain state and local spending. The Congressional Budget Office estimates that there is a shortfall of $2–3 trillion in state and local pension funding. The need to fund these liabilities is likely to keep the lid on state and local spending growth.
Government news
The federal deficit was about $23 billion lower than the previous year for the first seven months of the fiscal year. This is an improvement over earlier in the year, when the deficit was actually a bit worse. It reflects continued job growth despite the slow economy. By April, revenues were up 8 percent over the year-earlier period, while outlays were up 6 percent.

Labor markets
If the US economy is going to produce more goods and services, it will need more workers. As long as the labor market is out of balance, the currently moderate wage growth will eventually encourage firms to increase capacity by hiring workers. However, employment growth is more likely to occur in industries such as health care and recreation services than in manufacturing. Accelerating production will carry with it an eventual acceleration in employment—and even a welcome mild acceleration in wages.
But a great many people have been out of work for a long time—long enough that their basic work skills may be eroding. When the labor market tightens up, will those people be employable? As labor markets begin to tighten, the long-term damage of the 2007–2009 recession will become measurable.
One unusual feature of the current recovery is the decline in the number of government workers. Government jobs were once thought of as recession-proof, but that’s not the case anymore. There isn’t a lot of desire for increased government spending. As a result, government employment is likely to grow slowly at best in the next few years, which may constrain job growth.
Deloitte labor force projections
The overall labor force participation rate will be affected by two offsetting trends in the near term. The aging of the population—and in particular, the entrance of early Baby Boom cohorts into retirement age in the next five years—will push the participation rate down. However, participation rates for younger cohorts have fallen substantially because of the poor labor market. The economic improvement in the forecast will almost certainly entice many people in these middle-aged and, especially, younger cohorts to return to the labor market.
The labor force projection in this forecast assumes the following:
- Labor force participation rates for over-60s will remain at current levels.
- Labor force participation rates for under-30s will return to their 1997–2000 average.
- Labor force participation rates for 30–60-year-olds will return to the 2002–2007 average.
Labor market news
Initial claims for unemployment insurance have been trending down over the past two or three months. In the first part of May, claims averaged under 270,000. This is the lowest level in over 15 years.
Payroll employment grew at an average rate of just under 200,000 in the three months ending April. The average rate was pulled down by a low March, but that was the first month since April 2014 when job growth was under 200,000. The unemployment rate continued falling slowly. Unfortunately, the participation rate is stuck in the 62.7 percent to 62.9 percent range, which suggests that a substantial number of people are still unwilling to enter the labor market.

Financial markets
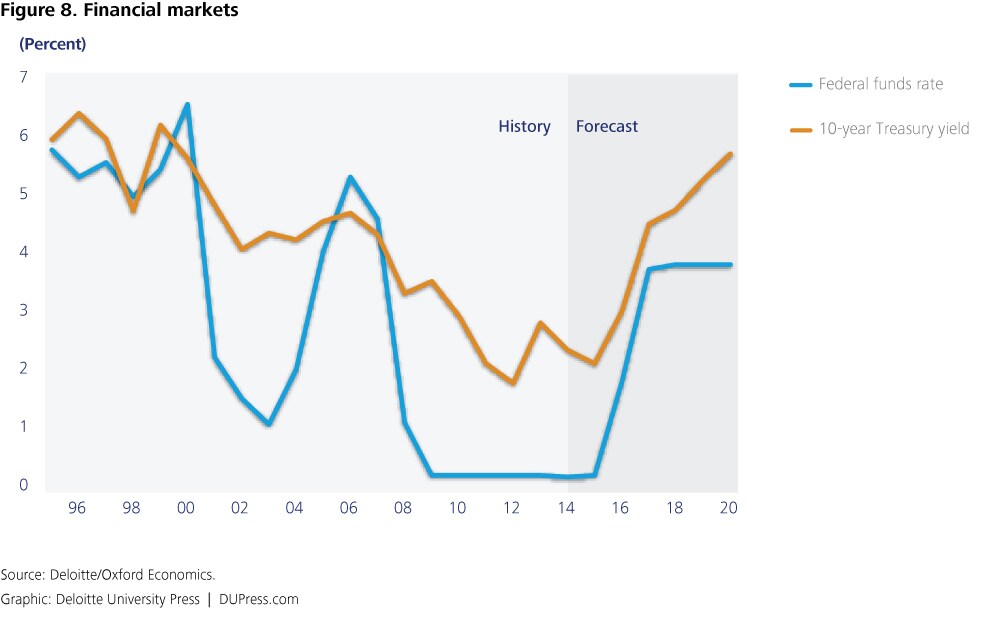
Interest rates are among the most difficult economic variables to forecast because movements depend on news. And if we knew it, it wouldn’t be news. The Deloitte interest-rate forecast is designed to show a path for interest rates consistent with the forecast for the real economy. But the potential risk for different interest-rate movements is higher here than in other parts of our forecast.
The forecast sees both long- and short-term interest rates headed up—maybe not this week, and maybe not this month, but sometime in the future. The forecast shows the economy accelerating this year, and a healthy economy will mean that lending will once again become costly. The forecast moves interest rates back to “normal” levels as economic growth accelerates. That’s not a bad thing—unless returning to normal is bad.
Of course, some investors may be caught short. Those are the people who think that interest rates will remain low forever. Some of those will even be so-called sophisticated investors, so plenty of worried headlines will appear when interest rates go up. Don’t be fooled by what is just a (yes) welcome return to normal.
But the most sophisticated observers of financial markets know the most important thing about interest rates—they will fluctuate. This is the sector that is most likely to surprise us.
This forecast expects the Fed to start raising the funds rate at the Federal Open Market Committee meeting scheduled for late January, 2016. This is later than the current consensus, but we believe it reflects the careful approach that most members of the FOMC have been taking to signs of economic growth. With little inflationary pressures, the Fed can afford to wait. Earlier meetings will confront the problem of raising rates when the most recent GDP figures (from the second quarter) are likely to be weak. The baseline forecast then assumes that the Fed will continue to raise the rate by 25 basis points at each meeting until the funds rate reaches 3.75 percent. This corresponds to the current views of the FOMC, as all but four participants currently see the appropriate target for the funds rate in the longer run as either 3.5 percent or 3.75 percent.
Financial market news
The Fed kept the funds rate target at between 0 percent and 0.25 percent. FOMC members indicated that a rate hike was unlikely this summer. Longer term rates remained low, with an average 10-year Treasury yield in April below 2.0 percent. Low long-term rates reflected continuing concern about the medium-term prospects in financial markets in both Europe and China. Risk spreads (junk bond yields relative to investment grade bond yields) remained about 80 basis higher than at the same time last year).
Stock prices continued to trend upward, at the rate of about 1 percent per month. As a result, P/E ratios grew. The S&P 500 P/E ratio stood at 21.1 in April, up from 18.3 in April 2014.
Prices
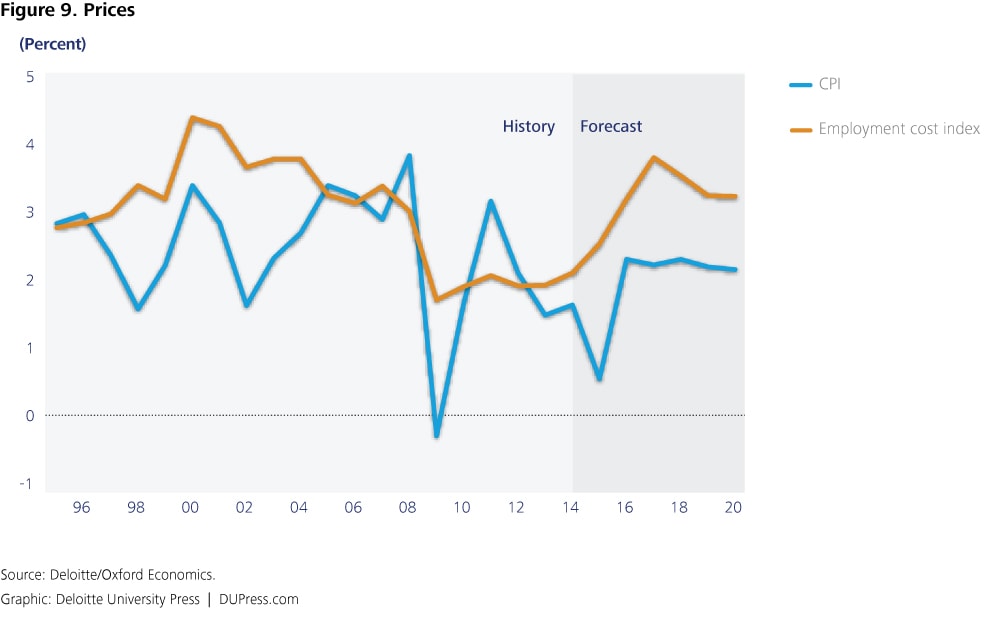
Remember those folks who were convinced that the Fed’s actions in 2009 would create runaway inflation? Likely they rather you didn’t. Prices have been the most boring part of forecasting for the past six years, and there is no reason to think that’s going to change.
Inflation is hard to come by when the labor market—which accounts for two-thirds of all costs in the US economy—has been so slack. Workers haven’t had leverage to obtain higher wages when prices go up, and businesses don’t have the pricing power to cover higher costs. Instead, shocks from higher energy or food prices have just dissipated into the ether rather than being translated into sustained, higher inflation.
That means that inflation will likely remain tame at least until the economy reaches full employment. Although employment growth in the past couple of years has whittled away at the potential employment surplus, it’s still pretty large, and bigger than the unemployment rate indicates. So don’t hold your breath waiting for the return of the 1970s. Bell bottoms, disco, and high inflation are all safely in our past (for now).
Price news
Rising gasoline prices in February and March pushed up the overall CPI, although increases of 0.2 percent per month indicate very little in the way of inflationary pressures. The overall CPI is still slightly lower than it was a year ago.
The final demand producer price index (PPI) plunged in three of the last four months, despite the recent rebound in energy prices.
Year-over-year growth in compensation for private sector workers has started to accelerate. The latest reading (for the first quarter) was 2.75 percent, the highest since 2008. This may indicate some price pressures building. There are few differences among broad occupational groups—except for construction and extraction, compensation is rising for most occupations.
Appendix: Deloitte economic forecast
Table 1. Deloitte US forecast: Baseline
Percent change, year over year unless otherwise noted.
| 2010 | 2011 | 2012 | 2013 | 2014 | 2015 | 2016 | 2017 | 2018 | 2019 | 2020 | |
| History | Forecast | ||||||||||
| GDP components | |||||||||||
| Real GDP | 2.5 | 1.6 | 2.3 | 2.2 | 2.4 | 2.2 | 3.5 | 3.3 | 2.6 | 2.0 | 2.0 |
| Real consumer spending | 1.9 | 2.3 | 1.8 | 2.4 | 2.5 | 3.0 | 3.3 | 2.9 | 2.6 | 2.3 | 2.0 |
| Real consumer spending, durable goods | 6.1 | 6.1 | 7.3 | 6.7 | 6.9 | 6.0 | 5.9 | 4.3 | 3.7 | 2.7 | 2.2 |
| Real consumer spending, nondurable goods | 2.2 | 1.8 | 0.8 | 1.9 | 1.8 | 1.9 | 2.4 | 2.1 | 2.2 | 2.1 | 1.9 |
| Real consumer spending, services | 1.2 | 1.8 | 1.3 | 1.9 | 2.1 | 2.9 | 3.1 | 2.8 | 2.5 | 2.3 | 2.0 |
| Real investment in private housing | -2.5 | 0.6 | 13.5 | 11.9 | 1.6 | 3.8 | 16.5 | 15.0 | -0.1 | -12.2 | -7.7 |
| Real fixed business investment | 2.5 | 7.7 | 7.2 | 3.1 | 6.3 | 4.0 | 7.7 | 8.4 | 5.8 | 3.8 | 3.3 |
| Real inventory accumulation | 58.2 | 37.6 | 57.1 | 63.6 | 70.6 | 81.1 | 92.5 | 88.8 | 62.8 | 42.0 | 35.8 |
| Real exports of goods and services | 11.9 | 6.9 | 3.3 | 3.1 | 3.2 | 1.6 | 4.9 | 5.0 | 4.8 | 5.0 | 5.0 |
| Real imports of goods and services | 12.7 | 5.5 | 2.3 | 1.1 | 4.0 | 5.1 | 6.8 | 6.6 | 3.4 | 1.9 | 2.6 |
| Real government consumption and investment | 0.1 | -3.0 | -1.5 | -2 | -0.2 | 0.4 | 0.4 | 0.5 | 0.6 | 0.7 | 0.8 |
| Real federal government consumption and investment | 4.3 | -2.7 | -1.8 | -5.7 | -1.9 | -0.1 | -0.2 | -0.4 | -0.3 | -0.1 | 0.6 |
| Real state and local government consumption and investment | -2.7 | -3.3 | -1.2 | 0.5 | 1.0 | 1.0 | 1.1 | 1.2 | 1.2 | 1.2 | 1.2 |
| Prices | |||||||||||
| Consumer price index | 1.6 | 3.1 | 2.1 | 1.5 | 1.6 | 0.5 | 2.3 | 2.2 | 2.3 | 2.2 | 2.1 |
| Chained price index for personal consumption expenditures | 1.7 | 2.5 | 1.8 | 1.2 | 1.3 | 0.6 | 2.0 | 2.0 | 2.0 | 2.0 | 1.9 |
| Chained GDP price index | 1.2 | 2.1 | 1.8 | 1.5 | 1.5 | 1.1 | 2.4 | 2.1 | 1.9 | 1.9 | 1.9 |
| Employment cost index | 1.9 | 2.0 | 1.9 | 1.9 | 2.1 | 2.5 | 3.2 | 3.8 | 3.5 | 3.2 | 3.2 |
| Labor markets | |||||||||||
| Average monthly change in employment | 65 | 165 | 184 | 205 | 245 | 223 | 195 | 147 | 133 | 58 | 69 |
| Unemployment rate (percent) | 9.6 | 8.9 | 8.1 | 7.4 | 6.2 | 5.4 | 5.3 | 5.3 | 5.4 | 5.4 | 5.4 |
| Employment-to-population (percent) | 58.5 | 58.4 | 58.6 | 58.6 | 59 | 59.6 | 60.1 | 60.3 | 60.4 | 60.2 | 59.9 |
| Income and wealth | |||||||||||
| Real disposable personal income | 1.0 | 2.5 | 3.0 | -0.2 | 2.5 | 3.1 | 2.8 | 3.2 | 2.6 | 1.8 | 1.8 |
| Net household wealth ($ trillions) | 62 | 64 | 70 | 79 | 83 | 95 | 100 | 104 | 111 | 114 | 118 |
| Personal saving rate (percent of disposable income) | 5.6 | 6.0 | 7.2 | 4.9 | 4.8 | 4.8 | 4.3 | 4.7 | 4.8 | 4.5 | 4.3 |
| After-tax corporate profits with corporate profits with inventory valuation and capital consumption adjustments | 25 | 4.0 | 11.4 | 4.2 | -0.8 | -2.0 | 6.9 | 1.4 | -0.4 | 0.8 | 0.6 |
| Housing | |||||||||||
| Housing starts (thousands) | 586 | 612 | 784 | 930 | 1,001 | 1,118 | 1,422 | 1,634 | 1,615 | 1,387 | 1,247 |
| Stock of owner occupied homes (millions) | 132 | 132 | 132 | 133 | 133 | 134 | 135 | 136 | 137 | 139 | 140 |
| Interest rate on 30-year fixed-rate mortgages (percent) | 4.69 | 4.46 | 3.66 | 3.98 | 4.17 | 3.83 | 4.3 | 6.03 | 6.97 | 7.29 | 7.65 |
| Foreign trade | |||||||||||
| Current account balance, share of GDP (percent) | -3.0 | -3.0 | -2.9 | -2.4 | -2.4 | -2.6 | -2.6 | -2.7 | -2.7 | -2.5 | -2.4 |
| Merchandise trade balance ($ billions) | -691 | -784 | -791 | -752 | -722 | -782 | -822 | -899 | -929 | -907 | -903 |
| Relative unit labor costs (Index, 2008=100) | 93.6 | 87.1 | 84.2 | 80.9 | 80.9 | 83.6 | 83.5 | 81.9 | 80.3 | 78.5 | 76.7 |
| Financial | |||||||||||
| Federal funds rate (percent) | 0.13 | 0.13 | 0.13 | 0.13 | 0.1 | 0.13 | 1.73 | 3.67 | 3.75 | 3.75 | 3.75 |
| Yield on 10-year treasury note (percent) | 2.86 | 2.05 | 1.71 | 2.75 | 2.28 | 2.05 | 2.94 | 4.44 | 4.69 | 5.2 | 5.65 |
| Government | |||||||||||
| Federal budget balance, unified basis (share of GDP, percent) | -8.9 | -8.5 | -7.3 | -4.3 | -2.9 | -2.6 | -2.3 | -2.4 | -2.7 | -3.3 | -3.7 |
| Sources: Historical data: US government agencies and Oxford Economics. Forecast: Deloitte, using the Oxford Global Economic Model. | |||||||||||
Table 2. Coordinated global recovery
Percent change, year over year unless otherwise noted.
| 2010 | 2011 | 2012 | 2013 | 2014 | 2015 | 2016 | 2017 | 2018 | 2019 | 2020 | |
| History | Forecast | ||||||||||
| GDP components | |||||||||||
| Real GDP | 2.5 | 1.6 | 2.3 | 2.2 | 2.4 | 2.5 | 3.7 | 3.9 | 2.6 | 2.1 | 2.1 |
| Real consumer spending | 1.9 | 2.3 | 1.8 | 2.4 | 2.5 | 3.0 | 3.5 | 3.7 | 2.4 | 1.9 | 1.9 |
| Real consumer spending, durable goods | 6.1 | 6.1 | 7.3 | 6.7 | 6.9 | 6.1 | 6.2 | 5.0 | 3.5 | 2.5 | 2.3 |
| Real consumer spending, nondurable goods | 2.2 | 1.8 | 0.8 | 1.9 | 1.8 | 1.9 | 2.6 | 3.0 | 2.0 | 1.7 | 1.8 |
| Real consumer spending, services | 1.2 | 1.8 | 1.3 | 1.9 | 2.1 | 2.9 | 3.4 | 3.7 | 2.3 | 1.8 | 1.9 |
| Real investment in private housing | -2.5 | 0.6 | 13.5 | 11.9 | 1.6 | 3.9 | 18.3 | 18.4 | -3.4 | -6.2 | -3.8 |
| Real fixed business investment | 2.5 | 7.7 | 7.2 | 3.1 | 6.3 | 4.4 | 8.6 | 10.4 | 6.2 | 3.5 | 3.5 |
| Real inventory accumulation | 58.2 | 37.6 | 57.1 | 63.6 | 70.6 | 121.1 | 130.5 | 117.2 | 111.4 | 120.7 | 128.9 |
| Real exports of goods and services | 11.9 | 6.9 | 3.3 | 3.1 | 3.2 | 2.3 | 5.2 | 5.2 | 4.8 | 5.0 | 5.1 |
| Real imports of goods and services | 12.7 | 5.5 | 2.3 | 1.1 | 4.0 | 6.0 | 7.3 | 8.1 | 2.5 | 1.6 | 2.8 |
| Real government consumption and investment | 0.1 | -3.0 | -1.5 | -2.0 | -0.2 | 0.4 | 0.4 | 0.5 | 0.6 | 0.7 | 0.8 |
| Real federal government consumption and investment | 4.3 | -2.7 | -1.8 | -5.7 | -1.9 | -0.1 | -0.2 | -0.3 | -0.3 | -0.1 | 0.6 |
| Real state and local government consumption and investment | -2.7 | -3.3 | -1.2 | 0.5 | 1.0 | 1.0 | 1.1 | 1.2 | 1.2 | 1.2 | 1.2 |
| Prices | |||||||||||
| Consumer price index | 1.6 | 3.1 | 2.1 | 1.5 | 1.6 | 0.5 | 2.0 | 1.9 | 2.1 | 2 | 2.2 |
| Chained price index for personal consumption expenditures | 1.7 | 2.5 | 1.8 | 1.2 | 1.3 | 0.6 | 1.8 | 1.6 | 1.9 | 1.8 | 2.0 |
| Chained GDP price index | 1.2 | 2.1 | 1.8 | 1.5 | 1.5 | 1.0 | 2.0 | 1.7 | 1.7 | 1.8 | 2.0 |
| Employment cost index | 1.9 | 2.0 | 1.9 | 1.9 | 2.1 | 2.5 | 3.1 | 3.6 | 3.4 | 3.1 | 3.3 |
| Labor markets | |||||||||||
| Average monthly change in employment | 65 | 165 | 184 | 205 | 245 | 261 | 205 | 179 | 126 | 73 | 79 |
| Unemployment rate (percent) | 9.6 | 8.9 | 8.1 | 7.4 | 6.2 | 5.3 | 4.8 | 4.6 | 4.8 | 4.8 | 4.7 |
| Employment-to-population (percent) | 58.5 | 58.4 | 58.6 | 58.6 | 59 | 59.7 | 60.4 | 60.7 | 60.9 | 60.6 | 60.4 |
| Income and wealth | |||||||||||
| Real disposable personal income | 1.0 | 2.5 | 3.0 | -0.2 | 2.5 | 3.1 | 3.0 | 3.5 | 2.6 | 1.9 | 1.8 |
| Net household wealth ($ trillions) | 62 | 64 | 70 | 79 | 83 | 95 | 107 | 108 | 111 | 112 | 116 |
| Personal saving rate (percent of disposable income) | 5.6 | 6 | 7.2 | 4.9 | 4.8 | 4.8 | 4.3 | 4.3 | 4.6 | 4.7 | 4.6 |
| After-tax corporate profits with corporate profits with inventory valuation and capital consumption adjustments | 25 | 4.0 | 11.4 | 4.2 | -0.8 | -1.4 | 6.0 | 3.8 | -1.3 | 1.3 | 1.6 |
| Housing | |||||||||||
| Housing starts (thousands) | 586 | 612 | 784 | 930 | 1,001 | 1,119 | 1,443 | 1,709 | 1,633 | 1,497 | 1,404 |
| Stock of owner-occupied homes (millions) | 132 | 132 | 132 | 133 | 133 | 134 | 135 | 136 | 137 | 139 | 140 |
| Interest rate on 30-year fixed-rate mortgages (percent) | 4.69 | 4.46 | 3.66 | 3.98 | 4.17 | 3.82 | 3.57 | 4.78 | 7.08 | 7.99 | 8.29 |
| Foreign trade | |||||||||||
| Current account balance, share of GDP (percent) | -3.0 | -3.0 | -2.9 | -2.4 | -2.4 | -2.7 | -2.9 | -2.6 | -2.0 | -1.7 | -1.6 |
| Merchandise trade balance ($ billions) | -691 | -784 | -791 | -752 | -722 | -790 | -840 | -960 | -967 | -933 | -933 |
| Relative unit labor costs (Index, 2008=100) | 93.6 | 87.1 | 84.2 | 80.9 | 80.9 | 83.6 | 83.4 | 81.3 | 79.7 | 77.7 | 75.9 |
| Financial | |||||||||||
| Federal funds rate (percent) | 0.13 | 0.13 | 0.13 | 0.13 | 0.1 | 0.13 | 0.17 | 3.14 | 4.43 | 4.47 | 4.37 |
| Yield on 10-year treasury note (percent) | 2.86 | 2.05 | 1.71 | 2.75 | 2.28 | 2.04 | 1.64 | 3.64 | 5.15 | 5.88 | 6.23 |
| Government | |||||||||||
| Federal budget balance, unified basis (share of GDP, percent) | -8.9 | -8.5 | -7.3 | -4.3 | -2.9 | -2.5 | -2.1 | -2.0 | -2.2 | -2.8 | -3.2 |
| Sources: Historical data: US government agencies and Oxford Economics. Forecast: Deloitte, using the Oxford Global Economic Model. | |||||||||||
Table 3. Continued slow growth
Percent change, year over year unless otherwise noted.
| 2010 | 2011 | 2012 | 2013 | 2014 | 2015 | 2016 | 2017 | 2018 | 2019 | 2020 | |
| History | Forecast | ||||||||||
| GDP components | |||||||||||
| Real GDP | 2.5 | 1.6 | 2.3 | 2.2 | 2.4 | 2.0 | 2.4 | 2.3 | 2.1 | 1.8 | 2.0 |
| Real consumer spending | 1.9 | 2.3 | 1.8 | 2.4 | 2.5 | 2.7 | 2.1 | 2.2 | 2.4 | 2.3 | 2.1 |
| Real consumer spending, durable goods | 6.1 | 6.1 | 7.3 | 6.7 | 6.9 | 6.0 | 5.5 | 3.8 | 3.1 | 2.3 | 1.8 |
| Real consumer spending, nondurable goods | 2.2 | 1.8 | 0.8 | 1.9 | 1.8 | 1.6 | 1.1 | 1.5 | 2.0 | 2.2 | 2.0 |
| Real consumer spending, services | 1.2 | 1.8 | 1.3 | 1.9 | 2.1 | 2.6 | 1.9 | 2.2 | 2.4 | 2.3 | 2.2 |
| Real investment in private housing | -2.5 | 0.6 | 13.5 | 11.9 | 1.6 | 3.2 | 11.1 | 9.6 | 0.0 | -12.6 | -8.1 |
| Real fixed business investment | 2.5 | 7.7 | 7.2 | 3.1 | 6.3 | 3.1 | 3.7 | 3.7 | 3.8 | 3.7 | 3.7 |
| Real inventory accumulation | 58.2 | 37.6 | 57.1 | 63.6 | 70.6 | 76.5 | 66.3 | 60.5 | 46.6 | 33.0 | 32.4 |
| Real exports of goods and services | 11.9 | 6.9 | 3.3 | 3.1 | 3.2 | 1.6 | 4.7 | 3.9 | 3.3 | 3.5 | 3.6 |
| Real imports of goods and services | 12.7 | 5.5 | 2.3 | 1.1 | 4.0 | 4.4 | 3.5 | 4.3 | 3.1 | 1.8 | 2.3 |
| Real government consumption and investment | 0.1 | -3 | -1.5 | -2 | -0.2 | 0.4 | 0.4 | 0.5 | 0.6 | 0.7 | 0.8 |
| Real federal government consumption and investment | 4.3 | -2.7 | -1.8 | -5.7 | -1.9 | -0.1 | -0.2 | -0.4 | -0.3 | -0.1 | 0.6 |
| Real state and local government consumption and investment | -2.7 | -3.3 | -1.2 | 0.5 | 1.0 | 1.0 | 1.1 | 1.2 | 1.2 | 1.2 | 1.2 |
| Prices | |||||||||||
| Consumer price index | 1.6 | 3.1 | 2.1 | 1.5 | 1.6 | 0.6 | 2.4 | 2.2 | 2.4 | 2.4 | 2.4 |
| Chained price index for personal consumption expenditures | 1.7 | 2.5 | 1.8 | 1.2 | 1.3 | 0.6 | 2.1 | 1.9 | 2.1 | 2.2 | 2.2 |
| Chained GDP price index | 1.2 | 2.1 | 1.8 | 1.5 | 1.5 | 1.1 | 2.5 | 2.2 | 2.1 | 2.1 | 2.1 |
| Employment cost index | 1.9 | 2.0 | 1.9 | 1.9 | 2.1 | 2.5 | 2.9 | 3.3 | 3.2 | 3.2 | 3.0 |
| Labor markets | |||||||||||
| Average monthly change in employment | 65 | 165 | 184 | 205 | 245 | 205 | 121 | 87 | 102 | 48 | 75 |
| Unemployment rate (percent) | 9.6 | 8.9 | 8.1 | 7.4 | 6.2 | 5.5 | 5.0 | 5.2 | 5.2 | 5.4 | 5.4 |
| Employment-to-population (percent) | 58.5 | 58.4 | 58.6 | 58.6 | 59.0 | 59.6 | 59.8 | 59.7 | 59.6 | 59.3 | 59.0 |
| Income and wealth | |||||||||||
| Real disposable personal income | 1.0 | 2.5 | 3.0 | -0.2 | 2.5 | 3.0 | 2.0 | 2.6 | 2.1 | 1.6 | 1.5 |
| Net household wealth ($ trillions) | 62 | 64 | 70 | 79 | 83 | 95 | 101 | 105 | 111 | 114 | 118 |
| Personal saving rate (percent of disposable income) | 5.6 | 6.0 | 7.2 | 4.9 | 4.8 | 5.0 | 4.9 | 5.3 | 5.1 | 4.5 | 4.0 |
| After-tax corporate profits with corporate profits with inventory valuation and capital consumption adjustments | 25 | 4.0 | 11.4 | 4.2 | -0.8 | -3.7 | 3.2 | 0.3 | 0.8 | 2.9 | 3.6 |
| Housing | |||||||||||
| Housing starts (thousands) | 586 | 612 | 784 | 930 | 1,001 | 1,111 | 1,348 | 1,478 | 1,461 | 1,249 | 1,118 |
| Stock of owner-occupied homes (millions) | 132 | 132 | 132 | 133 | 133 | 134 | 135 | 136 | 137 | 138 | 139 |
| Interest rate on 10-year fixed-rate mortgages (percent) | 4.69 | 4.46 | 3.66 | 3.98 | 4.17 | 3.83 | 4.02 | 5.17 | 6.13 | 6.64 | 7.26 |
| Foreign trade | |||||||||||
| Current account balance, share of GDP (percent) | -3.0 | -3.0 | -2.9 | -2.4 | -2.4 | -2.5 | -2.0 | -1.8 | -1.7 | -1.6 | -1.6 |
| Merchandise trade balance ($ billions) | -691 | -784 | -791 | -752 | -722 | -766 | -716 | -734 | -776 | -788 | -815 |
| Relative unit labor costs (Index, 2008=100) | 93.6 | 87.1 | 84.2 | 80.9 | 80.9 | 83.9 | 83.9 | 82.1 | 80.5 | 78.7 | 76.8 |
| Financial | |||||||||||
| Federal funds rate (percent) | 0.13 | 0.13 | 0.13 | 0.13 | 0.1 | 0.13 | 1.15 | 2.65 | 2.99 | 3.22 | 3.44 |
| Yield on 10-year treasury note (percent) | 2.86 | 2.05 | 1.71 | 2.75 | 2.28 | 2.05 | 2.45 | 3.42 | 3.89 | 4.63 | 5.33 |
| Government | |||||||||||
| Federal budget balance, unified basis (share of GDP, percent) | -8.9 | -8.5 | -7.3 | -4.3 | -2.9 | -2.6 | -2.5 | -2.6 | -3.1 | -3.6 | -4.1 |
| Sources: Historical data: US government agencies and Oxford Economics. Forecast: Deloitte, using the Oxford Global Economic Model. | |||||||||||
Table 4. Recession
Percent change, year over year unless otherwise noted.
| 2010 | 2011 | 2012 | 2013 | 2014 | 2015 | 2016 | 2017 | 2018 | 2019 | 2020 | |
| History | Forecast | ||||||||||
| GDP components | |||||||||||
| Real GDP | 2.5 | 1.6 | 2.3 | 2.2 | 2.4 | 1.8 | -0.7 | 3.6 | 5.3 | 3.9 | 3.1 |
| Real consumer spending | 1.9 | 2.3 | 1.8 | 2.4 | 2.5 | 2.9 | 0.4 | 2.7 | 4.5 | 4.1 | 3.7 |
| Real consumer spending, durable goods | 6.1 | 6.1 | 7.3 | 6.7 | 6.9 | 5.9 | 3.1 | 4.6 | 5.3 | 4.1 | 4.2 |
| Real consumer spending, nondurable goods | 2.2 | 1.8 | 0.8 | 1.9 | 1.8 | 1.8 | -0.6 | 2.0 | 4.2 | 4.1 | 3.6 |
| Real consumer spending, services | 1.2 | 1.8 | 1.3 | 1.9 | 2.1 | 2.8 | 0.3 | 2.7 | 4.5 | 4.1 | 3.7 |
| Real investment in private housing | -2.5 | 0.6 | 13.5 | 11.9 | 1.6 | -0.7 | -5.9 | 37.5 | 16.1 | -13.7 | -8.9 |
| Real fixed business investment | 2.5 | 7.7 | 7.2 | 3.1 | 6.3 | 3.6 | -1.9 | 4.1 | 16.0 | 11.2 | 6.4 |
| Real inventory accumulation | 58.2 | 37.6 | 57.1 | 63.6 | 70.6 | 78.5 | 12.7 | 62.0 | 106.6 | 91.1 | 72.1 |
| Real exports of goods and services | 11.9 | 6.9 | 3.3 | 3.1 | 3.2 | -0.7 | -7.7 | 11.4 | 13.0 | 7.5 | 3.0 |
| Real imports of goods and services | 12.7 | 5.5 | 2.3 | 1.1 | 4.0 | 4.1 | -4.5 | 12.4 | 16.6 | 5.3 | 2.9 |
| Real government consumption and investment | 0.1 | -3.0 | -1.5 | -2.0 | -0.2 | 0.4 | 0.4 | 0.5 | 0.6 | 0.7 | 0.8 |
| Real federal government consumption and investment | 4.3 | -2.7 | -1.8 | -5.7 | -1.9 | -0.1 | -0.2 | -0.4 | -0.3 | -0.1 | 0.6 |
| Real state and local government consumption and investment | -2.7 | -3.3 | -1.2 | 0.5 | 1.0 | 1.0 | 1.1 | 1.2 | 1.2 | 1.2 | 1.2 |
| Prices | |||||||||||
| Consumer price index | 1.6 | 3.1 | 2.1 | 1.5 | 1.6 | 0.2 | -0.2 | 0.6 | 2.1 | 1.1 | 0.4 |
| Chained price index for personal consumption expenditures | 1.7 | 2.5 | 1.8 | 1.2 | 1.3 | 0.3 | -0.5 | 0.3 | 1.9 | 0.9 | 0.2 |
| Chained GDP price index | 1.2 | 2.1 | 1.8 | 1.5 | 1.5 | 0.8 | 1.0 | 0.8 | 0.9 | 0.8 | 0.8 |
| Employment cost index | 1.9 | 2.0 | 1.9 | 1.9 | 2.1 | 2.4 | 0.6 | -0.2 | 3.8 | 4.4 | 2.7 |
| Labor markets | |||||||||||
| Average monthly change in employment | 65 | 165 | 184 | 205 | 245 | 168 | -77 | 270 | 295 | 143 | 128 |
| Unemployment rate (percent) | 9.6 | 8.9 | 8.1 | 7.4 | 6.2 | 5.5 | 7.2 | 7.2 | 5.7 | 4.9 | 4.7 |
| Employment-to-population (percent) | 58.5 | 58.4 | 58.6 | 58.6 | 59.0 | 59.5 | 58.8 | 59.0 | 60.0 | 60.3 | 60.4 |
| Income and wealth | |||||||||||
| Real disposable personal income | 1.0 | 2.5 | 3.0 | -0.2 | 2.5 | 3.1 | 2.3 | 2.3 | 3.0 | 3.5 | 3.2 |
| Net household wealth ($ trillions) | 62 | 64 | 70 | 79 | 83 | 52 | 83 | 99 | 117 | 122 | 123 |
| Personal saving rate (percent of disposable income) | 5.6 | 6.0 | 7.2 | 4.9 | 4.8 | 4.9 | 6.6 | 6.2 | 4.9 | 4.5 | 4.0 |
| After-tax corporate profits with corporate profits with inventory valuation and capital consumption adjustments | 25 | 4.0 | 11.4 | 4.2 | -0.8 | -5.6 | -11.8 | 15.2 | 6.2 | -2.5 | 0.4 |
| Housing | |||||||||||
| Housing starts (thousands) | 586 | 612 | 784 | 930 | 1,001 | 1,066 | 1,098 | 1,510 | 1,733 | 1,462 | 1,298 |
| Stock of owner-occupied homes (millions) | 132 | 132 | 132 | 133 | 133 | 134 | 135 | 136 | 137 | 138 | 139 |
| Interest rate on 30-year fixed-rate mortgages (percent) | 4.69 | 4.46 | 3.66 | 3.98 | 4.17 | 4.18 | 3.89 | 3.65 | 4.81 | 6.7 | 7.25 |
| Foreign trade | |||||||||||
| Current account balance, share of GDP (percent) | -3.0 | -3.0 | -2.9 | -2.4 | -2.4 | -2.7 | -2.4 | -2.4 | -3.1 | -2.7 | -2.7 |
| Merchandise trade balance ($ billions) | -691 | -784 | -791 | -752 | -722 | -805 | -719 | -717 | -1,023 | -1,107 | -1,149 |
| Relative unit labor costs (Index, 2008=100) | 93.6 | 87.1 | 84.2 | 80.9 | 80.9 | 84.7 | 86.4 | 84.5 | 84.5 | 82.1 | 78.9 |
| Financial | |||||||||||
| Federal funds rate (percent) | 0.13 | 0.13 | 0.13 | 0.13 | 0.1 | 0.13 | 0.17 | 1.34 | 3.04 | 3.5 | 3.5 |
| Yield on 10-year treasury note (percent) | 2.86 | 2.05 | 1.71 | 2.75 | 2.28 | 2.06 | 1.66 | 2.09 | 3.49 | 4.88 | 5.32 |
| Government | |||||||||||
| Federal budget balance, unified basis (share of GDP, percent) | -8.9 | -8.5 | -7.3 | -4.3 | -2.9 | -2.6 | -3.2 | -3.7 | -3.2 | -3.2 | -3.3 |
| Sources: Historical data: US government agencies and Oxford Economics. Forecast: Deloitte, using the Oxford Global Economic Model. | |||||||||||