


US Economic Forecast: Volume 3 Issue 3 has been saved

US Economic Forecast: Volume 3 Issue 3
23 September 2015
Many US pundits are too anxious about recent news pertaining to the European and Chinese economies. But economic conditions abroad would need to deteriorate significantly before they would compromise growth in the United States.

In many ways, the US economy remains on track after a slight scare of negative Q1 growth, which was revised to a slight positive. Job growth continues to average above 200,000 per month, retail sales and durable goods shipments continue to grow, and housing is beginning to accelerate. But, as John Donne wrote, “No man is an island.” That’s also true of economies—even island economies. The US economy is relatively sheltered from the storms of the global economy. Exports accounted for just 14 percent of GDP in 2014, which is substantially less than most developed countries. But continued weakness abroad may have an impact on the United States.
We’ve therefore raised the probability of slower-than-expected growth (our “continued slow growth” scenario). Global conditions have created a challenging environment for the US economy. That challenge is increasing as China’s economic problems have become more evident in the past few months. The US economy—while less connected to global conditions than many observers realize—would certainly feel the impact of a Chinese slowdown.
We haven’t changed our baseline outlook. The Deloitte forecast continues to show an acceleration of US GDP growth, but the baseline assumes that both Europe and China recover from their present stumbles.
The news from China indicates that this is becoming less likely. And Europe appears set to continue to lurch from crisis to crisis, hindering economic growth. Together, these two areas of the world could provide a significant source of drag for the US economy.
To be very clear, we believe there is almost no possibility that the Chinese slowdown—even if it is severe—could create a recession in the United States through trade flows. East Asia accounts for 20 percent of US exports. Even if exports to East Asia fell by half, US GDP would only fall about 0.7 percent. That’s enough to be felt, but not enough to create a recession. And the loss of East Asian sales would be offset by lower commodity prices, which US manufacturers would welcome. (US energy producers, less so.) This helps to limit the impact on the US economy. So, we believe, the probability of recession remains the same (5 percent) as does the cause—an unrealized weakness that brings down the US financial system. But the Chinese financial system is not well integrated into the global economy. If anything, the fact that US financial institutions have easily weathered the Chinese stock market crash suggests that the probability of a financial crisis remains low.
The baseline also assumes that the FY 2016 (and 2017, and 2018, and so on) budget is adopted smoothly, and that no problems arise in raising the US debt ceiling. These routine matters may become—once again—a source of uncertainty. Not likely to create a recession, but enough to inject yet more uncertainty into household and business decision making.
OIL PRICE FORECAST
The oil price forecast underlying our economic forecast is provided by Deloitte MarketPoint LLC (DMP). DMP uses a proprietary fundamental economic model of the global oil market that simultaneously simulates global market competition and supply-demand equilibrium across the crude and refined products supply chain.
DMP’s latest Spring 2015 Reference Case Forecast is now reflected in the Deloitte baseline US economic forecast. DMP expects the Brent price to rise gradually over the next few years until it reaches a new steady range of $75–85/bbl through 2025. This new equilibrium price is approximately $20/bbl lower than the steady state in previous forecasts, because it reflects two new circumstances in the marketplace:
- Prior to the “shale revolution,” there was a scarcity premium of roughly $10–20/bbl in place. With the newfound abundance of tight oil in the United States and potentially other areas around the globe, that scarcity premium has been nearly eliminated. This scarcity premium could quickly return if major changes to the market— tightened oil-production regulations or geopolitical issues, for example—create or threaten supply disruptions.
- Producers in US tight oil plays continue to improve their margins through technological innovation. While their margins will be lower in the new equilibrium-price environment, they should still be able to operate profitably.
For more information, please contact Deloitte Marketpoint (www.deloittemarketpoint.com).
Scenarios
There are plenty of reasons why actual economic growth might be better or worse than Deloitte’s forecasted baseline. The Deloitte forecast, therefore, includes four different scenarios to illustrate possible future paths of the US economy that are worth thinking about. Deloitte’s economic forecasting team places subjective probabilities on each of the four scenarios.
The baseline (55 percent): The most likely outcome for the economy is a burst of mildly faster growth as risks from abroad and at home fade away. Continued improvement in the labor market and growing demand from abroad increase demands on US producers, and the continued low cost of capital and low oil prices add to the pressure to build capacity. Growing business investment cements the recovery and, as hiring picks up, the labor force participation rate of younger cohorts will begin to rise. The large amount of slack will prevent rising demand from being translated into inflation, despite relatively accommodative Fed policy.
Recession (5 percent): China’s economy finally reflects financial problems that have been evident for several years. Volatility in Europe increases, and so does market valuation of the riskiness of euro assets, adding to the panic. This then affects several US financial institutions that find themselves long on euro and China-related assets at the wrong time. The result is a global financial panic. East Asian growth sputters while Europe plunges back into recession. Capital flows into the United States to avoid risk in Europe and Asia, and the US dollar appreciates. The combination of low foreign demand and financial panic throws the US economy into recession. Timely Fed action offsets the financial crisis after several months, but the impact of low demand, a troubled financial system, and the resulting hit to confidence keep the economy growing slowly. An eventual recovery leads to relatively fast growth several years from now.
Continued slow growth (25 percent): Weak economic conditions abroad, incomplete fixes to the financial system, and a mismatch between labor needs and the skills of the labor force slow US economic growth to 2 percent for the foreseeable future. As the long-term unemployed become essentially unemployable, the labor force participation rate remains low, and, wages start to rise. The hoped-for improvement in competitiveness from domestic energy production proves to be less impressive than expected. Incipient signs of inflation cause the Fed to raise interest rates to prevent inflation from getting out of hand.
Coordinated global boom (15 percent): European restructuring is successful, and Europe starts recovering quickly. Emerging markets also pick up momentum as financial problems are resolved in China, and India and Brazil start to adopt more reforms. Capital flows out of the United States and into Europe and the developing world, which causes the dollar to depreciate, further enhancing US exports. Lower energy prices in the United States make the country even more competitive. At home, the resolution of budget issues at both the federal and state levels allows more money to flow into infrastructure investment, creating short-term demand and long-term productivity growth. .
WHAT’S BEEN HAPPENING?
The US economy has been performing at what seems to have become its normal (slightly disappointing) pace. Good news, especially from the labor market, provides an early tease. Other data releases pile on, economists get excited (doesn’t take much), and then the data starts being disappointing again. For all that GDP growth has been lower than expected, the US economy is on an even keel for now. And—all other things being equal—the probability of a breakout in growth remains strong.
But all other things (other countries, in this case) are not equal. China’s GDP growth looks pretty good—if you can believe it. But the government’s reaction to the stock market crash suggested that policymakers are concerned and may not be sure about how to keep growth strong. The government’s attempts to support stock prices by proxy purchases of shares will remind historically minded readers of the doomed attempt by US titans of finance to stop the 1929 stock market crash. Richard Whitney, Vice President of the exchange, marched dramatically across the trading floor to purchase blocks of key stocks with the combined resources of the largest and most respected US banks. It didn’t work then, and it’s not likely to work now. (Even if the Chinese government has infinitely more resources than did the US bankers in 1929).
The currency devaluation that followed the stock market intervention can likely be explained by Chinese officials’ concerns about an economic slowdown. We believe the devaluation itself was a reasonable move. China’s foreign exchange reserves have been shrinking over the past few years, an indication that the yuan is no longer undervalued. Indeed, the International Monetary Fund declared this to be the case earlier in the year. So letting the currency fall in a controlled way to help keep Chinese exporters price competitive was an understandable move by the Chinese authorities. But, as with the stock market, Chinese authorities found themselves struggling to maintain control. Once the currency’s decline became clear, investors started selling yuan at unexpectedly fast rates. These are worrying signs. Worrying because they indicate that China’s economy may really be slowing by more than the official statistics indicate, and worrying because Chinese policymakers—experts at managing to find ways to stabilize their complex economy—may be running out of answers.
Add to this the European approach to Greece. The “resolution” of the Greek crisis appears to have left the key problem on the table. Greece simply cannot pay off its current level of debt (around 175 percent of GDP). The most recent agreement did not address this fundamental proble. That’s the opinion of no less an authority than the IMF, which initially refused to join in the rejuggling of Greek obligations. The IMF has made clear that it does not see a permanent solution to Greece without its creditors (mainly EU governments) taking a large “haircut”. This is a view echoed by many economists outside the ECB/EU orbit. And the spread between German yields, on the one hand, and Italian and Spanish yields, on the other, continues to be high. All of this suggests that European growth is likely to remain sluggish, as investors will hold back given the uncertainty surrounding the euro.
On top of foreign weakness, the United States faces more budget uncertainty. Congress successfully passed the nonbinding budget resolution for FY 2016, although the targets required appropriations bills that the President has said he would veto. The appropriations bills themselves have stalled. The first reason for this is likely that it was easy for Congress to pass the general limits, but much, much harder to find the specific savings necessary to hit those targets. But it’s also because the appropriations bills have likely become the target for non-budgetary issues. Congressional leadership faces an unenviable task. At present, the Majority leaders in both Houses are committed to passing spending authority without any minority support. But the majority is by no means sufficiently unified to pass spending bills that the President will sign. The thin margins in both Houses mean that a relatively small number of Tea Party affiliated Senators or Representatives can disrupt the proceedings, as has happened in the past. Several such Senators are declared candidates for President, with electoral incentives to take positions that complicate the already difficult budget process.
On top of this, the US has once again hit the budget ceiling. Although the Treasury’s usual measures are buying time, at some point (probably in late fall) Congress will have to act. And the same dynamics—the leaders’ desire to keep their majority unified, the thin margins, the Tea Party influence, and the Presidential campaign—may play out on the debt ceiling as well.
Memories of the last shutdown—and the political damage it caused—make the prospect of a further shutdown unlikely. But it’s not by any means impossible. And even if a shutdown doesn’t occur, September may bring considerable uncertainty about the budget.
SECTORS
Consumers
Ah, the US consumer—long-time supporter of the global economy, and still surprisingly resilient. Of course, consumers can’t spend money they don’t have, and their incomes largely depend on having jobs. Job growth has picked up. But US consumers have started sending a message to the rest of the world. They cannot continue to play Atlas, holding the global economy on their shoulders as they did in the 2000s. Our forecast expects the US savings rate to settle in at about 4.5 percent. That is lower than the current level but a good bit higher than in the previous decade, and consistent with consumers’ behavior in the 1990s.
US households face some obstacles in their pursuit of the good life. Aside from the need to recover from the debt they took on in the 2000s, and continuing low wage growth, there is the problem of growing income and wealth inequality. Thomas Pikkety’s book on inequality created a surprising stir for a 600+ page tome on economics, replete with charts and data. For a brief summary of some of the problems raised in the book, see the Deloitte Review article “Mind the gap” by Ira Kalish.1 The great interest in the topic suggests that US economic policy debates are likely to focus more on inequality than they did in the past.
Many US consumers spent the 1990s and the 2000s trying to keep up their spending when incomes were stagnant. After all, they kept being assured that technology was transforming the US economy and should be transforming their lives. But now they are wiser (and older, which is another problem as retirements loom without sufficient savings). As long as a large share of the gains from technology and other economic improvements flow to a relatively small number of households, overall US consumer spending is likely to remain relatively restrained.
Consumer news
Real consumer expenditures were up a healthy 0.75 percent over the three months ending July. The savings rate has fallen from the above 5 percent rates recorded during the winter, and averaged 4.7 percent in May–July. That’s an indication that consumers finally started to spend the savings from lower gasoline prices earlier in the year.
Retail sales rose 0.6 percent in July after a flat June and a fast (1.2 percent) growth in May. Autos were the source of the volatility. Less autos, retail sales were up over 0.3 percent in June and July, which suggests some strength in the sector.
Consumer confidence has remained high but flat over the past few months. Both the Conference Board and University of Michigan measures are registering very satisfactory levels in the low 90s.

Housing
It happens every year. Young people become old enough to leave home and start their own households. But it stopped happening during the recession. The number of households didn’t grow nearly enough to account for all the newly minted young adults. We expect those young adults would prefer to live on their own and create new households; as the economy recovers, they will do exactly that.
This means some positive fundamentals for housing construction in the short run. The United States hasn’t been building as many new housing units as the population would normally require for about seven years, since 2008. In fact, housing construction was hit so hard that the oversupply turned into an undersupply, so there’s a hole that needs to be filled. But the hole isn’t as large as you might think. Several factors offset each other:
- If household size returns to the levels we experienced in the mid-2000s, we would need an additional 3.2 million units.
- On the other hand, household vacancy rates are much higher than normal. If household vacancy returned to normal, an additional 2.5 million units would be available—which would fill 78 percent of the pent-up demand for housing units.
- But are the existing vacant houses in the right place or condition, or are they the right type, for that pent-up demand? The future of housing may look very different than in the past. Growth in new housing construction has been concentrated in multifamily units. If that continues, we may find it is related to the fact that existing single-family units are not needed, despite strong demand for apartments.
We developed our housing forecast based on these factors. We assumed that the demand for housing (in the form of a falling size of the average household) picks up in 2016, vacancy rates gradually drop, and household depreciation starts falling after about 2.5 million housing units are removed from the housing stock. Despite these relatively robust assumptions, slowing population growth suggests that we will have a short-lived housing boom in which starts hit the 1.5–1.6 million level, followed by a period of contraction until starts reach the level of long-run demand. We estimate this to be just 1.2 million units in the medium term. Housing will likely contribute to growth in 2016 but subtract from growth by 2018 as the pent-up demand goes away. In the long run, the slowing population suggests that housing will not be a growth sector (although specific segments, such as old-age housing, might well be very strong).
Housing credit remains tight and may be a key culprit in keeping individual purchases of single-family houses low. Young adults also seem to be showing a preference for living in urban rather than suburban communities. There may be some significant changes from the post–World War II model of single-family home ownership in store.
Housing news
Housing permits dropped substantially in July after rising in the previous three months. The volatility may be the result of the increasing share of multifamily units. Single family permits moved in much more narrow range. Starts hit 1.2 million units in June and July, the first time since 2007 the sector saw that many starts.
Contract interest rates for conventional mortgages have dropped 10-20 basis points since the last of the year—most likely because financial uncertainty abroad is attracting investors to the US and pushing down yields on US securities. House prices are accelerating. The Case-Shiller house price index was up more than 1 percent in April and May and is running 4.4 percent above last year’s level.

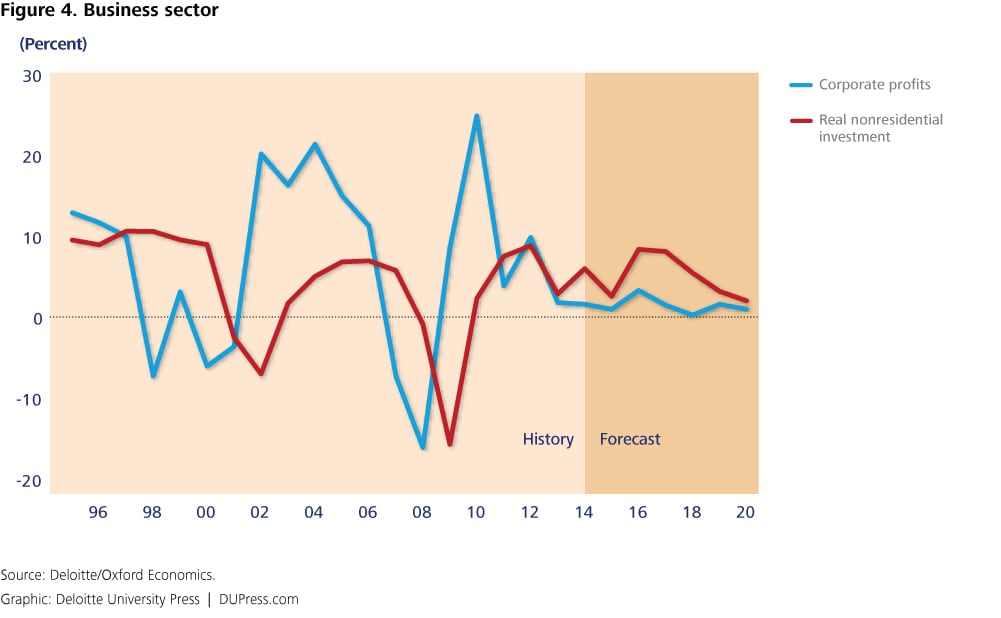
Business investment
There has been a lot of sad talk about the impact of political uncertainty on business decisions since the end of the recession. In fact, relative to GDP, business investment was one of the better-performing sectors in this recovery. With strong profit growth, however, businesses might have been expected to invest even more. The reasons for this are complex.2 Many businesses are likely still waiting for assurance that they will have customers. Once those customers return, there may be more reason to ramp up investment. Watch what businesses do, not what they say.
That isn’t to say that there are now some factors weighing down on investment. The rising dollar is not only making US companies less competitive, it’s cutting earnings valued in dollars and therefore reducing margins for US multinationals. And China's slowing is exposing global excess capacity in many industries. In our baseline scenario, these factors fall away as global growth picks up. In the “Continued Slow Growth” scenario, they become important factors in keeping the US economy growing at current, unsatisfactory rates.
The fall in oil prices is a complicating factor in this positive outlook. Oil and gas extraction accounted for 6 percent of all nonresidential fixed investment in 2013. That’s a hefty amount (considerably larger than the value-added share of the sector). So there is certainly an immediate impact on investment from the shutting down of new oil exploration in the US. However, it seems unlikely that the big drop in the price of oil won’t eventually affect the 94 percent of business investment which is not related to oil and gas extraction.
Business investment news
Business fixed investment fell in the second quarter after rising only a little in the first quarter. Nonresidential structures fell 1.6 percent after falling over 7 percent in the first quarter, largely because of a decline in investment in oil and gas drilling. Equipment investment fell 4.15 percent, and intellectual property investment rose 5.5 percent, a slower pace than the previous few quarters.
Nondefense capital goods shipments—the best high-frequency measure of equipment spending—are still below the January peak. Shipments were up in four of the five months ending in July.
Private nonresidential construction fell in June by 1.3 percent after rising at 2 percent to 4 percent rates in the previous three months. Most types of construction followed this pattern.
Interest rates remained stable. August saw a substantial stock market correction, as US stock prices reacted to the stock market crash in China. The cost of capital remains quite low, however, and profits are still at near-record levels of national income.
Foreign trade
The United States has long had a voracious appetite for foreign goods, and that’s likely not going to stop. In the baseline forecast, imports accelerate along with GDP growth.
However, exports look to prove a pleasant surprise. Not in the near term, as the dollar is up quite a bit recently—over 15 percent in the past year. That’s a consequence of the continued desire of investors around the world to hold safe US assets. But the dollar rise also contributes to the possibility of US export growth in the future. Once foreign risks recede, capital will flow out of the United States, and the dollar will fall. The possibility of a depreciating dollar is welcome because it could help improve US competitiveness and put capital where it does the most good globally in the long run.
A variety of improvements, ranging from the United States’ lead in technology to cheap natural gas, will likely help make US manufacturing more competitive with foreign goods.
This forecast assumes that both China and Europe overcome their financial problems and begin to grow again. Growth in these areas represents opportunity for US firms, which we think the firms are ready to take advantage of.
Foreign trade news
US goods exports rose in July after falling in May and June. Imports dropped in July after rising in June. Goods imports fell $2.7 billion, despite a substantial rise in petroleum imports in July. Weak demand abroad and the rising dollar are taking their toll on US trade.
The trade-weighted dollar rose at an average rate of over 1 percent in June and July. The Canadian dollar is now at C$1.29 per US$, the highest level in about 10 years. The euro appears to have stabilized at about $1.10 after the most recent Greek agreement, but this is quite low. The yen has depreciated to about ¥123 to the dollar, boosting Japanese exports. And, Chinese authorities decided to let the Renminbi depreciated as well.
European industrial production slowed in three of the four months ending in July. The protracted negotiations over Greek debt, and the period of uncertainly following until the Greek and German parliaments ratified the agreement, increased uncertainty in Europe. That increased uncertainty is likely weighing on economic activity in Europe.
By late August, Chinese stocks were down over 40 percent from their peak in June. The yuan was down 3 percent, but the Chinese authorities were struggling to prevent a further depreciation—despite the fact that efforts to prevent the stock market crash from intensifying did not work. China’s second quarter GDP showed an acceleration to above 7 percent, but the authorities’ interventions in both markets suggest that there may be other signs of a slowing economy in China.

Government
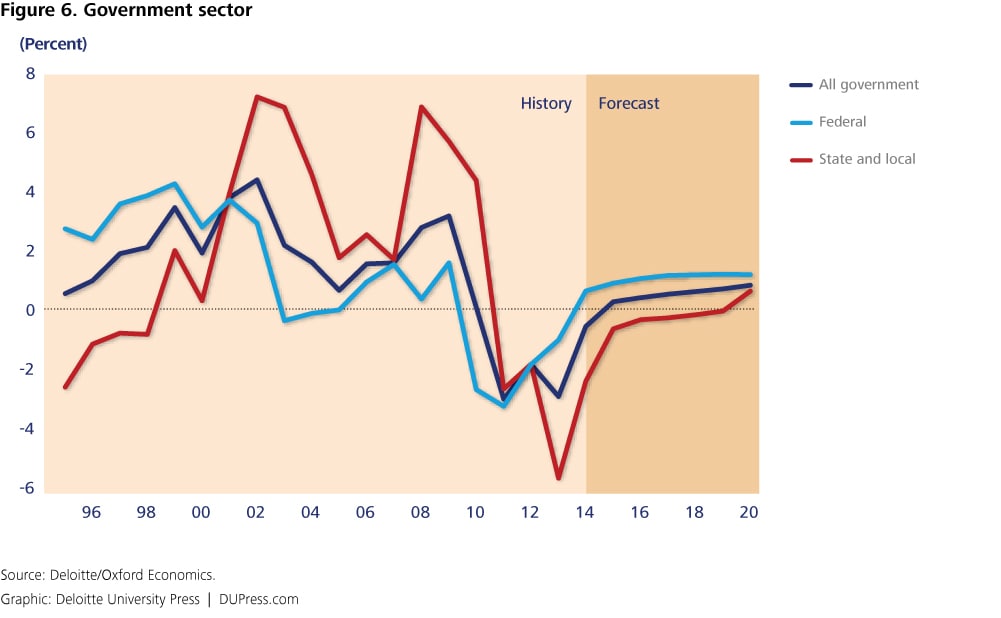
Government spending on goods and services has been stagnant, and we don’t expect much change in the next few years. That’s actually an improvement from the 2010–2013 period, when government spending provided a large drag on economic growth.
At the federal level, it is hard to see Congress and the president agreeing on significant new spending. And there is a risk that spending will fall even further. That might be good for longer-term federal finances, but would likely put additional pressure on near-term economic growth.
State and local governments are no longer cutting spending. They are getting some good revenue news from rising house prices and growing employment. But those pesky pension liabilities continue to restrain state and local spending. The Congressional Budget Office estimates that there is a shortfall of $2–3 trillion in state and local pension funding. The need to fund these liabilities is likely to keep the lid on state and local spending growth.
Government news
The federal deficit was about $5 billion higher than the previous year for the first ten months of the fiscal year. According to Congressional Budget Office (CBO), this is because certain payments were made early (in July) because they were scheduled to be made on a weekend (in August). The CBO estimates that the deficit would have declined by $41 billion in the first 10 months of the fiscal had these payments been made normally. Receipts were up 8 percent while outlays were up only 5 percent in the first 10 months of the fiscal year.
Labor markets
If the US economy is going to produce more goods and services, it will need more workers. As long as the labor market is out of balance, the currently moderate wage growth will likely eventually encourage firms to increase capacity by hiring workers. However, employment growth is more likely to occur in industries such as health care and recreation services than in manufacturing. Accelerating production will carry with it an eventual acceleration in employment—and even a welcome mild acceleration in wages.
But a great many people have been out of work for a long time—long enough that their basic work skills may be eroding. When the labor market tightens up, will those people be employable? As labor markets begin to tighten, the long-term damage of the 2007–2009 recession will become measurable.
One unusual feature of the current recovery is the decline in the number of government workers. Government jobs were once thought of as recession-proof, but that’s not the case anymore. There isn’t a lot of desire for increased government spending. As a result, government employment is likely to grow slowly at best in the next few years, which may constrain job growth.
LABOR FORCE PROJECTIONS
The overall labor force participation rate will be affected by two offsetting trends in the near term. The aging of the population—and in particular, the entrance of early Baby Boom cohorts into retirement age in the next five years—will push the participation rate down. However, participation rates for younger cohorts have fallen substantially because of the poor labor market. The economic improvement in the forecast will almost certainly entice many people in these middle-aged and, especially, younger cohorts to return to the labor market.
The labor force projection in this forecast assumes the following:
- Labor force participation rates for over-60s will remain at current levels.
- Labor force participation rates for under-30s will return to their 1997–2000 average.
- Labor force participation rates for 30–60-year-oldse 2002–2007 average.
Labor market news
Initial claims for unemployment insurance have holding steady in the 270,000 range. Job openings continue to grow, and at 5.2 million in June are considerably above the peak of around 4.4 million in 2006. Quits (voluntary separations) have stalled at about 2.7 million this year, which is below the peak of 3.0 million in 2007.
Payroll employment grew at an average rate of 216,000 in the three months ending July. Employment has growth by more than 200,000 in every month but one since May 2014. The unemployment rate continued falling slowly to 5.4 percent in July. Unfortunately, the participation rate is stuck in the 62.7 percent to 62.9 percent range, which suggests that a substantial number of people are still unwilling to enter the labor market.

Financial markets
Interest rates are among the most difficult economic variables to forecast because movements depend on news. And if we knew it, it wouldn’t be news. The Deloitte interest-rate forecast is designed to show a path for interest rates consistent with the forecast for the real economy. But the potential risk for different interest-rate movements is higher here than in other parts of our forecast.
The forecast sees both long- and short-term interest rates headed up—maybe not this week, and maybe not this month, but sometime in the future. The forecast shows the economy accelerating this year, and a healthy economy will mean that lending will once again become costly. The forecast moves interest rates back to “normal” levels as economic growth accelerates. That’s not a bad thing—unless returning to normal is bad.
Of course, some investors may be caught short. Those are the people who think that interest rates will remain low forever. Some of those will even be so-called sophisticated investors, so plenty of worried headlines will appear when interest rates go up. Don’t be fooled by what is just a (yes) welcome return to normal.
But the most sophisticated observers of financial markets know the most important thing about interest rates—they will fluctuate. This is the sector that is most likely to surprise us.
This forecast expects the Fed to start raising the funds rate at the Federal Open Market Committee (FOMC) meeting scheduled for December, 2015. This is later than the current consensus, but we believe it reflects the careful approach that most members of the FOMC have been taking to signs of economic growth. With little inflationary pressures and turmoil in financial markets. The Fed can afford to wait. The baseline forecast then assumes that the Fed will skip the January meeting, then continue to raise the rate by 25 basis points at each meeting until the funds rate reaches 3.75 percent. This corresponds to the current views of the FOMC, as all but four participants currently see the appropriate target for the funds rate in the longer run as either 3.5 percent or 3.75 percent.
Financial market news
The Fed kept the funds rate target at between 0 percent and 0.25 percent. FOMC minutes and speeches suggest that Fed officials are looking for reasons to raise rates sooner rather than later. Longer term rates remained low, with an average 10-year Treasury yield falling 2.0 percent in August as investors looked for places other than stock markets to park their money. Risk spreads have been rising: the Baa minus Aaa spread was 105 basis points in July, up from 90 basis points in March.
Stock prices took a deep dive in August. The S&P 500 index fell 11 percent between August 17 and August 25, although it regained about one-third of the loss by early September.

Prices
Remember those folks who were convinced that the Fed’s actions in 2009 would create runaway inflation? Likely they rather you didn’t. Prices have been the most boring part of forecasting for the past six years, and there is no reason to think that’s going to change.
Inflation is hard to come by when the labor market—which accounts for two-thirds of all costs in the US economy—has been so slack. Workers haven’t had leverage to obtain higher wages when prices go up, and businesses don’t have the pricing power to cover higher costs. Instead, shocks from higher energy or food prices have just dissipated into the ether rather than being translated into sustained, higher inflation.
That means that inflation will likely remain tame at least until the economy reaches full employment. Although employment growth in the past couple of years has whittled away at the potential employment surplus, it’s still pretty large, and bigger than the unemployment rate indicates. So don’t hold your breath waiting for the return of the 1970s. Bell bottoms, disco, and high inflation are likely all safely in our past (for now).
Price news
Gasoline prices pushed up the CP in May and June, but core CPI remained low. The core CPI is up just 0.2 percentage points over the past year.
The final demand producer price index (PPI) has fallen every month in 2015—as good an example as any of the lack of inflation.
Real hourly earnings rose 1.9 percent in July, a rate similar to that over the past half year. Compensation for private industry workers was up 1.9 percent in Q2, a decline from the apparent acceleration in Q1. There are few differences among broad occupational groups. Compensation is rising modestly for most occupations.

APPENDIX: DELOITTE ECONOMIC FORECAST
Table 1. Deloitte US forecast: Baseline
Percent change, year over year unless otherwise noted.
| History | Forecast | ||||||||||
| 2010 | 2011 | 2012 | 2013 | 2014 | 2015 | 2016 | 2017 | 2018 | 2019 | 2020 | |
| GDP and components | |||||||||||
| Real GDP | 2.5 | 1.6 | 2.2 | 1.5 | 2.4 | 2.3 | 3.4 | 3.1 | 2.6 | 2.0 | 1.9 |
| Real consumer spending | 1.9 | 2.3 | 1.5 | 1.7 | 2.7 | 3.0 | 3.4 | 2.7 | 2.6 | 2.3 | 2.0 |
| Real consumer spending, durable goods | 6.1 | 6.1 | 7.4 | 5.8 | 5.9 | 5.5 | 5.8 | 4.4 | 4.1 | 3.0 | 2.3 |
| Real consumer spending, nondurable goods | 2.2 | 1.8 | 0.6 | 1.9 | 2.1 | 2.5 | 2.7 | 2.0 | 2.1 | 2.1 | 1.9 |
| Real consumer spending, services | 1.2 | 1.8 | 0.8 | 1.0 | 2.4 | 2.8 | 3.2 | 2.7 | 2.4 | 2.2 | 2.0 |
| Real investment in private housing | -2.5 | 0.6 | 13.5 | 9.5 | 1.8 | 8.8 | 16.0 | 12.3 | -0.4 | -12.2 | -7.7 |
| Real fixed business investment | 2.5 | 7.7 | 9.0 | 3.0 | 6.2 | 2.7 | 8.5 | 8.3 | 5.6 | 3.3 | 2.2 |
| Real inventory accumulation | 58.0 | 38.0 | 55.0 | 61.0 | 68.0 | 105.0 | 80.0 | 56.0 | 43.0 | 33.0 | 29.0 |
| Real exports of goods and services | 11.9 | 6.9 | 3.4 | 2.8 | 3.4 | 1.7 | 4.3 | 4.9 | 4.9 | 5.0 | 4.9 |
| Real imports of goods and services | 12.7 | 5.5 | 2.2 | 1.1 | 3.8 | 5.6 | 6.4 | 5.6 | 3.8 | 2.0 | 2.3 |
| Real government consumption and investment | 0.1 | -3.0 | -1.9 | -3.0 | -0.6 | 0.3 | 0.4 | 0.5 | 0.6 | 0.7 | 0.8 |
| Real Federal government consumption and investment | 4.3 | -2.7 | -1.9 | -5.7 | -2.4 | -0.7 | -0.4 | -0.3 | -0.2 | -0.1 | 0.6 |
| Real state and local government consumption and investment | -2.7 | -3.3 | -1.9 | -1.0 | 0.6 | 0.9 | 1.0 | 1.1 | 1.2 | 1.2 | 1.2 |
| Prices | |||||||||||
| Consumer price index | 1.6 | 3.1 | 2.1 | 1.5 | 1.6 | 0.6 | 2.5 | 2.1 | 2.2 | 2.1 | 2.1 |
| Chained price index for personal consumption expenditures | 1.7 | 2.5 | 1.9 | 1.4 | 1.4 | 0.8 | 2.3 | 1.9 | 1.9 | 1.9 | 1.9 |
| Chained GDP price index | 1.2 | 2.1 | 1.8 | 1.6 | 1.6 | 1.2 | 1.9 | 1.9 | 2.1 | 2.1 | 1.9 |
| Employment cost index | 1.9 | 2.0 | 1.9 | 1.9 | 2.1 | 2.1 | 3.7 | 3.7 | 3.1 | 3.1 | 3.2 |
| Labor markets | |||||||||||
| Average monthly change in employment | 65 | 165 | 184 | 205 | 245 | 221 | 196 | 148 | 126 | 51 | 62 |
| Unemployment rate (percent) | 9.6 | 8.9 | 8.1 | 7.4 | 6.2 | 5.4 | 4.9 | 5 | 5.3 | 5.4 | 5.4 |
| Employment to population (percent) | 58.5 | 58.4 | 58.6 | 58.6 | 59 | 59.5 | 60.1 | 60.4 | 60.5 | 60.2 | 59.9 |
| Income and wealth | |||||||||||
| Real disposable personal income | 1.0 | 2.5 | 3.2 | -1.4 | 2.7 | 3.0 | 2.6 | 3.0 | 2.8 | 2.0 | 1.8 |
| Net household wealth ($ trillions) | 62 | 64 | 70 | 79 | 83 | 92 | 101 | 106 | 111 | 113 | 117 |
| Personal saving rate (percent of disposable income) | 5.6 | 6.0 | 7.6 | 4.8 | 4.8 | 4.7 | 4.0 | 4.3 | 4.7 | 4.4 | 4.3 |
| After tax corporate profits with corporate profits with inventory valuation and capital consumption adjustments | 25.0 | 4.0 | 10.0 | 2.0 | 1.7 | 1.1 | 3.5 | 1.6 | 0.4 | 1.8 | 1.1 |
| Housing | |||||||||||
| Housing starts (thousands) | 586 | 612 | 784 | 928 | 1,001 | 1,130 | 1,417 | 1,629 | 1,609 | 1,382 | 1,243 |
| Stock of owner occupied homes (millions) | 132 | 132 | 133 | 133 | 134 | 135 | 136 | 137 | 138 | 139 | 140 |
| Interest rate on 30 year fixed rate mortgages (percent) | 4.69 | 4.46 | 3.66 | 3.98 | 4.17 | 3.9 | 4.35 | 5.94 | 6.97 | 7.3 | 7.68 |
| Foreign trade | |||||||||||
| Current account balance, share of GDP (percent) | -3 | -3 | -2.8 | -2.3 | -2.2 | -2.5 | -2.6 | -2.6 | -2.7 | -2.5 | -2.3 |
| Merchandise trade balance ($ billions) | -691 | -784 | -791 | -752 | -722 | -777 | -889 | -939 | -962 | -940 | -937 |
| Relative unit labor costs (Index, 2008=100) | 94 | 87.3 | 84.5 | 81.3 | 81.5 | 85.8 | 87.5 | 85.1 | 82.7 | 80.5 | 78.5 |
| Financial | |||||||||||
| Federal funds rate (percent) | 0.13 | 0.13 | 0.13 | 0.13 | 0.1 | 0.21 | 1.98 | 3.75 | 3.75 | 3.75 | 3.75 |
| Yield on 10-year treasury note (percent) | 2.86 | 2.05 | 1.71 | 2.75 | 2.28 | 2.33 | 2.46 | 3.91 | 4.6 | 5.2 | 5.64 |
| Government | |||||||||||
| Federal budget balance, unified basis (share of GDP, percent) | -8.9 | -8.5 | -7.3 | -4.3 | -2.9 | -2.5 | -2.4 | -2.4 | -2.7 | -3.2 | -3.6 |
Sources: Historical data: US government agencies and Oxford Economics. Forecast: Deloitte, using the Oxford Global Economic Model.
Table 2. Coordinated global recovery
Percent change, year over year unless otherwise noted.
| History | Forecast | ||||||||||
| 2010 | 2011 | 2012 | 2013 | 2014 | 2015 | 2016 | 2017 | 2018 | 2019 | 2020 | |
| GDP and components | |||||||||||
| Real GDP | 2.5 | 1.6 | 2.2 | 1.5 | 2.4 | 2.3 | 3.9 | 3.6 | 2.4 | 2.2 | 2.2 |
| Real consumer spending | 1.9 | 2.3 | 1.5 | 1.7 | 2.7 | 3.0 | 3.6 | 3.2 | 2.9 | 2.0 | 1.6 |
| Real consumer spending, durable goods | 6.1 | 6.1 | 7.4 | 5.8 | 5.9 | 5.5 | 5.9 | 4.8 | 4.3 | 3.1 | 2.3 |
| Real consumer spending, nondurable goods | 2.2 | 1.8 | 0.6 | 1.9 | 2.1 | 2.5 | 2.9 | 2.5 | 2.5 | 1.7 | 1.4 |
| Real consumer spending, services | 1.2 | 1.8 | 0.8 | 1.0 | 2.4 | 2.8 | 3.4 | 3.2 | 2.8 | 1.9 | 1.6 |
| Real investment in private housing | -2.5 | 0.6 | 13.5 | 9.5 | 1.8 | 8.8 | 16.1 | 13.1 | -0.4 | -12.1 | -8.2 |
| Real fixed business investment | 2.5 | 7.7 | 9.0 | 3.0 | 6.2 | 3.3 | 14.5 | 10.8 | 6.3 | 6.5 | 6.1 |
| Real inventory accumulation | 58.0 | 38.0 | 55.0 | 61.0 | 68.0 | 105.0 | 89.0 | 71.0 | 43.0 | 36.0 | 35.0 |
| Real exports of goods and services | 11.9 | 6.9 | 3.4 | 2.8 | 3.4 | 1.7 | 4.4 | 5.0 | 5.3 | 5.4 | 5.2 |
| Real imports of goods and services | 12.7 | 5.5 | 2.2 | 1.1 | 3.8 | 5.8 | 9.1 | 7.3 | 6.8 | 3.1 | 2.9 |
| Real government consumption and investment | 0.1 | -3.0 | -1.9 | -3.0 | -0.6 | 0.3 | 0.4 | 0.5 | 0.6 | 0.7 | 0.8 |
| Real Federal government consumption and investment | 4.3 | -2.7 | -1.9 | -5.7 | -2.4 | -0.7 | -0.4 | -0.3 | -0.2 | -0.1 | 0.6 |
| Real state and local government consumption and investment | -2.7 | -3.3 | -1.9 | -1.0 | 0.6 | 0.9 | 1.0 | 1.1 | 1.2 | 1.2 | 1.2 |
| Prices | |||||||||||
| Consumer price index | 1.6 | 3.1 | 2.1 | 1.5 | 1.6 | 0.6 | 2.3 | 2.1 | 2.0 | 1.7 | 2.2 |
| Chained price index for personal consumption expenditures | 1.7 | 2.5 | 1.9 | 1.4 | 1.4 | 0.8 | 2.2 | 1.8 | 1.8 | 1.5 | 2.0 |
| Chained GDP price index | 1.2 | 2.1 | 1.8 | 1.6 | 1.6 | 1.3 | 1.7 | 1.9 | 1.9 | 1.8 | 2.0 |
| Employment cost index | 1.9 | 2.0 | 1.9 | 1.9 | 2.1 | 2.1 | 3.7 | 4.0 | 3.1 | 2.6 | 2.8 |
| Labor markets | |||||||||||
| Average monthly change in employment | 65 | 165 | 184 | 205 | 245 | 235 | 218 | 168 | 134 | 102 | 66 |
| Unemployment rate (percent) | 9.6 | 8.9 | 8.1 | 7.4 | 6.2 | 5.4 | 4.6 | 4.6 | 4.9 | 4.7 | 4.6 |
| Employment to population (percent) | 58.5 | 58.4 | 58.6 | 58.6 | 59 | 59.5 | 60.3 | 60.6 | 60.8 | 60.7 | 60.5 |
| Income and wealth | |||||||||||
| Real disposable personal income | 1.0 | 2.5 | 3.2 | -1.4 | 2.7 | 3.0 | 2.8 | 3.3 | 2.9 | 2.0 | 1.4 |
| Net household wealth ($ trillions) | 62 | 64 | 70 | 79 | 83 | 92 | 101 | 107 | 113 | 115 | 120 |
| Personal saving rate (percent of disposable income) | 5.6 | 6.0 | 7.6 | 4.8 | 4.8 | 4.7 | 4.0 | 4.2 | 4.3 | 4.4 | 4.2 |
| After tax corporate profits with corporate profits with inventory valuation and capital consumption adjustments | 25.0 | 4.0 | 10.0 | 2.0 | 1.7 | 1.4 | 4.2 | 2.2 | 0.7 | 2.7 | 2.8 |
| Housing | |||||||||||
| Housing starts (thousands) | 586 | 612 | 784 | 928 | 1,001 | 1,130 | 1,418 | 1,641 | 1,623 | 1,395 | 1,248 |
| Stock of owner occupied homes (millions) | 132 | 132 | 133 | 133 | 134 | 135 | 136 | 137 | 138 | 139 | 140 |
| Interest rate on 30 year fixed rate mortgages (percent) | 4.69 | 4.46 | 3.66 | 3.98 | 4.17 | 3.9 | 4.39 | 5.94 | 6.93 | 7.26 | 7.63 |
| Foreign trade | |||||||||||
| Current account balance, share of GDP (percent) | -3 | -3 | -2.8 | -2.3 | -2.2 | -2.5 | -3 | -3.4 | -3.9 | -3.9 | -3.9 |
| Merchandise trade balance ($ billions) | -691 | -784 | -791 | -752 | -722 | -780 | -965 | -1,074 | -1,198 | -1,203 | -1,224 |
| Relative unit labor costs (Index, 2008=100) | 94 | 87.3 | 84.5 | 81.3 | 81.5 | 85.8 | 87.3 | 85 | 82.7 | 80.1 | 77.8 |
| Financial | |||||||||||
| Federal funds rate (percent) | 0.13 | 0.13 | 0.13 | 0.13 | 0.1 | 0.21 | 2 | 3.75 | 3.75 | 3.75 | 3.75 |
| Yield on 10-year treasury note (percent) | 2.86 | 2.05 | 1.71 | 2.75 | 2.28 | 2.33 | 2.46 | 3.9 | 4.58 | 5.16 | 5.59 |
| Government | |||||||||||
| Federal budget balance, unified basis (share of GDP, percent) | -8.9 | -8.5 | -7.3 | -4.3 | -2.9 | -2.5 | -2.3 | -2.1 | -2.4 | -2.8 | -3.1 |
Sources: Historical data: US government agencies and Oxford Economics. Forecast: Deloitte, using the Oxford Global Economic Model.
Table 3. Continued slow growth
Percent change, year over year unless otherwise noted.
| History | Forecast | ||||||||||
| 2010 | 2011 | 2012 | 2013 | 2014 | 2015 | 2016 | 2017 | 2018 | 2019 | 2020 | |
| GDP and components | |||||||||||
| Real GDP | 2.5 | 1.6 | 2.2 | 1.5 | 2.4 | 2.3 | 2.2 | -0.7 | 3.3 | 3.8 | 2.1 |
| Real consumer spending | 1.9 | 2.3 | 1.5 | 1.7 | 2.7 | 3.0 | 2.9 | 0.3 | 2.8 | 3.2 | 2.0 |
| Real consumer spending, durable goods | 6.1 | 6.1 | 7.4 | 5.8 | 5.9 | 5.5 | 5.4 | 2.5 | 4.3 | 3.3 | 2.6 |
| Real consumer spending, nondurable goods | 2.2 | 1.8 | 0.6 | 1.9 | 2.1 | 2.5 | 2.2 | -0.5 | 2.3 | 3.1 | 1.8 |
| Real consumer spending, services | 1.2 | 1.8 | 0.8 | 1.0 | 2.4 | 2.8 | 2.7 | 0.3 | 2.7 | 3.2 | 2.0 |
| Real investment in private housing | -2.5 | 0.6 | 13.5 | 9.5 | 1.8 | 8.9 | 3.5 | -0.2 | 18.2 | -2.7 | -9.2 |
| Real fixed business investment | 2.5 | 7.7 | 9.0 | 3.0 | 6.2 | 2.7 | 7.1 | -2.5 | 6.6 | 10.4 | 6.5 |
| Real inventory accumulation | 58.0 | 38.0 | 55.0 | 61.0 | 68.0 | 105.0 | 68.0 | -28.0 | 30.0 | 64.0 | 43.0 |
| Real exports of goods and services | 11.9 | 6.9 | 3.4 | 2.8 | 3.4 | 1.7 | -1.2 | -5.7 | 13.3 | 11.6 | 5.3 |
| Real imports of goods and services | 12.7 | 5.5 | 2.2 | 1.1 | 3.8 | 5.6 | 3.2 | -3.4 | 14.8 | 9.2 | 3.6 |
| Real government consumption and investment | 0.1 | -3.0 | -1.9 | -3.0 | -0.6 | 0.3 | 0.4 | 0.5 | 0.6 | 0.7 | 0.8 |
| Real Federal government consumption and investment | 4.3 | -2.7 | -1.9 | -5.7 | -2.4 | -0.7 | -0.4 | -0.3 | -0.2 | -0.1 | 0.6 |
| Real state and local government consumption and investment | -2.7 | -3.3 | -1.9 | -1.0 | 0.6 | 0.9 | 1.0 | 1.1 | 1.2 | 1.2 | 1.2 |
| Prices | |||||||||||
| Consumer price index | 1.6 | 3.1 | 2.1 | 1.5 | 1.6 | 0.6 | 1.7 | 0.3 | 2.3 | 2.4 | 1.0 |
| Chained price index for personal consumption expenditures | 1.7 | 2.5 | 1.9 | 1.4 | 1.4 | 0.8 | 1.6 | 0.0 | 2.0 | 2.2 | 0.8 |
| Chained GDP price index | 1.2 | 2.1 | 1.8 | 1.6 | 1.6 | 1.2 | 1.8 | 1.4 | 1.0 | 1.0 | 1.0 |
| Employment cost index | 1.9 | 2.0 | 1.9 | 1.9 | 2.1 | 2.1 | 4.1 | 1.0 | -0.2 | 4.1 | 3.3 |
| Labor markets | |||||||||||
| Average monthly change in employment | 65 | 165 | 184 | 205 | 245 | 226 | -136 | 270 | 209 | 129 | 64 |
| Unemployment rate (percent) | 9.6 | 8.9 | 8.1 | 7.4 | 6.2 | 5.4 | 6.9 | 7.4 | 6.3 | 5.4 | 5.3 |
| Employment to population (percent) | 58.5 | 58.4 | 58.6 | 58.6 | 59.0 | 59.5 | 58.8 | 59.0 | 59.8 | 59.9 | 59.7 |
| Income and wealth | |||||||||||
| Real disposable personal income | 1.0 | 2.5 | 3.2 | -1.4 | 2.7 | 3.0 | 3.0 | 2.5 | 1.0 | 2.1 | 2.4 |
| Net household wealth ($ trillions) | 62 | 64 | 70 | 79 | 83 | 92 | 53 | 101 | 112 | 123 | 125 |
| Personal saving rate (percent of disposable income) | 5.6 | 6.0 | 7.6 | 4.8 | 4.8 | 4.7 | 4.8 | 6.7 | 5.2 | 4.2 | 4.6 |
| After tax corporate profits with corporate profits with inventory valuation and capital consumption adjustments | 25.0 | 4.0 | 10.0 | 2.0 | 1.7 | 1.0 | 2.0 | -15.9 | 12.3 | 4.2 | 1.7 |
| Housing | |||||||||||
| Housing starts (thousands) | 586 | 612 | 784 | 928 | 1,001 | 1,130 | 1,263 | 1,292 | 1,515 | 1,442 | 1,277 |
| Stock of owner occupied homes (millions) | 132 | 132 | 133 | 133 | 134 | 135 | 136 | 136 | 138 | 139 | 140 |
| Interest rate on 30 year fixed rate mortgages (percent) | 4.69 | 4.46 | 3.66 | 3.98 | 4.17 | 3.91 | 4.53 | 3.45 | 4.39 | 5.39 | 7.39 |
| Foreign trade | |||||||||||
| Current account balance, share of GDP (percent) | -3.0 | -3.0 | -2.8 | -2.3 | -2.2 | -2.5 | -2.8 | -2.3 | -2.1 | -2.0 | -1.1 |
| Merchandise trade balance ($ billions) | -691 | -784 | -791 | -752 | -722 | -775 | -903 | -779 | -899 | -1,054 | -1,083 |
| Relative unit labor costs (Index, 2008=100) | 94 | 87.3 | 84.5 | 81.3 | 81.5 | 85.6 | 88.1 | 89.9 | 89.3 | 86.5 | 84.4 |
| Financial | |||||||||||
| Federal funds rate (percent) | 0.13 | 0.13 | 0.13 | 0.13 | 0.1 | 0.23 | 0.18 | 1.25 | 1.52 | 3.2 | 3.75 |
| Yield on 10-year Treasury note (percent) | 2.86 | 2.05 | 1.71 | 2.75 | 2.28 | 2.34 | 1.3 | 1.33 | 2.33 | 4.25 | 5.63 |
| Government | |||||||||||
| Federal budget balance, unified basis (share of GDP, percent) | -8.9 | -8.5 | -7.3 | -4.3 | -2.9 | -2.5 | -2.7 | -3.6 | -3.7 | -3.6 | -3.8 |
Sources: Historical data: US government agencies and Oxford Economics. Forecast: Deloitte, using the Oxford Global Economic Model.
TABLE 4. recession
Percent change, year over year unless otherwise noted.
| History | Forecast | ||||||||||
| 2010 | 2011 | 2012 | 2013 | 2014 | 2015 | 2016 | 2017 | 2018 | 2019 | 2020 | |
| GDP and components | |||||||||||
| Real GDP | 2.5 | 1.6 | 2.2 | 1.5 | 2.4 | 2.2 | 2.3 | 2.2 | 1.9 | 1.7 | 1.9 |
| Real consumer spending | 1.9 | 2.3 | 1.5 | 1.7 | 2.7 | 2.9 | 2.3 | 2.1 | 2.1 | 2.0 | 2.1 |
| Real consumer spending, durable goods | 6.1 | 6.1 | 7.4 | 5.8 | 5.9 | 5.5 | 5.5 | 3.9 | 3.6 | 2.5 | 1.9 |
| Real consumer spending, nondurable goods | 2.2 | 1.8 | 0.6 | 1.9 | 2.1 | 2.4 | 1.5 | 1.3 | 1.6 | 1.9 | 2.0 |
| Real consumer spending, services | 1.2 | 1.8 | 0.8 | 1.0 | 2.4 | 2.7 | 2.0 | 2.1 | 2.0 | 2.0 | 2.1 |
| Real investment in private housing | -2.5 | 0.6 | 13.5 | 9.5 | 1.8 | 8.8 | 14.5 | 13.1 | 0.2 | -13.1 | -8.9 |
| Real fixed business investment | 2.5 | 7.7 | 9.0 | 3.0 | 6.2 | 2.6 | 3.3 | 3.2 | 2.8 | 3.6 | 3.0 |
| Real inventory accumulation | 58.0 | 38.0 | 55.0 | 61.0 | 68.0 | 105.0 | 61.0 | 34.0 | 23.0 | 21.0 | 23.0 |
| Real exports of goods and services | 11.9 | 6.9 | 3.4 | 2.8 | 3.4 | 1.6 | 4.3 | 3.8 | 3.3 | 3.5 | 3.6 |
| Real imports of goods and services | 12.7 | 5.5 | 2.2 | 1.1 | 3.8 | 5.5 | 3.2 | 4.0 | 2.7 | 1.5 | 2.2 |
| Real government consumption and investment | 0.1 | -3.0 | -1.9 | -3.0 | -0.6 | 0.3 | 0.4 | 0.5 | 0.6 | 0.7 | 0.8 |
| Real Federal government consumption and investment | 4.3 | -2.7 | -1.9 | -5.7 | -2.4 | -0.7 | -0.4 | -0.3 | -0.2 | -0.1 | 0.6 |
| Real state and local government consumption and investment | -2.7 | -3.3 | -1.9 | -1.0 | 0.6 | 0.9 | 1.0 | 1.1 | 1.2 | 1.2 | 1.2 |
| Prices | |||||||||||
| Consumer price index | 1.6 | 3.1 | 2.1 | 1.5 | 1.6 | 0.6 | 2.8 | 2.3 | 2.2 | 2.2 | 2.4 |
| Chained price index for personal consumption expenditures | 1.7 | 2.5 | 1.9 | 1.4 | 1.4 | 0.9 | 2.6 | 2.1 | 2.0 | 1.9 | 2.2 |
| Chained GDP price index | 1.2 | 2.1 | 1.8 | 1.6 | 1.6 | 1.3 | 2.3 | 2.3 | 2.2 | 2.1 | 2.1 |
| Employment cost index | 1.9 | 2.0 | 1.9 | 1.9 | 2.1 | 2.1 | 3.5 | 3.6 | 3.1 | 3.0 | 3.3 |
| Labor markets | |||||||||||
| Average monthly change in employment | 65 | 165 | 184 | 205 | 245 | 216 | 130 | 92 | 76 | 32 | 60 |
| Unemployment rate (percent) | 9.6 | 8.9 | 8.1 | 7.4 | 6.2 | 5.4 | 4.9 | 5.0 | 5.0 | 5.3 | 5.5 |
| Employment to population (percent) | 58.5 | 58.4 | 58.6 | 58.6 | 59.0 | 59.5 | 59.9 | 59.8 | 59.7 | 59.2 | 58.9 |
| Income and wealth | |||||||||||
| Real disposable personal income | 1.0 | 2.5 | 3.2 | -1.4 | 2.7 | 3.0 | 2.0 | 2.4 | 2.2 | 1.8 | 1.6 |
| Net household wealth ($ trillions) | 62 | 64 | 70 | 79 | 83 | 92 | 101 | 109 | 113 | 114 | 116 |
| Personal saving rate (percent of disposable income) | 5.6 | 6.0 | 7.6 | 4.8 | 4.8 | 4.8 | 4.5 | 4.8 | 5.0 | 4.8 | 4.5 |
| After tax corporate profits with corporate profits with inventory valuation and capital consumption adjustments | 25.0 | 4.0 | 10.0 | 2.0 | 1.7 | 1.0 | 1.0 | 0.5 | -0.8 | 2.8 | 1.7 |
| Housing | |||||||||||
| Housing starts (thousands) | 586 | 612 | 784 | 928 | 1,001 | 1,129 | 1,398 | 1,619 | 1,610 | 1,368 | 1,214 |
| Stock of owner occupied homes (millions) | 132 | 132 | 133 | 133 | 134 | 135 | 136 | 137 | 138 | 139 | 140 |
| Interest rate on 30 year fixed rate mortgages (percent) | 4.69 | 4.46 | 3.66 | 3.98 | 4.17 | 3.9 | 4.49 | 5.31 | 6.12 | 6.54 | 7.31 |
| Foreign trade | |||||||||||
| Current account balance, share of GDP (percent) | -3.0 | -3.0 | -2.8 | -2.3 | -2.2 | -2.4 | -2.2 | -2.1 | -2.0 | -1.8 | -1.7 |
| Merchandise trade balance ($ billions) | -691 | -784 | -791 | -752 | -722 | -774 | -798 | -813 | -833 | -832 | -865 |
| Relative unit labor costs (Index, 2008=100) | 94 | 87.3 | 84.5 | 81.3 | 81.5 | 85.9 | 87.9 | 85.7 | 83.5 | 81.1 | 79.2 |
| Financial | |||||||||||
| Federal funds rate (percent) | 0.13 | 0.13 | 0.13 | 0.13 | 0.1 | 0.16 | 1.85 | 2.56 | 2.86 | 3.15 | 3.54 |
| Yield on 10-year treasury note (percent) | 2.86 | 2.05 | 1.71 | 2.75 | 2.28 | 2.31 | 2.4 | 2.94 | 3.74 | 4.54 | 5.39 |
| Government | |||||||||||
| Federal budget balance, unified basis (share of GDP, percent) | -8.9 | -8.5 | -7.3 | -4.3 | -2.9 | -2.5 | -2.6 | -2.7 | -3.0 | -3.5 | -4.0 |
Sources: Historical data: US government agencies and Oxford Economics. Forecast: Deloitte, using the Oxford Global Economic Model.