
Housing construction has been saved

Housing construction What happens when the kids finally leave?
13 March 2015
How much housing construction will we need to meet the needs of the growing US population? And will college graduates have houses waiting for them when they move out?
Explore
View the Behind the Numbers collection, a monthly series from Deloitte’s economists.
The Baby Boomers in the audience always give a nervous laugh when I turn to talking about the prospects for housing. Their children, I tell them, will eventually move out of the house. Whether they actually have post-college children at home or not, they recognize one of the great comedy tropes of the Great Recession—unemployed or underemployed relatives forced to bunk with family when they would prefer to live alone. It’s not just college grads living in their old bedrooms, of course. In fact, the problem is almost certainly worse for the less skilled workers who suffered the most during the downtown, as jobs evaporated along with housing that they were told (incorrectly) that they could afford. It’s a deadly serious problem for many Americans. But just how big is the problem? Because if those people do eventually move out, well, they’ll need someplace to live. And home building hasn’t been very strong over the past five years. Starting with the beginning of the housing bust in 2006, the growth in the number of households slowed remarkably. Between 1995 and 2006, the US population added an average of 298,000 households per quarter. That number dropped to 136,000—less than half—on average between 2007 and today. Of course, slowing population growth might have caused some fall in the net number of new households. However, if households had grown at the same rate as the population after the housing bust, the United States would have an additional 3.2 million households—and would need 3.2 million houses to put those households in. Some of those houses already exist. Figure 1 shows how vacancy rates shot up during the housing bubble as houses were built in the hope that buyers would come—and then shot up further when it turned out that many people who had bought houses couldn’t afford them. If the housing vacancy rate dropped back to the 1995–2001 level, 2.5 million additional homes would be occupied—that’s 78 percent of the housing units needed to accommodate the “pent-up demand” for household formation. So when the college graduates finally start moving out of the house, some of the buildings for them already exist. 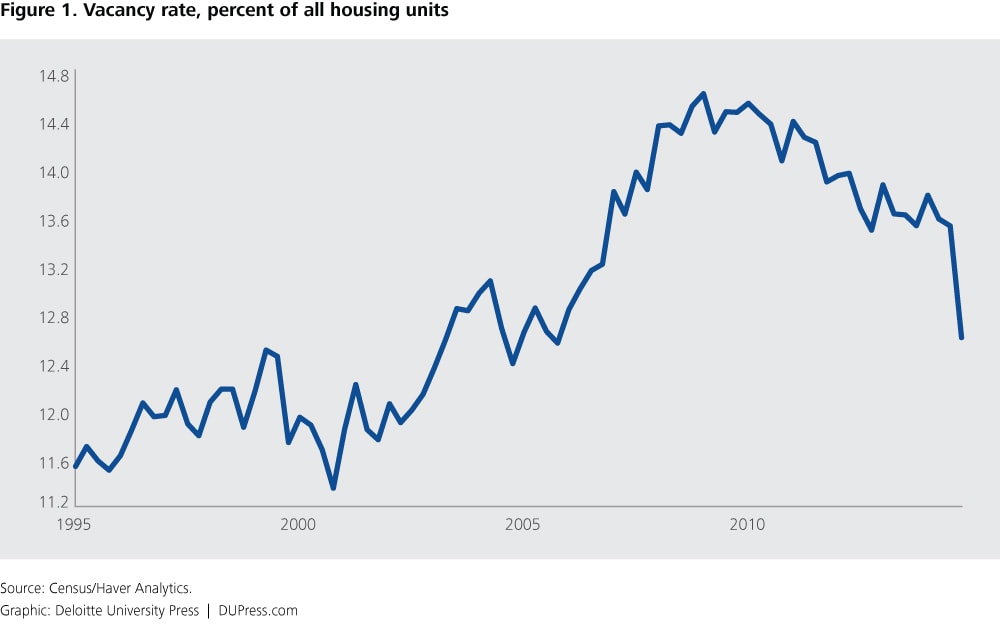 However, there are reasons to think that vacancies underestimate pent-up housing demand. First, there is the question of whether currently existing houses are in the right place—or in good enough condition to salvage. Data on the stock of housing and new houses completed suggested that, on net, 392,000 old housing units were taken out of service in 2014. That’s a record. It likely reflects the overabundance of housing in areas such as the Midwest as well as the overoptimistic construction of the mid-2000s that has resulted in nearly empty housing developments. These are houses that simply aren’t where people wish to live. And so the housing stock may overestimate the amount of housing really available. Second, there is a question about whether the existing stock of houses meets the needs (and ability to pay) of those who are looking for a new place to live. Figure 2 shows how the housing bubble encouraged owning single-family houses. Although people can also own units in multifamily buildings and can rent single-family homes, most single-family homes are owned, and most renters live in multifamily units. The rental share of all housing units fell six percentage points between 1995 and the height of the bubble in 2006. It has since moved back, but not all the way to the 1995 level.
  This suggests that there still may be too many single-family homes—and too few apartments—relative to future demand. The construction statistics appear to confirm that. Multifamily housing construction has, in fact, returned to “normal” levels—the weakness in housing construction is entirely concentrated in single-family houses. How much housing construction will we need to make up the gap and meet the needs of the growing US population? Figure 3 shows Deloitte’s forecast of housing starts for the next 10 years. Housing starts are calculated as the difference between demand (based on census population projections) and the existing stock of housing. The stock of housing grows as construction occurs, but it also shrinks as houses are taken out of service (depreciation). The forecast is based on the following assumptions:
- Household size starts to fall in 2016 as the improving economy allows people to move out of less-than-satisfactory joint living conditions. (That means that Baby Boomers’ kids will indeed be moving out of the basement.)
- Depreciation of housing remains high until 2017, and then falls back to a level consistent with past experience. High depreciation of housing reflects the fact that a lot of housing remains in the wrong place and is of the wrong type.
- The vacancy rate moves back to levels consistent with the long run as unwanted housing is removed from service.
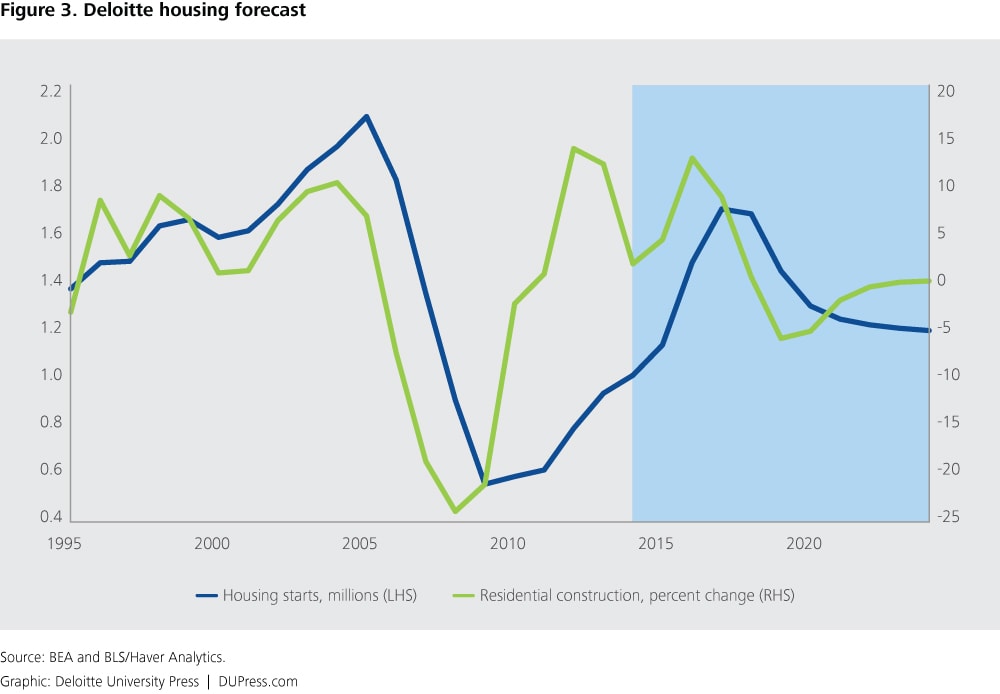 The data suggest that housing construction will grow through 2017, reaching a maximum annual rate of 1.6 million units. The excess demand will be filled, and housing construction will shrink back to a level consistent with population growth. By 2020, this would be about 1.2 million starts. And the period of shrinking back to long-run demand means that housing will go through another down period once the current pent-up demand is satisfied. All those Millennials supposedly living in their parents’ basements just don’t add up to enough to maintain strong growth in the housing sector for that long. Housing construction is set to be a boring area for the economy. Given the excitement of the past 15 years, that’s probably just as well.