Are you leveraging your data to drive performance? has been saved

Article
Are you leveraging your data to drive performance?
Does your management information link your strategic objectives to operational delivery, driving value for money and the delivery of citizen outcomes?
There is a tendency…. to see success in Government measured by the sound of applause in the (Westminster) village…. But what is less often felt is the pressure to show… that programmes have been effective and enduring. Of the 108 major programmes for which Government is responsible, only 8% are actually assessed to judge if they have been delivered effectively and brought about the desired effects
Michael Gove,
2020 Ditchley Foundation Speech on vision for the government
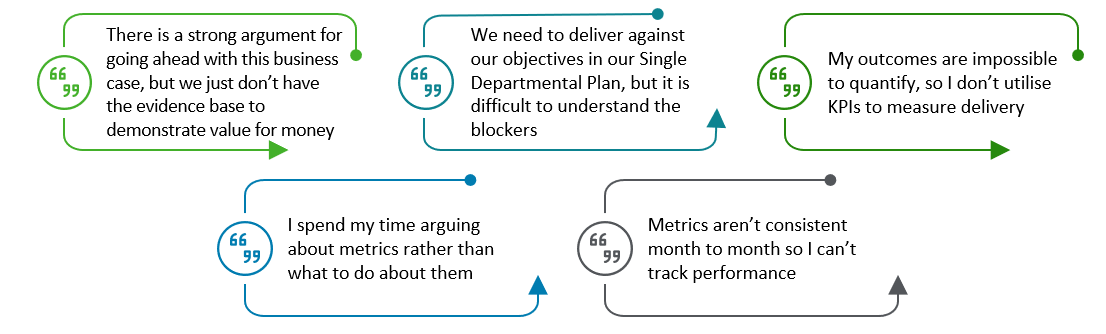
As part of Spending Review 2020, the UK government commissioned each Department to produce an Outcome Delivery Plan, setting out how they will measure the value they are delivering. With Spending Reviews Plans being developed for 2021, Departments may find themselves further scrutinised on outcome delivery. While everyone can agree that improving outcomes is a good thing, actually delivering, and demonstrating delivery, can be difficult. Recent years have seen huge increases in the information available as new technologies have been adopted, data has moved to the cloud and processes have been automated. This cascade of data can lead to management information becoming fragmented, contradictory and not fit for purpose. Furthermore, some things, particularly outcomes, are very difficult to measure. When speaking to our public sector clients, we hear a number of recurring themes:
To resolve these issues, we suggest following three basic principles:

 |
Be clear Departments are clear on their purpose, and their key objectives. What is sometimes harder to measure is how well these are being delivered and what the blockers are. For example, building affordable homes is a key priority for every government, and the number of new homes being built can be measured. However, this figure is meaningless unless it is linked to levels of home ownership across the country, which is a key outcome of any home building programme. Furthermore, without supporting metrics, such as number of people employed in construction or time to complete a planning application, blockers to delivery cannot be understood. Leaders should ask themselves if they are able to tell a clear story with their data, linking strategic outcomes to key metrics. Visualisations against upcoming milestones convey delivery against objectives more clearly than lengthy word documents or detailed Gantt Charts and specific risks charted in a visual way can help to hone in on areas that really matter. Most importantly, leaders should consider whether their dashboards drive evidence-based decision-making and link together the different levels of their organisation to deliver their outcomes. |
 |
Be actionable Information has no purpose if it doesn’t drive action. If a department is providing grants to businesses to help them to prosper, it is not enough to know the total value of grants provided, if the intended outcome is to improve the UK’s R&D base. Leaders need to be able to review the number of patents which the investment has generated, or how productivity has increased in the sector. They need to be able to compare between recipients in order to understand which grants are generating value for money, and prioritise accordingly, or to understand why businesses are not getting their grants on time and implement solutions. By highlighting where a target is being missed, or presenting a future risk to delivery, MI should trigger a response from leadership. Key to this is understanding timelines for the project to deliver its outcomes. A new project might not have had a chance to impact the desired outcomes, however, this does not mean that early indicators of success should not be reviewed. Being able to clearly articulate the level of input, the efficiency of processes and the delivery of outputs should allow leaders to understand if an outcome is at risk before it fails. |
 |
Be trusted In order to make decisions backed by evidence, leaders need to trust the information that they receive. However, information is often pulled from multiple systems before being used by people in different ways. Information shared in a variety of ways creates inconsistencies, leading to stakeholders questioning what is correct and losing trust in the numbers. Furthermore, it is impossible to measure everything, and some outcomes take a significant time to crystallise. It is not always possible to say “if I increase A, then B will increase by X amount”. Being clear about what your data is showing, how it links together and what its limitations are make it easier to “take a leap of faith” and allow for trust in delivery. For example, understanding the impact of a new education policy can be daunting. Children take years to grow up and defining whether someone is “well-educated” using quantitative measures is impossible. However, it is possible to review the numbers of new teachers hired, new schools built and new providers funded. Clearly defining these helps to build trust, for example by differentiating between additional and replacement teachers. This trust provides a solid basis from which to start measuring outcomes. By necessity, for something like education these will need to be proxies; such as exam results, further or higher education places, employment and earnings. By being open about what the data is showing and using a range of proxies to build a picture of outcomes over time, leaders can demonstrate value even in areas which are unquantifiable. |
Clear, actionable and trusted management information allows you to demonstrate delivery and target interventions, confident in the knowledge that the right issue is being addressed.
If you would like to know more about how we at Deloitte are helping our clients solve these problems, please contact the team below.
Key contacts

