


Decoding the tech sector layoffs has been saved
Cover image by: Sofia Sergi

From the news headlines, one might think that this is a terrible time to be a tech worker as notices of layoffs continue to mount in the sector. That the layoffs are occurring at very high-profile tech companies—companies that usually appear in news stories touting their growth and expansion—has raised concerns that perhaps the labor market, and therefore the US economy, might be more fragile than generally thought. However, when these layoffs are considered relative to the regular churn that is always happening, they do not appear to be quite so ominous.
Tech workers are not just employed by the large tech firms featured in the news reports; they also work in industries throughout the economy. Despite the headlines, overall demand for workers in tech occupations remains high, according to recent data.1 And while some of the most notable of the announced layoffs comprise a sizable share of the total employment of the firms doing the layoffs, they are not large relative to the size of the US labor force; specifically, they are not large relative to the usual level of monthly churn of quits and layoffs.
If we switch the focus from “tech sector” to industries that employ the highest proportion of tech workers, we do see some slowing in employment. However, it is too soon to tell if this slowing is coming from the tech-occupation portion of their workforces or from other types of occupations. Overall, we do expect the pace of job creation to eventually slow down so that employment increases more closely match growth in the labor force going forward. However, with the number of job openings still high, quit rates running well above prepandemic levels, and layoffs running well below, there are no signs yet that rising unemployment will soon be an issue.
“Tech workforce” and “tech sector” are commonly used terms, but they do not line up well with how government occupational and employment data are organized. In another Economics Spotlight article, The tech workforce is expanding—and changing—as different sectors battle for talent, Deloitte economist Akrur Barua pulled together a grouping of six occupations and suboccupations from the Bureau of Labor Statistics’ (BLS) Occupational Employment and Wage Statistics to define the tech workforce. Based on that framework, about 80% of the tech workforce falls into the single occupational category of computer and mathematical science—a fortunate occurrence since that is the only series for which we have current data.
In the press, many discussions of tech layoffs focus on announcements by a few specific companies generally thought of as “Big Tech.” Using press releases, one could arrive at an estimate of the number of layoffs in the tech sector—however one chooses to define it—over the past year. But that focus on actions taken by specific firms does not reveal much about overall demand for tech workers. Tech workers are employed, in varying degrees, in every sector of the economy.
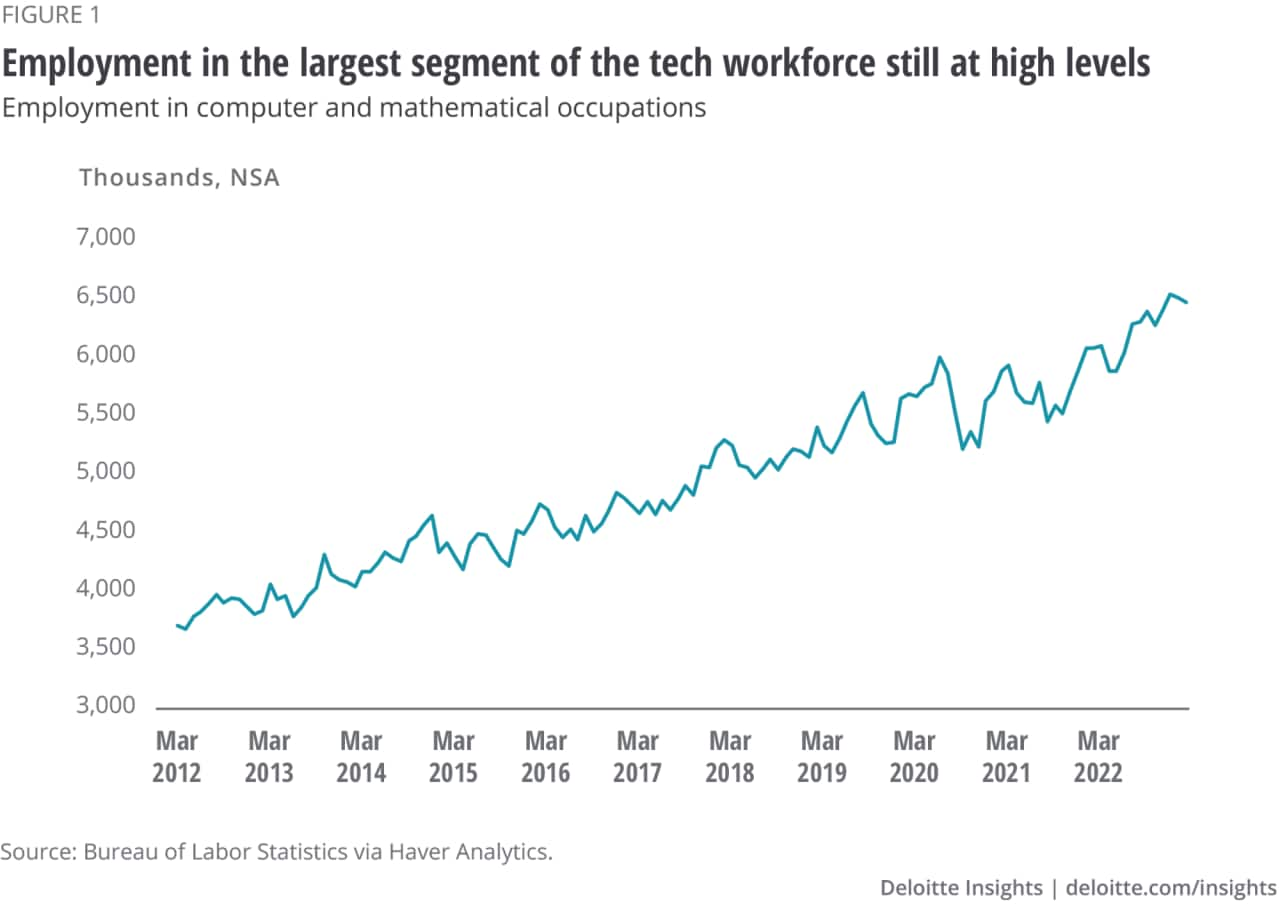
As shown in figure 1, although employment growth in computer and mathematical science occupations slowed during the pandemic, it resumed its upward trend starting mid-2021. And growth has continued throughout the most recent period, which includes high-profile layoffs. In terms of the size of some of the announced layoffs, they are small relative to the 6.5 million employed in this subset of the tech workforce,2 even if they are large relative to the individual firm’s total employment.
Firms are designated by analysts or themselves3 as tech firms on the basis of how integral technology is to their production processes. Employment at companies commonly thought of as making up the tech sector are counted by government statisticians in many different industries; indeed, this is the case for any business that operates in more than one location. The unit of measurement for employment surveys is the establishment—defined by BLS as “an economic unit that produces goods or services, usually at a single physical location, and is engaged in one or predominantly one activity, not the firm.” Therefore, any business entity that engages in different activities in different locations—think warehouses versus corporate offices—will have its employment distributed across the applicable industries. Therefore, it is not possible to define a set of industries as composing the tech sector.
However, we do have some information on the prevalence of tech workers by industry. In Barua’s earlier piece, he found the largest numbers of tech workers in professional and business services, finance and insurance, and information services.4
As of 2021 (the latest complete data available), the tech workforce from all six occupational categories accounted for only 4% of total employment.5 But before we dismiss shifts in this relatively small occupational category, recall that the monthly changes in employment that are the focus of intense scrutiny the first Friday of every month (mostly) are exceeding small compared to total employment: Over the last 12 months (ending February 2023), employment gains have averaged 403,000 per month—an average monthly increase in total employment of only 0.26%.6
It should also be remembered that these monthly changes in employment are net changes. They are a combination of the number of new hires and those who have left their jobs voluntarily (quits) or involuntarily (layoffs and discharges), and these underlying shifts dwarf the net change. One of the concerns about the tech layoffs highlighted in the press is that they were layoffs—and layoffs have not been in the news since the height of the pandemic.
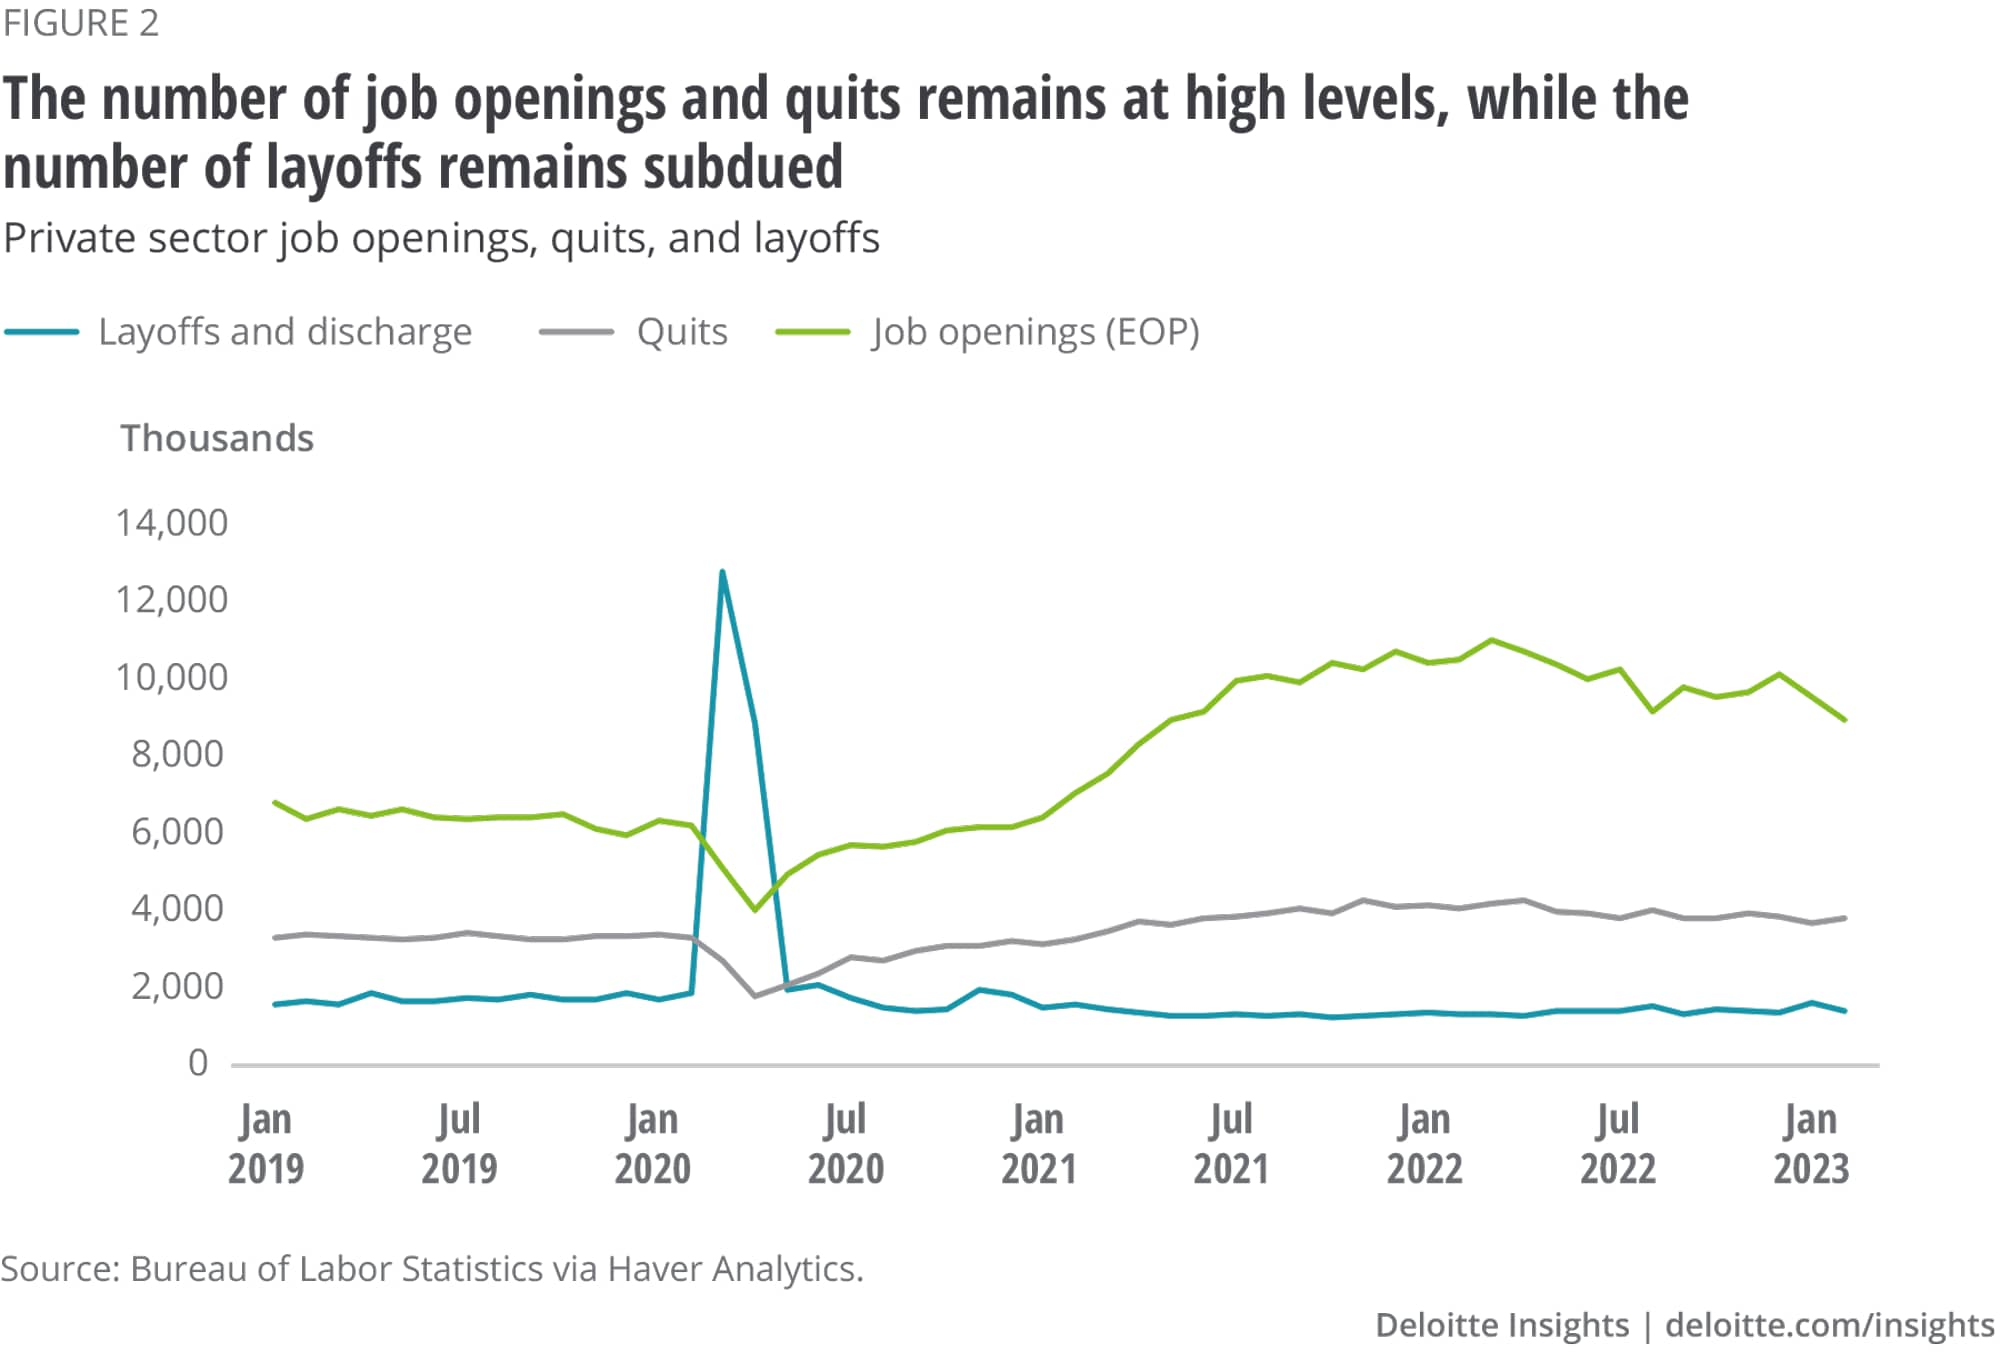
As shown in figure 2, layoffs and discharges dominated the two-month period that marked the COVID-19 recession. As the economy began to reopen and businesses adjusted to allow for remote work, job openings and quits rose and layoffs fell. At present, layoffs are running slightly below their prepandemic level and have averaged 1.4 million per month over the last 12 months. Whatever collection of companies are included in your definition of the tech sector, there is no combination that results in announced tech sector layoffs being any meaningful proportion of the almost 17 million layoffs that occurred over the last 12 months. As noted above, quits—which are viewed as positive indication that replacement jobs are available—have been substantially outpacing layoffs. Further, as shown in figure 2, the differential between the two has been more pronounced postpandemic: In the 12 months ending January 2023, on average, almost four million people per month quit their jobs.7 Figure 2 highlights another postpandemic change in the labor market—a surge in job openings.
Might these numbers for the overall economy be obscuring trends in the more tech-heavy industries? The industries identified as being tech-heavy are a much wider group than what is generally thought of as the tech sector.
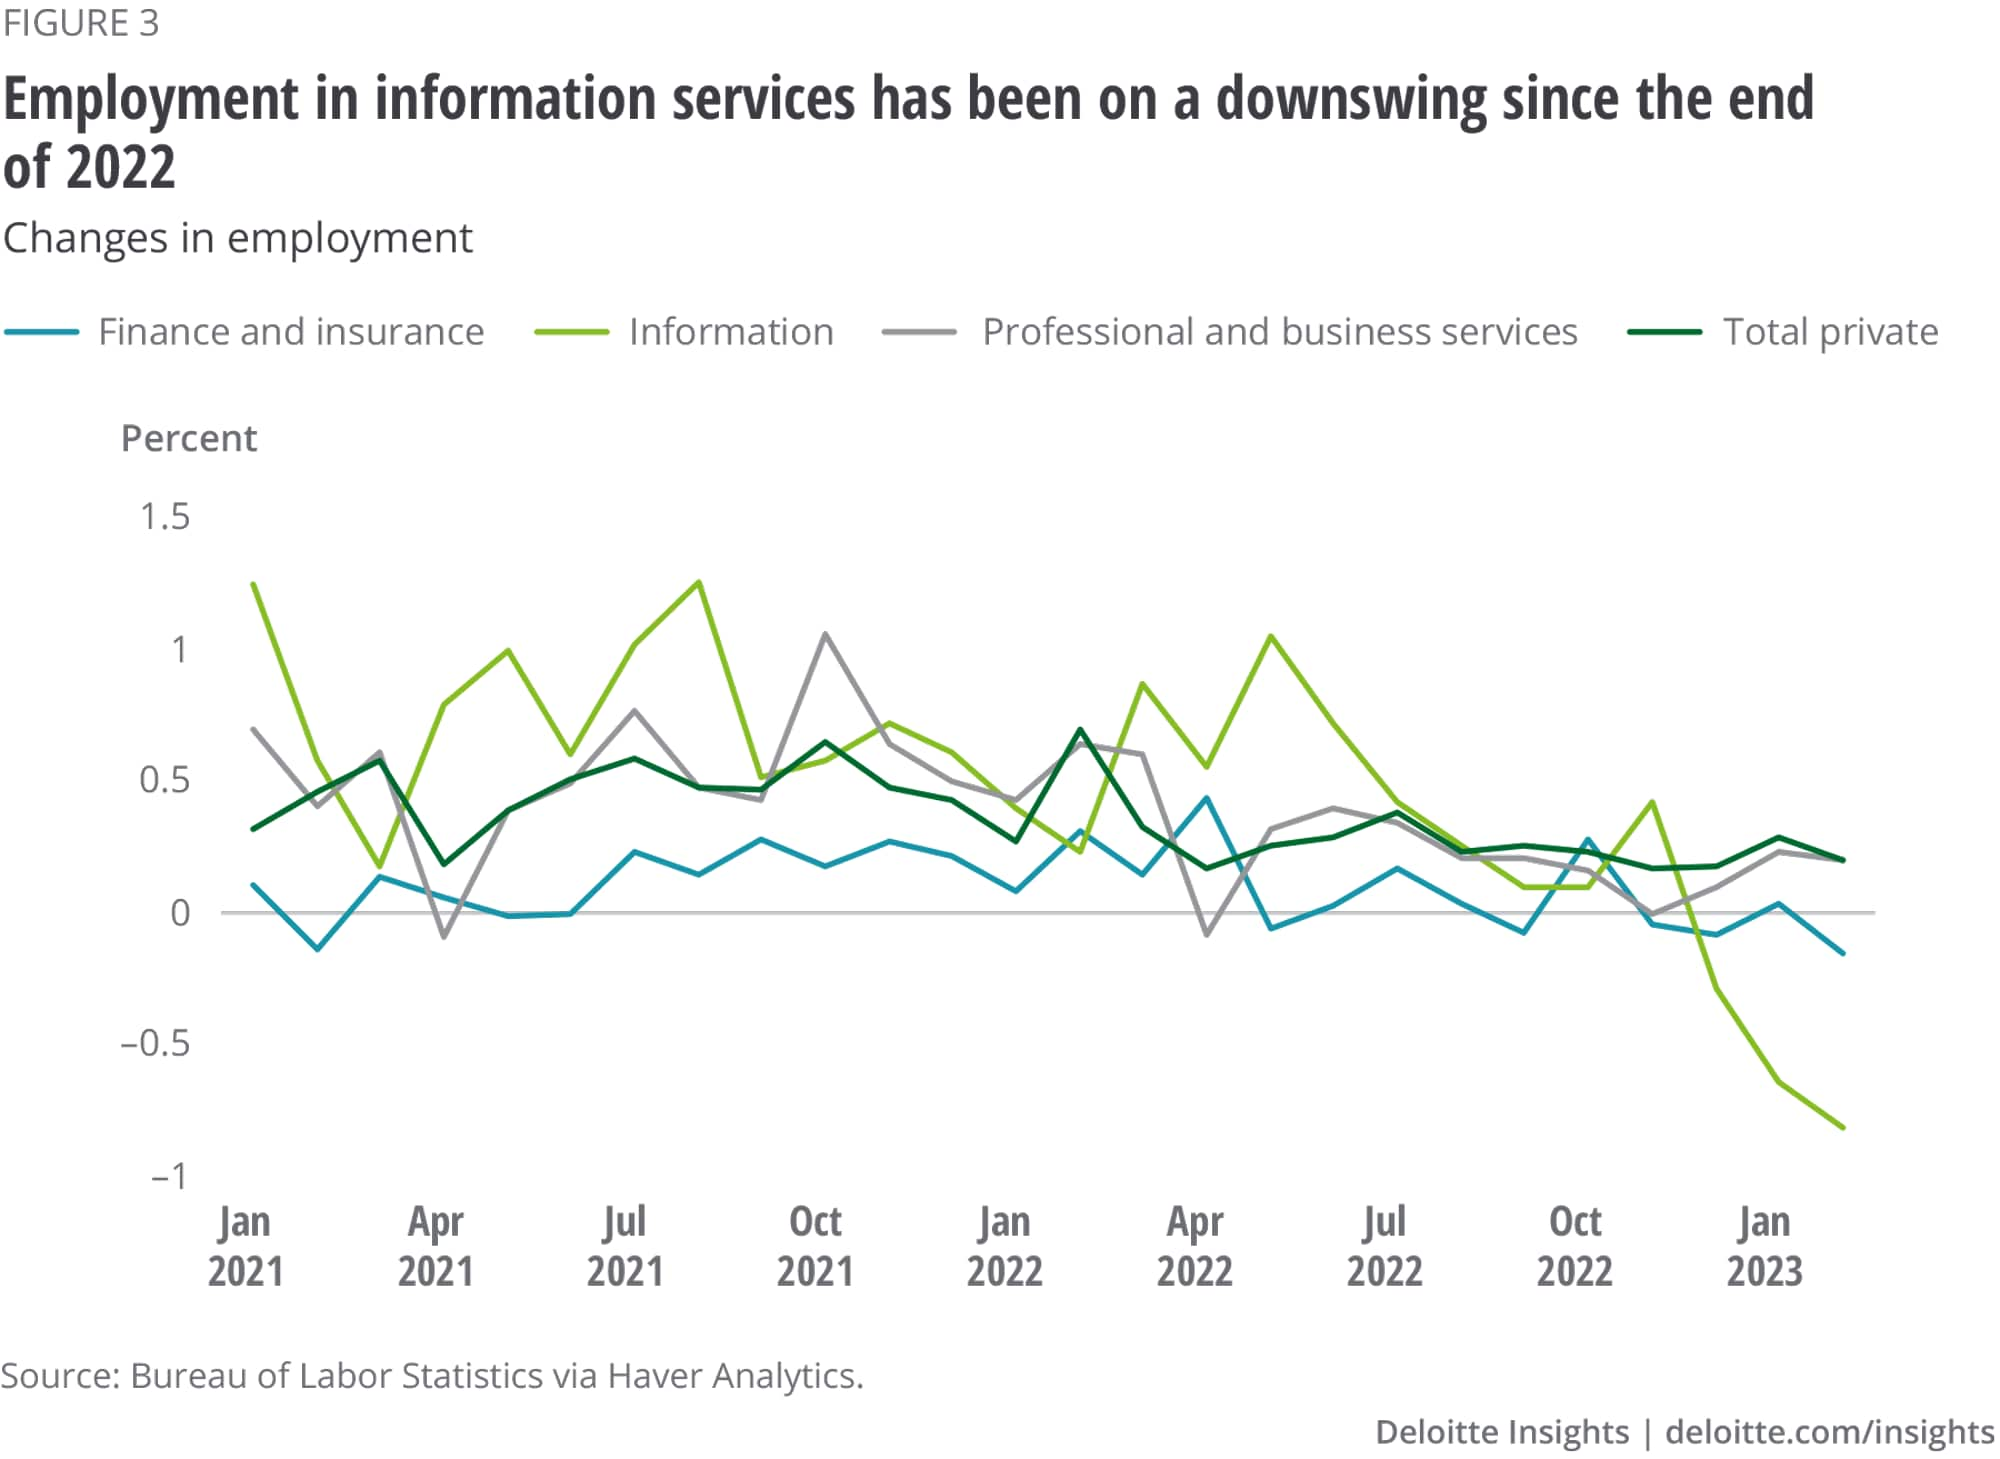
As noted above, the three industry groups found by Barua’s research to employ the largest number of tech workers were professional and business services, finance and insurance, and information services. During the pandemic, employment in professional and business services and information services fell somewhat less than that in private sector employment on a percentage basis, but these drops were very sharp. However, employment levels in finance and insurance were barely impacted. Figure 3 is limited to a more recent period because the extreme size of the employment swings during the pandemic period obscures the patterns in growth during the recent, more normal, period. The information industry, which likely houses sizable portions of tech sector employment, is definitely on a downswing. Employment in finance and insurance is trending flat, while employment in professional and business services is generally tracking changes in private industry employment.
To consider what is occurring in job openings, quits, and layoffs at the industry level, we switch from levels to rates, with the denominator being the total employment in each industry.
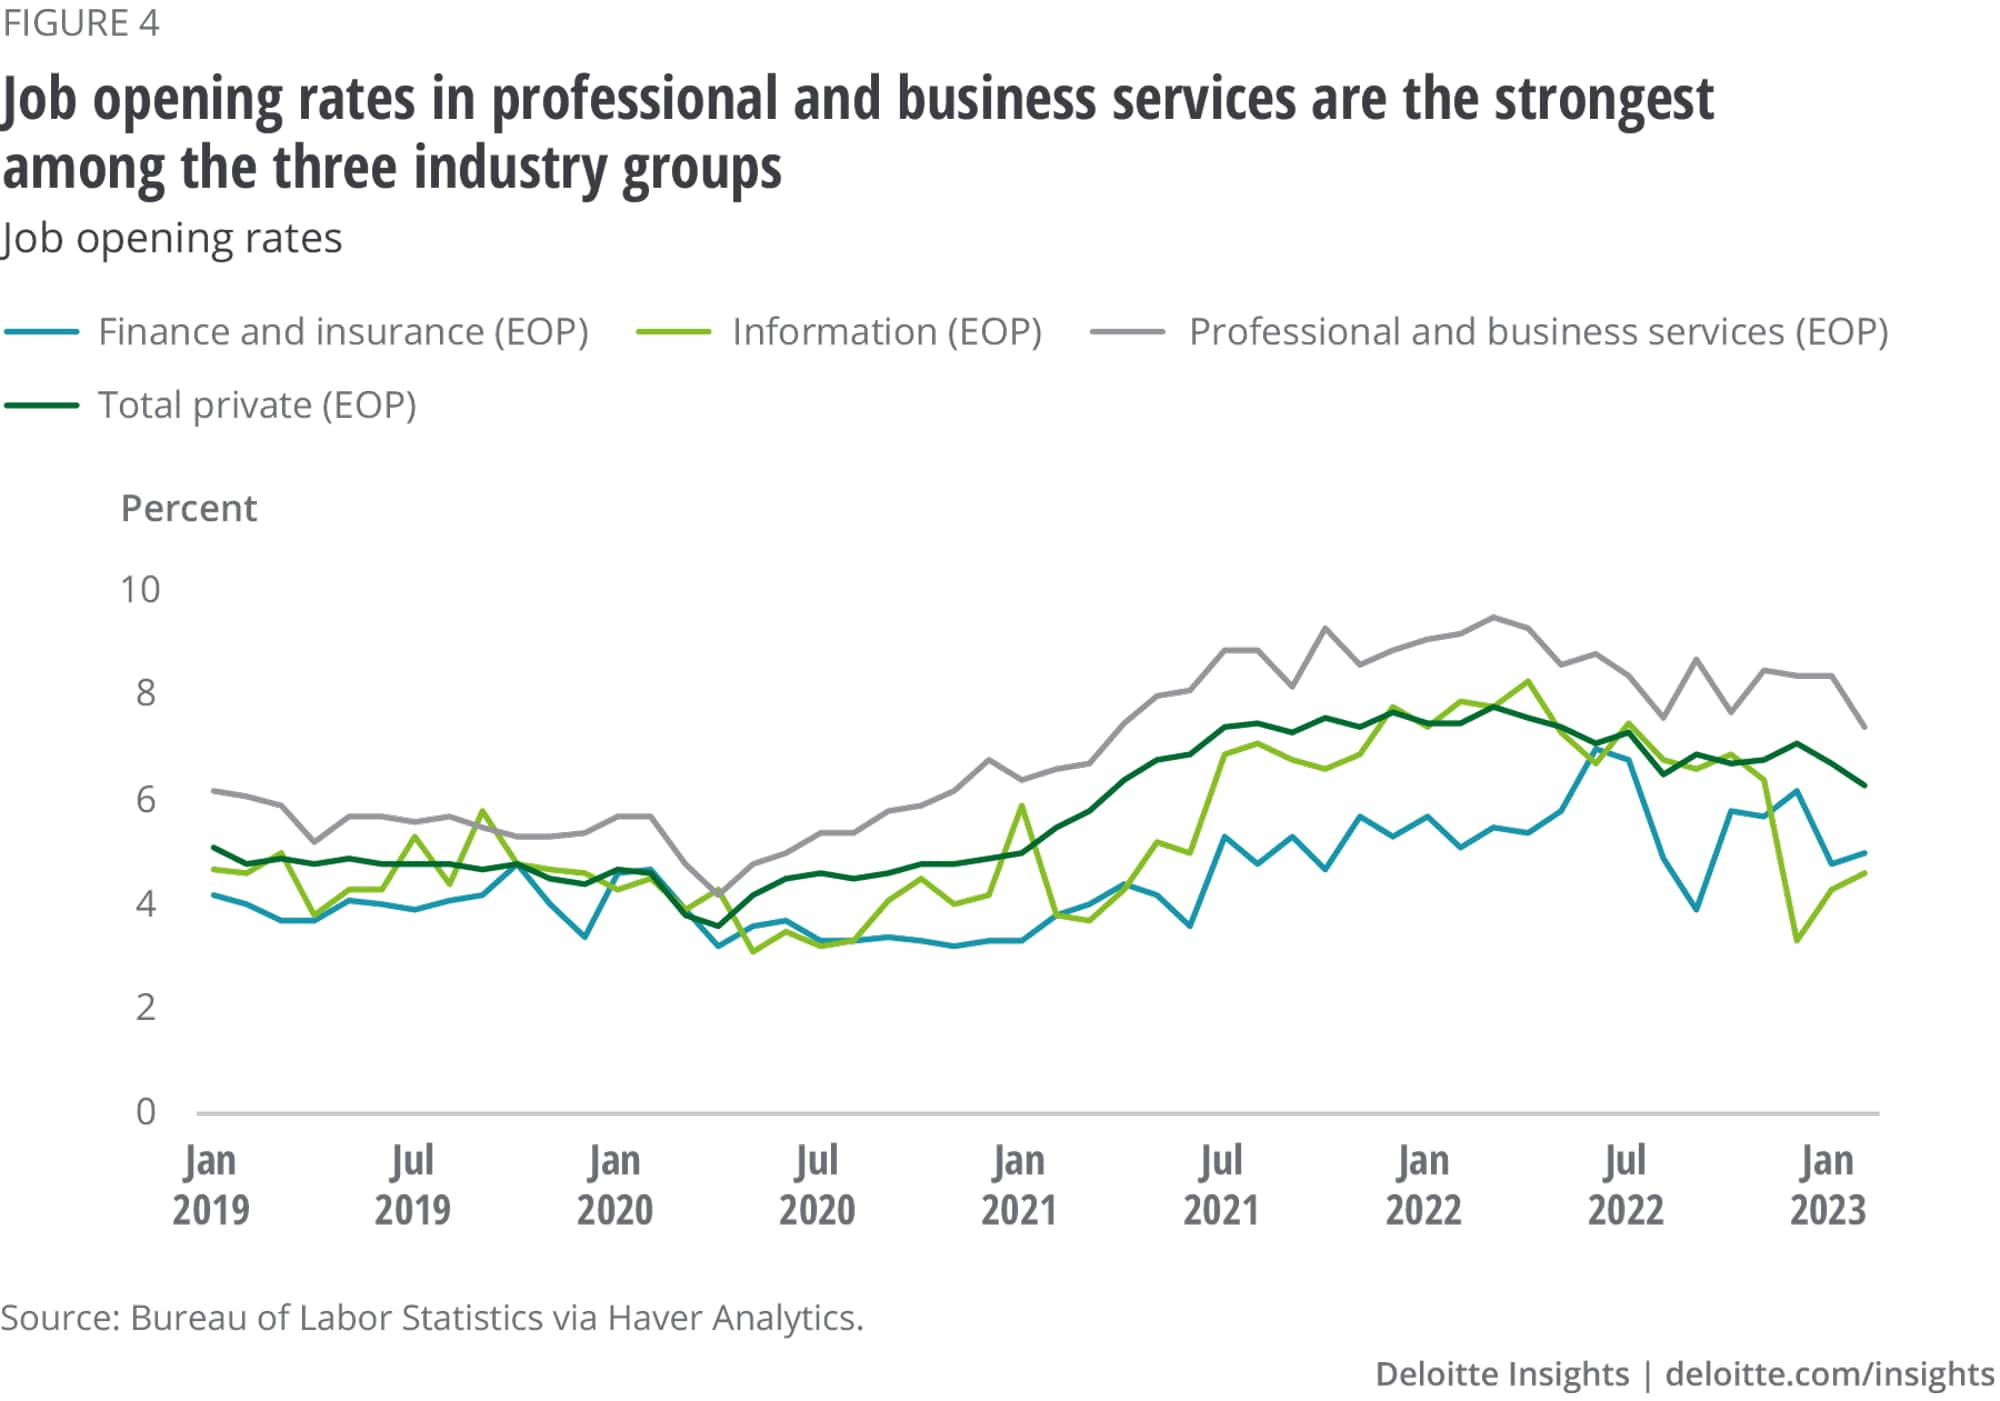
As shown in figure 4, even during the height of the pandemic, these industries were still posting job openings. The job opening rate in information services started falling about the same time as employment (figure 3). The job opening rate in finance and insurance continues to run well below the private industry average but, like employment, is trending flat. Professional and business services have been exhibiting the strongest labor demand of these three tech-heavy industries and have job openings above the private sector average, although, like the private sector, the job opening rate is trending down.
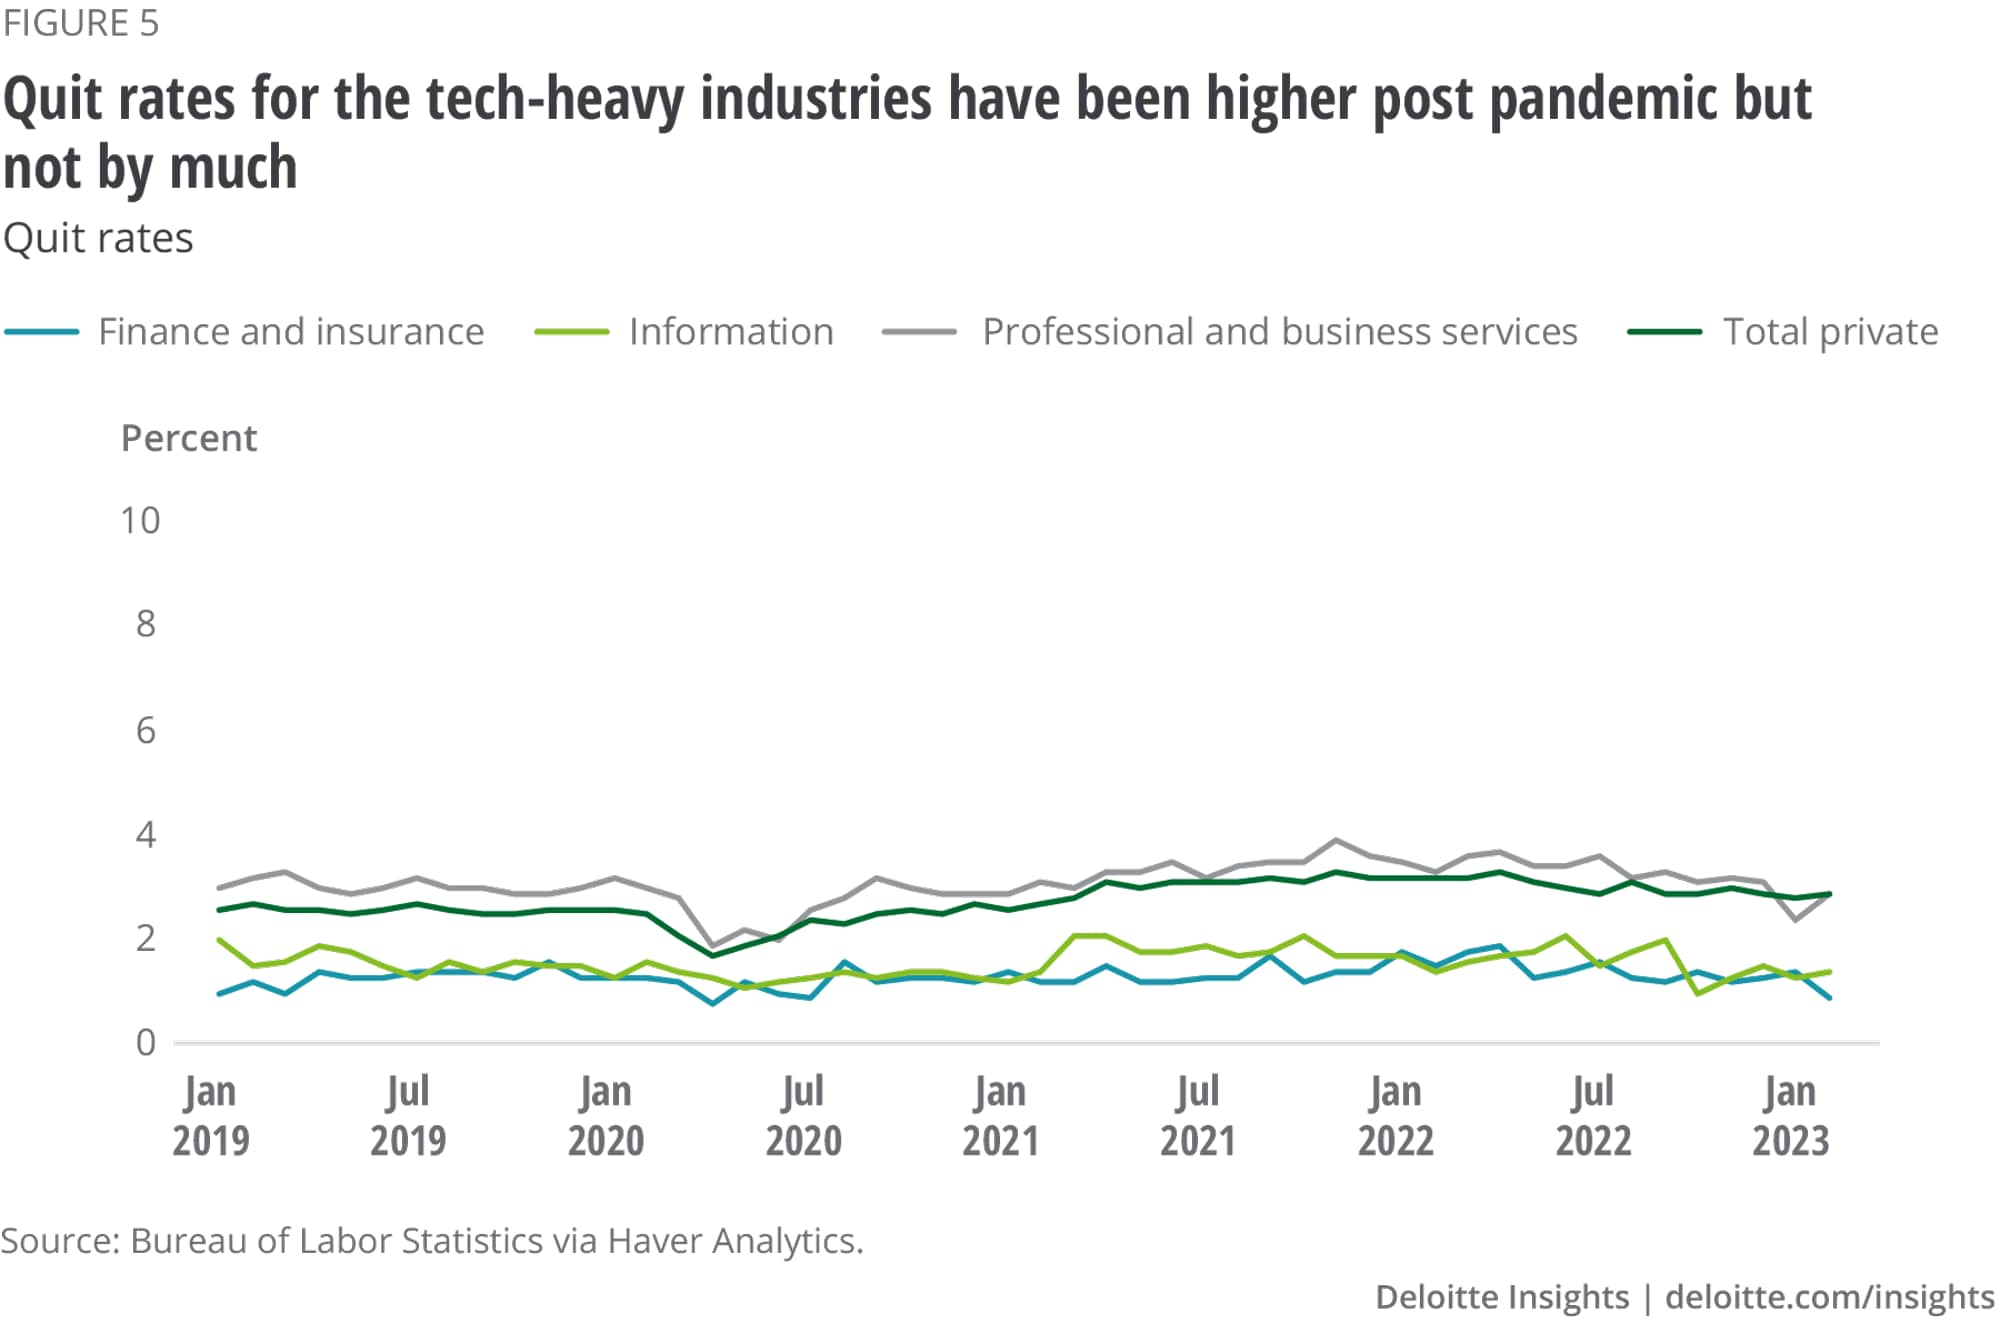
Quit rates for these three industries follow the private sector trend of being higher postpandemic than prepandemic, with professional and business services showing the highest increase of the three post-pandemic and closely tracking the private sector average. Quit rates for both are running at about 3% of total employment each month. Quit rates are lower for finance and insurance and information services, hovering just under 1.5% for the past few months.
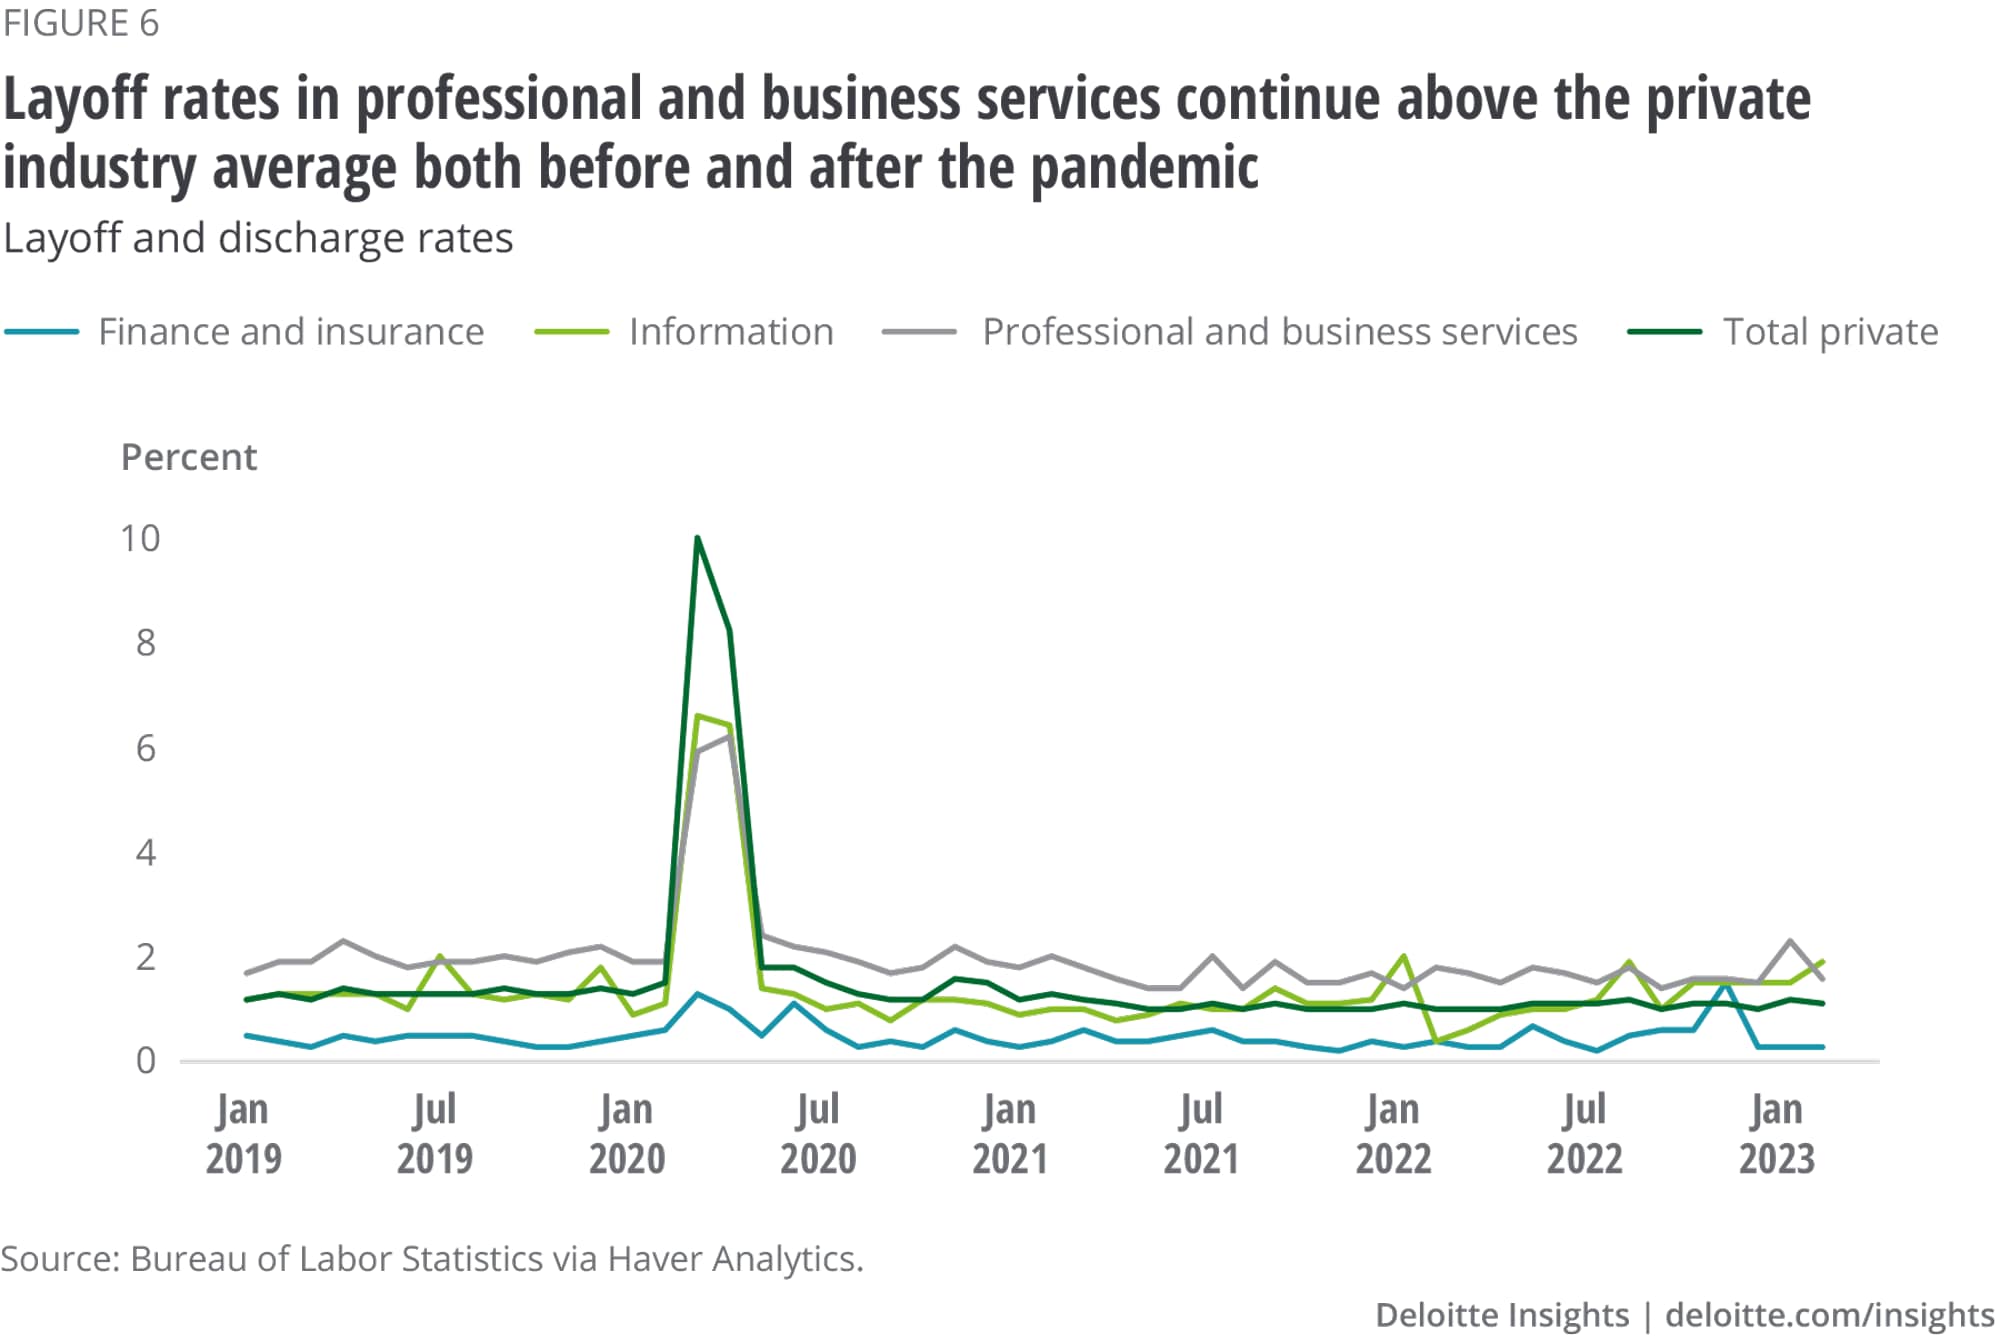
Mirroring the lack of change seen in employment levels, the finance and insurance industry did not see a major spike in layoffs during the pandemic, and layoff rates remained subdued in the postpandemic period. Layoff rates were high during the pandemic in professional and business services and information services, although they didn’t match the private industry peak—not a surprising finding given that the layoff rates in accommodation and food services peaked at 33.4% in March 2020. Layoff rates in professional and business services continue to be above the private industry average in both the pre- and postpandemic periods, while the layoff rate for information services continues to track the private industry average, with the exception of the last few months where it has shown an uptick.
Taken together, the data paints a mixed picture. There has definitely been softening in information services, with employment contracting, job openings back to their prepandemic rates, quit rates low, and layoffs starting to rise (although the increase has been modest). Employment in finance and insurance remains stable, with no major movement in job opening, quit, or layoff rates. Professional and business services is the only one of the three industries where employment continues to grow and the job opening rate, although declining, remains high. Both the quit rate and the layoff rate are also relatively high. This combination makes it likely that establishments in professional and business services are undergoing a shift in business focus. With employment continuing to increase and job openings and quits remaining high overall, it appears layoffs in the economy are occurring to make room for different workers, not necessarily fewer workers.
Bureau of Labor Statistics, “Occupational Employment and Wage Statistics,” accessed April 12, 2023.
View in ArticleIbid.
View in ArticleBurt Helm, “Can any company be a tech company? Inside the unlikely journey of cult salad brand Sweetgreen,” Inc., May 2019.
View in ArticleUnfortunately, data on the level of employment of specific occupations by individual industries is only available through 2021 and, therefore, does not include the recently announced tech layoffs.
View in ArticleAkrur Barua, The tech workforce is expanding—and changing—as different sectors battle for talent, Deloitte Insights, December 16, 2021.
View in ArticleBLS monthly employment statistics, accessed April 12, 2023.
View in ArticleCover image by: Sofia Sergi