


US Economic Forecast: Volume 3 Issue 1 has been saved

US Economic Forecast: Volume 3 Issue 1
20 March 2015
The fall in oil prices is very important for the US economy. However, other factors will moderate the oil price impact, including a rising dollar, falling US exports, and increasing risk in Europe.
 Economic journalists have had plenty of events to write about recently. There is the amazing drop in the price of oil and gasoline. The new Congress is grappling with the economics and politics of the US budget. Lower gas prices could put as much as $675 in the pockets of the average family this year. Greece had an election that increased tensions in the Eurozone. Low gasoline prices pushed consumer confidence to record levels. Geopolitical problems in Ukraine and the Middle East continued to scare people. And did I mention that US gasoline prices fell to about $2.10 per gallon, a price last seen in early 2009, at the height of the last recession?
You may have noticed a theme. From the point of view of the US economy, the fall in oil prices is very important. The fact remains that, for most Americans, a cheaper primary commodity is a good thing. And for all the activity and noisy debate surrounding fracking/tight oil/unconventional production, the United States remains the world’s largest oil importer. Cheaper oil will help drive energy growth for both of these reasons.
But other factors will moderate the impact of lower oil prices. The dollar has been moving up, and US exports will probably suffer, at least in the near term. Risks, particularly in Europe, have been increasing. Even if that doesn’t make you take a second look at our (still low-probability) recession scenario, it means capital flowing into the United States, which helps to keep the dollar strong. And so far consumers don’t seem to have been spending all those extra dollars—they’ve been saving them. Benjamin Franklin would certainly approve. But it does help limit the positive impact of lower oil prices.
The Deloitte forecast takes these offsetting factors into account. The result is that our near-term forecast for GDP growth in 2015 is not that much larger than our previous forecast. But we admit that consumers will eventually find their way back to stores, or retail websites. Or, if not, consumers will find somebody else willing to exchange their money for more goods and services. And that, in turn, will encourage investment spending offsetting (and even more than offsetting) the negative impact of lower oil prices and the higher dollar on investment in mining and export industries.
Current economic data continue to confirm that Deloitte’s relatively optimistic view is likely. The fundamentals driving our positive view of the US economy remain in place. The baseline scenario shows acceleration in growth, and there is no change in the probabilities assigned to the different scenarios.

Scenarios
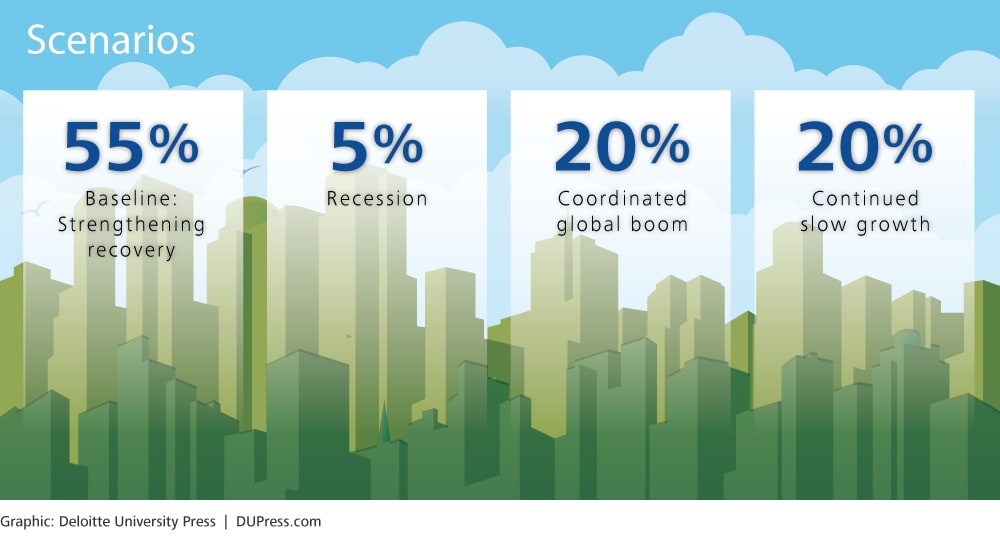
There are plenty of reasons why actual economic growth might be better or worse than Deloitte’s forecasted baseline. The Deloitte forecast, therefore, includes four different scenarios to illustrate possible future paths of the US economy that are worth thinking about. Deloitte’s economic forecasting team places subjective probabilities on each of the scenarios.
The baseline (55 percent): The most likely outcome for the economy is a burst of mildly faster growth as risks from abroad and at home fade away. Continued improvement in the labor market and growing demand from abroad convince business leaders that the economy is really improving. Business investment then contributes, adding to demand. As hiring picks up, the labor force participation rate of younger cohorts will begin to rise. As a result, the large amount of slack will prevent rising demand from being translated into inflation. In October 2014, the US Federal Reserve (Fed) was able to end its monthly asset purchases (quantitative easing) and will begin raising interest rates in July 2015.
Recession (5 percent): Euro problems flare up, and Europe goes back into recession. One or more countries are forced to exit the euro, raising questions about the valuation of euro assets. These questions then affect several US financial institutions that find themselves long on euro assets at the wrong time. The result is a global financial panic. China’s own financial bubble finally catches up with the country, adding to the panic. Chinese and East Asian growth sputter. Capital flows into the United States to avoid risk in Europe and Asia, and the US dollar appreciates. The combination of low foreign demand and financial panic throws the US economy into recession. Timely Fed action offsets the financial crisis after several months, but the impact of low demand, a troubled financial system, and the resulting hit to confidence keep the economy growing slowly. An eventual recovery leads to relatively fast growth several years from now.
Continuing slow growth (20 percent): Weak economic conditions abroad, incomplete fixes to the financial system, and a mismatch between labor needs and the skills of the labor force slow US economic growth to 2 percent for the next few years. Government spending continues to grow much more slowly than the overall economy, and foreign conditions do not improve. As the long-term unemployed become essentially unemployable, the labor force participation rate remains low, and, wages start to rise. The hoped-for improvement in competitiveness from domestic energy production proves to be less impressive than expected. Incipient signs of inflation cause the Fed to raise interest rates to prevent inflation from getting out of hand.
Coordinated global boom (20 percent): European restructuring is successful, and Europe starts recovering quickly. Emerging markets also pick up momentum as financial problems are resolved in China, and India and Brazil start to adopt more reforms. Capital flows out of the United States and into Europe and the developing world, which causes the dollar to depreciate, further enhancing US exports. Lower energy prices in the United States make the country even more competitive. At home, the resolution of budget issues at both the federal and state levels allows more money to flow into infrastructure investment, creating short-term demand and long-term productivity growth. Growth attracts workers back into the labor market, preventing inflation from picking up and allowing the Fed some room to continue to gradually remove quantitative easing without seeing interest rates rise.
What’s been happening?
Oil prices, which had been trending down for some time, suddenly went into something like free fall in December. On December 1, the Brent price was $71 per barrel (as recently as early September, it was over $100 per barrel). By the end of the month, the price was at just $55 per barrel, and by the end of January, $46. Pump prices for gasoline followed crude prices down, with average gasoline prices averaging $2.12 per gallon in January—down from $3.41 in September.
Gasoline prices have an impact beyond the immediate budgetary impact (although, for some consumers, that’s pretty significant). They are an important marker for consumers of how good things are—low prices make consumers happy, and high prices suggest trouble. It’s no coincidence, then, that consumer confidence measures have been rising (some to new records).
The heady consumer confidence has accompanied continued job growth in the 250,000 range. Wage growth is still quite modest, which is as much a problem as a positive—the Fed is unlikely to raise interest rates prematurely on the basis of some wage growth that does not show up in aggregate price measures. And those price measures have been subdued at best.
Oil prices have started picking up a bit, and the Brent price will likely average about $67 per barrel this year. That will moderate the impact of lower prices, but by no means eliminate it. It will cause a pickup in headline inflation later in the year as gasoline prices follow oil prices up. Core inflation will remain very low.
The Fed remains in waiting mode, and that will not likely change until late spring at the earliest. Although economic activity is picking up, there is still plenty of slack in the economy. For now, the central bank appears to be satisfied to rest on the successful conclusion of the quantitative easing program.
The new Congress, however, is running into a rough patch early. Despite assurances from the leadership, political cross-currents appear to have doomed an attempt to fully fund the Department of Homeland Security (DHS, the only agency which was not funded for the full fiscal year). Late DHS funding will have little impact on the agency’s mission or on the broader economy. Some estimates indicate that 85 percent of DHS employees are “essential” and will continue working even without budget authorization. However, the difficulty of funding DHS suggests some risk that Congress will run into trouble raising the debt limit later this year. It also raises some concern that Congress will not be able to pass a budget before the new fiscal year on October 1.
Sectors
Consumers
Ah, the US consumer—long-time supporter of the global economy, and still surprisingly resilient. Of course, consumers can’t spend money they don’t have, and their incomes largely depend on having jobs. As the US economy picks up pace, and as jobs and incomes grow, consumer spending will respond. Just don’t expect US consumers to play Atlas, holding the global economy on their shoulders as they did in the 2000s. Our forecast expects the US saving rate to settle in at about 5.0 percent. This is a good bit higher than in the previous decade, but consistent with consumers’ behavior in the 1990s.
US households actually face some pretty daunting obstacles in their pursuit of the good life. The biggest of these is growing income and wealth inequality. The recent publication of Thomas Pikkety’s book on inequality has created a surprising stir for a 600-plus-page tome on economics, replete with charts and data. For a shorter summary of some of the problems raised in the book, see the Deloitte Review article “Mind the gap,” by Ira Kalish.1 The great interest in the topic suggests that US economic policy debates are likely to focus more on inequality than they did in the past.
Many US consumers spent the 1990s and the 2000s trying to keep up their spending when incomes were stagnant. After all, they kept being assured that technology was transforming the US economy and should be transforming their lives. But now they are wiser (and older, which is another problem as retirements loom without sufficient savings). As long as a large share of the gains from technology and other economic improvements flow to a relatively small number of households, overall US consumer spending is likely to remain relatively restrained.
Consumer news
Real personal consumption expenditures grew 4.3 percent in the fourth quarter. That’s a significant acceleration from the rate of 2.0 percent or so that the economy was experiencing until last year. Real consumption spending fell back in December, led by durable goods. But even services consumption failed to grow. Retail sales—including auto sales—have been weak for two months in a row (December and January) even taking into account the fall in gasoline prices.
Weak spending in December pushed the saving rate up to 4.9 percent in December. Disposable personal income—and employment—have continued growing despite the slowdown in spending. Although it’s nice to see US consumers saving for a change, the historical experience is pretty clear—US households will spend their income gains. That’s why the Deloitte forecast for consumer spending in 2015 remains optimistic.
The oil price drop will help turbocharge consumer spending. We calculate that a sustained decline in gasoline prices to $2.60 per gallon from last year’s $3.60 would cut $675 from a typical household’s expenses over the course of a year. There are 115 million households in the United States, so that adds up to a $70 billion boost to spending for other things. And that doesn’t include the psychological boost that consumers feel when gasoline prices fall—which is considerable.
Gasoline prices and the stronger job market go a long way in explaining why consumer confidence is now at levels last seen before the 2008–2009 recession—and moving up.

Housing
It happens every year. Young people become old enough to leave home and start their own households. But it stopped happening during the recession. The number of households didn’t grow nearly enough to account for all the newly minted young adults. Those young adults would prefer to live on their own and create new households; as the economy recovers, they will do exactly that.
This means some positive fundamentals for housing construction. The United States hasn’t been building as many new housing units as the population would normally require for about seven years, since 2008. In fact, housing construction was hit so hard that the oversupply turned into an undersupply, so there’s a hole that needs to be filled. But the hole isn’t as large as you might think. Several factors offset each other:
- If household size returns to the levels we experienced in the mid-2000s, we would need an additional 3.2 million units.
- On the other hand, household vacancy rates are much higher than normal. If household vacancy returned to normal, an additional 2.5 million units would be available—which would fill 78 percent of the pent-up demand for housing units.
- But are the existing vacant houses in the right place or condition, or are they the right type, for that pent-up demand? The future of housing may look very different than in the past. Growth in new housing construction has been concentrated in multifamily units. If that continues, we may find it is related to the fact that existing single-family units are not needed, despite strong demand for apartments.
Housing credit remains tight and may be a key culprit in keeping individual purchases of single-family houses low. Young adults also seem to be showing a preference for living in urban rather than suburban communities. There may be some significant changes from the post–World War II model of single-family home ownership.
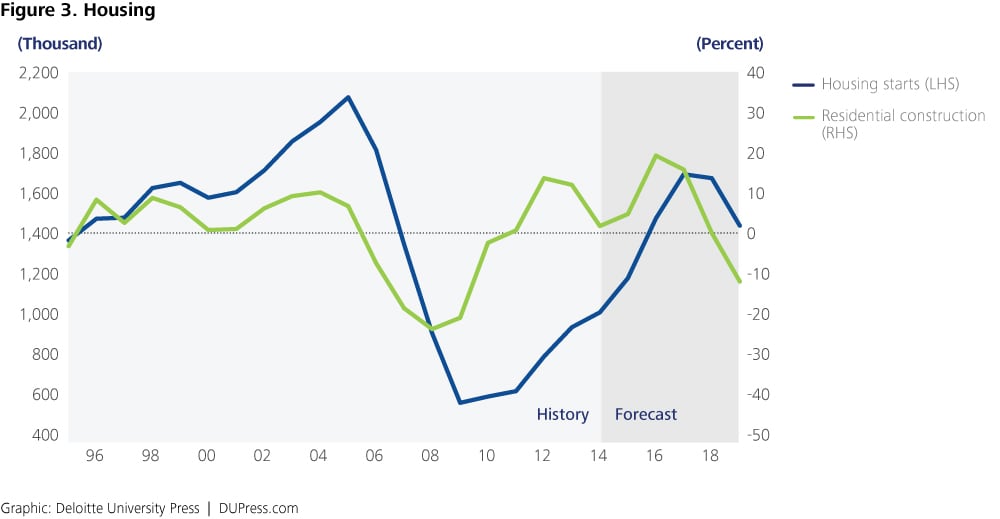
We developed a housing forecast based on these factors. We assumed that the demand for housing (in the form of falling size of the average household) picks up in 2016, vacancy rates gradually drop, and household depreciation starts falling after about 2.5 million housing units are removed from the housing stock. Despite these relatively robust assumptions, slowing population growth suggests that we will have a short-lived housing boom in which starts hit the 1.5–1.6 million level, followed by a period of contraction until starts reach the level of long-run demand. We estimate this to be just 1.2 million units in the medium term. Housing will contribute to growth in 2016 but subtract from growth in 2018 as the pent-up demand goes away. In the long run, the slowing population suggests that housing will not be a growth sector (although specific segments, such as old-age housing, might well be very strong).
Housing news
Housing permits and starts have remained at around 1.05 million units at an annual rate since September. Contract interest rates on conventional home mortgages have been flat for a long time, at just above 4.0 percent. The Case-Shiller home price index fell slightly in each of the four months ending in November 2014.
Housing remains affordable. Financing appears to be a key factor holding the housing market back, leaving construction at a level below that consistent with long-term demand.
Business investment
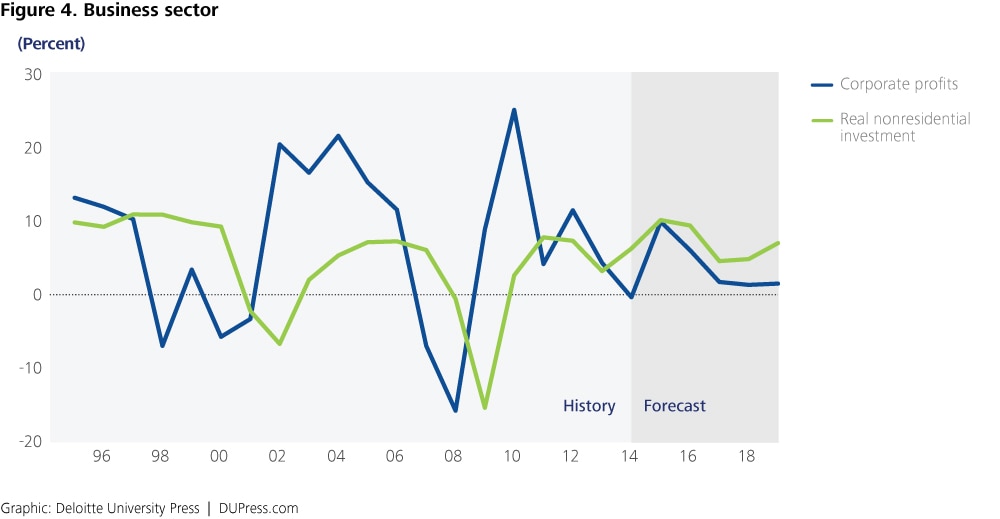
There’s a lot of sad talk about the impact of uncertainty on business decisions. In fact, relative to GDP, business investment was one of the better-performing sectors in this recovery. With strong profit growth, however, businesses might have been expected to invest even more. The reasons for this are complex.2 Many businesses are still waiting for assurance that they will have customers. Once those customers return, there will be more reason to ramp up investment. Watch what businesses do, not what they say.
The fall in oil prices is a complicating factor in this positive outlook. Oil and gas extraction accounted for 6 percent of all nonresidential fixed investment in 2013. That’s a hefty amount (considerably larger than the value-added share of the sector). In the short run, there is likely to be a sudden drop-off in investment as rigs sit idle and the demand for engines, pipes, and the other paraphernalia of oil exploration drops off. It may take a while before the slack is picked up by other industries—the 94 percent of investment that does not depend on oil and gas extraction.
Business investment news
Business fixed investment grew very slowly in the fourth quarter. Equipment investment fell 1.9 percent after rising at over 11 percent for the previous two months. Structures investment grew 2.6 percent, down a bit from the third quarter.
Nondefense capital goods shipments—the best high-frequency measure of equipment spending—were up 0.5 percent in December after falling over 1 percent in each of the previous two months. Some of the volatility was due to aircraft shipments—nondefense capital goods minus aircrafts rose just 0.2 percent in December, but the decline in the previous two months was also much less.
Private nonresidential construction fell in December, for the first time since June. Lodging and commercial structures were behind the December decline, while office construction rose a bit.
Interest rates remained stable. The stock market has continued to rise. The cost of capital remains quite low, and profits are still at near-record levels of national income.
Foreign trade
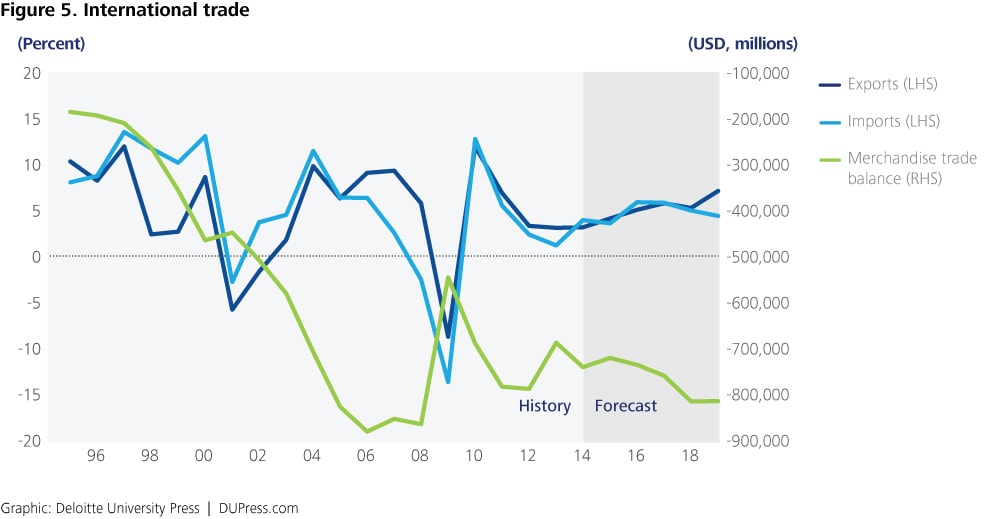
The United States has long had a voracious appetite for foreign goods, and that’s not going to stop. In the forecast, imports accelerate along with GDP growth.
However, exports look to prove a pleasant surprise, though not in the near term, as the dollar is up quite a bit recently—over 10 percent in the past six months. That’s a consequence of the continued desire of investors around the world to hold safe US assets. But the dollar rise also contributes to the possibility of US export growth in the future. Once foreign risks recede, capital will flow out of the United States, and the dollar will fall. The possibility of a depreciating dollar is welcome because a lower dollar could help improve US competitiveness and put capital where it does the most good globally.
A variety of improvements, ranging from the United States’ lead in technology to cheap natural gas, will also help make US manufacturing more competitive with foreign goods.
This forecast assumes that both China and Europe overcome their financial problems and begin to grow again. Growth in these areas represents opportunity for US firms, which we think the firms are ready to take advantage of.
Foreign trade news
The trade balance deteriorated in December. This was mostly because imports rose substantially after falling in November. Exports, however, also fell in December. Petroleum was a large contributor to the rise in imports—despite the price fall, the volume of petroleum imports jumped.
The trade-weighted dollar rose at an average rate of over 2.0 percent per month in December and January. That reflected not only the fall of the euro on the news of Greek elections but also the continued decline of the Canadian dollar and the Mexican peso. Both of the other North American currencies have been depreciating against the dollar as oil prices fall, and together they account for a larger share of trade than the Eurozone. The yen was also appreciating, but it leveled off in January.
There is some good news from Europe, with several countries posting positive industrial production numbers. The most important problem, however, was the election of Greece’s Syriza party. This has led to protracted and difficult talks between Greece and the euro authorities about renegotiating Greece’s financial commitments.
China announced that annual GDP growth in 2014 was 7.4 percent, the lowest rate in 24 years (although slightly higher than in the year ending in the previous quarter). More recent data have been mixed. A slowing China could have a substantial impact on growth on the global economy.
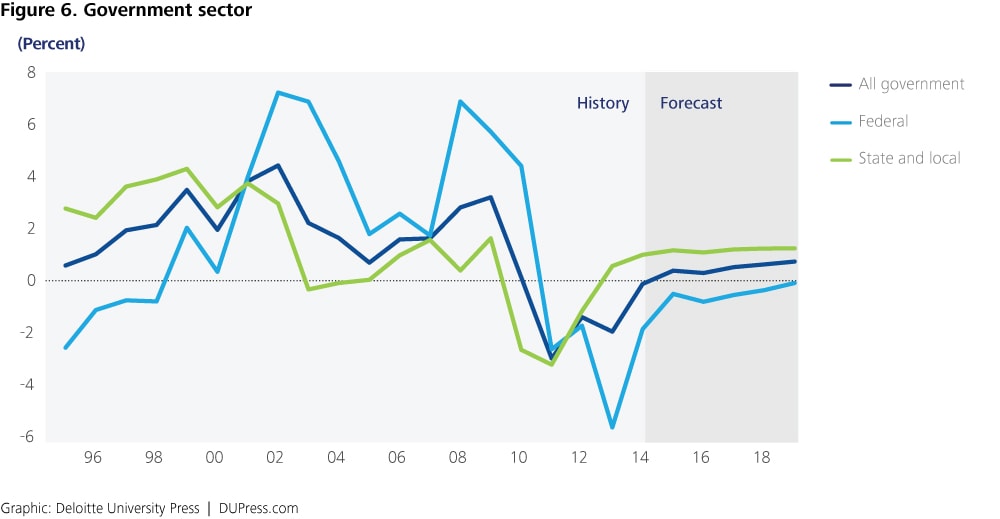
Government
Government spending on goods and services has been stagnant, and our forecast doesn’t see much change in the next few years. At the federal level, it is hard to see Congress and the president agreeing on significant new spending over the next five years. The Republican takeover of the senate suggests that federal spending will remain very constrained over the next two years at least.
State and local governments likely won’t continue to cut spending. They are getting some good news from rising house prices and growing employment. Tax collections are up, and that will remove some of the pressure on their budgets.
But those pesky pension liabilities continue to restrain state and local spending. The Congressional Budget Office estimates that there is a shortfall of $2–3 trillion in state and local pension funding. The need to fund these liabilities is likely to keep the lid on state and local spending growth.
Government news
The federal deficit was about $11 billion higher than the previous year for the first four months of the fiscal year. Although revenues were up $84 billion, outlays were up by more. The two main contributors to the increase in outlays were the Affordable Care Act and a decline in payments to the Treasury by Fannie Mae and Freddie Mac. The decline in Fannie and Freddie payments reflects an unusual one-time payment last year, which will not be repeated. The overall trend continues to be a declining deficit.
Labor markets
If the US economy is going to produce more goods and services, it will need more workers. As long as the labor market is out of balance, the currently moderate wage growth will eventually encourage firms to increase capacity by hiring workers. However, employment growth is more likely to occur in industries such as health care and recreation services than in manufacturing. Accelerating production will carry with it an eventual acceleration in employment—and even a welcome mild acceleration in wages.
But a great many people have been out of work for a long time—long enough that their basic work skills may be eroding. When the labor market tightens up, will those people be employable? Once the employment-to-population ratio starts increasing and labor markets begin to tighten, the long-term damage of the 2007–2009 recession will become measurable.
One unusual feature of the current recovery is the decline in the number of government workers. Government jobs were once thought of as recession-proof, but that’s not the case anymore. There isn’t a lot of desire for increased government spending. As a result, government employment is likely to grow slowly at best in the next few years, which may constrain job growth.
Deloitte labor force projections
This forecast includes an updated projection of the US labor force participation rate. The overall participation rate will be affected by two offsetting trends in the near term. The aging of the population—and in particular, the entrance of early Baby Boom cohorts into retirement age in the next five years—will push the participation rate down. However, participation rates for younger cohorts have fallen substantially because of the poor labor market. The economic improvement in the forecast will almost certainly entice many people in these middle-aged and, especially, younger cohorts to return to the labor market.
The labor force projection in this forecast assumes the following:
- Labor force participation rates for over-60s will remain at current levels.
- Labor force participation rates for under-30s will return to their 1997–2000 average.
- Labor force participation rates for 30–60-year-olds will recover two-thirds of the difference between today’s low levels and the 2002–2007 average.
These assumptions are conservative. Labor force participation rates for older cohorts have actually been trending upward. If this continues, overall labor force participation rates may be higher than projected here. The assumption that about a third of the drop in the middle-aged participation rate is permanent is also conservative. The experience of the late 1990s suggests that tight labor markets might yield higher participation rates than this before overall wages begin to rise.
The Deloitte labor force projection sees the participation rate rising about half a percentage point (from 63.2 percent in 2013 to 63.7 percent in 2019) before starting to decline as most of the latent unemployed reenter the labor market and become employed.
Fed staff and officials are quite aware of the potential for the US labor market to supply many more workers than is evident from the unemployment rate. That is why Fed Chair Janet Yellen has been explaining that the unemployment rate is not the only labor force metric of interest to policymakers. If participation rates show signs of rising in response to tighter labor markets, the Fed may put off tightening for longer than some observers expect.
Labor market news
Initial claims for unemployment insurance have remained around 300,000 since June. Early January saw claims pop up above 300,000 for a few weeks, but this was most likely an artifact of the difficulty of seasonally adjusting a weekly series. This level of claims is consistent with a healthy labor market.
The number of job openings is now higher than at the height of the last recovery. Voluntary quits have also been rising, although they remain below previous levels. Rising quits suggest that workers are becoming more optimistic about the condition of the labor market.
Payroll employment grew by over 1 million jobs in the three months to January. The average growth rate for the past 12 months is over 250,000 per month—an impressive acceleration from last year. The participation rate has stopped falling. If the job market continues to be this strong, we will likely see participation pick up, preventing the unemployment rate from falling much more.

Financial markets
Interest rates are among the most difficult economic variables to forecast because movements depend on news. And if we knew it, it wouldn’t be news. The Deloitte interest-rate forecast is designed to show a path for interest rates consistent with the forecast for the real economy. But the potential risk for different interest-rate movements is higher here than in other parts of our forecast.
The forecast sees both long- and short-term interest rates headed up—maybe not this week, and maybe not this month, but sometime in the future. The forecast shows the economy accelerating this year, and a healthy economy will mean that lending will once again become costly. The forecast moves interest rates back to “normal” levels as economic growth accelerates. That’s not a bad thing—unless returning to normal is bad.
Of course, some investors will be caught short. Those are the people who think that interest rates will remain low forever. Some of those will even be so-called sophisticated investors, so plenty of worried headlines will appear when interest rates go up. Don’t be fooled by what is just a (yes) welcome return to normal.
But the most sophisticated observers of financial markets know the most important thing about interest rates—they will fluctuate. This is the sector that is most likely to surprise us.
This forecast expects the Fed to start raising the funds rate at the Federal Open Market Committee meeting scheduled for July 29–30, 2015. The baseline forecast then assumes that the Fed will continue to raise the rate by 25 basis points at each meeting until it reaches 3.75 percent.
Financial market news
Short-term rates remained flat, while long-term rates dropped a bit in December and January. This was likely a response to capital inflows from investors nervous about the victory of Syriza in Greece. Stock prices rose in November and December, then fell in January. Market price/earning ratios remain not far from the longer-run average.

Prices
Remember those folks who were convinced that the Fed’s actions in 2009 would create runaway inflation? Likely they rather you didn’t. Prices have been the most boring part of forecasting for the past five years, and there is no reason to think that’s going to change.
Inflation is hard to come by when the labor market—which accounts for two-thirds of all costs in the US economy—is so slack. Workers don’t have leverage to obtain higher wages when prices go up, and businesses don’t have the pricing power to cover higher costs. Instead, shocks from higher energy or food prices have just dissipated into the ether rather than being translated into sustained, higher inflation.
That means that inflation will remain tame at least until the economy reaches full employment. With a labor surplus of several million people, that will take a while, even in our forecast. So don’t hold your breath waiting for the return of the 1970s. Bell bottoms, disco, and high inflation are all safely in our past (for now).
Price news
The consumer price index (CPI) fell in November and December, but that was mainly because of the decline in gasoline prices. The core CPI rose only slightly, however. There is little indication of inflationary pressures.
The final demand producer price index (PPI) plunged 1.1 percent in December and 2.1 percent in January. Leaving aside food and energy, the PPI was up, but only about 0.2 percent per month.
Compensation for private sector workers rose 2.4 percent in the fourth quarter on a year-ago basis. This is about the same as in the previous quarter, and still substantially lower than the 3 percent plus rate registered before the financial crisis.

Appendix: Deloitte economic forecast
Table 1. Deloitte US forecast: Baseline
Percent change, year over year unless otherwise noted.
| 2009 | 2010 | 2011 | 2012 | 2013 | 2014 | 2015 | 2016 | 2017 | 2018 | 2019 | |
| History | Forecast | ||||||||||
| GDP components | |||||||||||
| Real GDP | -2.8 | 2.5 | 1.6 | 2.3 | 2.2 | 2.4 | 3.6 | 3.8 | 3.6 | 3 | 2.4 |
| Real consumer spending | -1.6 | 1.9 | 2.3 | 1.8 | 2.4 | 2.5 | 3.3 | 3.3 | 3.5 | 3.5 | 2.4 |
| Real consumer spending, durable goods | -5.5 | 6.1 | 6.1 | 7.3 | 6.7 | 7 | 6.8 | 4.6 | 3.2 | 4.4 | 4.2 |
| Real consumer spending, nondurable goods | -1.8 | 2.2 | 1.8 | 0.8 | 1.9 | 1.8 | 2.7 | 2.5 | 3.1 | 3.1 | 2 |
| Real consumer spending, services | -0.9 | 1.2 | 1.8 | 1.3 | 1.9 | 2 | 2.9 | 3.3 | 3.7 | 3.4 | 2.2 |
| Real investment in private housing | -21.2 | -2.5 | 0.6 | 13.5 | 11.9 | 1.6 | 4.6 | 19.2 | 15.7 | -0.1 | -12.2 |
| Real fixed business investment | -15.6 | 2.5 | 7.7 | 7.2 | 3.1 | 6.1 | 10 | 9.3 | 4.4 | 4.7 | 6.9 |
| Real inventory accumulation | -148 | 58 | 38 | 57 | 64 | 79 | 70 | 56 | 62 | 54 | 46 |
| Real exports of goods and services | -8.8 | 11.9 | 6.9 | 3.3 | 3.1 | 3.1 | 4.1 | 5 | 5.7 | 5.2 | 7.1 |
| Real imports of goods and services | -13.7 | 12.7 | 5.5 | 2.3 | 1.1 | 3.9 | 3.6 | 5.9 | 5.8 | 4.9 | 4.3 |
| Real government consumption and investment | 3.2 | 0.1 | -3 | -1.5 | -2 | -0.2 | 0.3 | 0.2 | 0.5 | 0.6 | 0.7 |
| Real federal government consumption and investment | 5.7 | 4.3 | -2.7 | -1.8 | -5.7 | -1.9 | -0.6 | -0.9 | -0.6 | -0.4 | -0.1 |
| Real state and local government consumption and investment | 1.6 | -2.7 | -3.3 | -1.2 | 0.5 | 0.9 | 1.1 | 1 | 1.1 | 1.2 | 1.2 |
| Prices | |||||||||||
| Consumer price index | -0.3 | 1.6 | 3.1 | 2.1 | 1.5 | 1.6 | 0.9 | 2.1 | 2 | 2.1 | 2.2 |
| Chained price index for personal consumption expenditures | -0.1 | 1.7 | 2.5 | 1.8 | 1.2 | 1.3 | 0.8 | 1.9 | 1.8 | 1.9 | 1.9 |
| Chained GDP price index | 0.8 | 1.2 | 2.1 | 1.8 | 1.5 | 1.4 | 1.2 | 2.5 | 2.1 | 1.9 | 1.9 |
| Employment cost index | 1.7 | 1.9 | 2 | 1.9 | 1.9 | 2.1 | 3.3 | 3.6 | 3.6 | 3.8 | 4.3 |
| Labor markets | |||||||||||
| Average monthly change in employment | -468 | 65 | 165 | 184 | 205 | 245 | 174 | 130 | 119 | 102 | 28 |
| Unemployment rate (percent) | 9.3 | 9.6 | 8.9 | 8.1 | 7.4 | 6.2 | 5.5 | 5.4 | 5.5 | 5.6 | 5.6 |
| Employment-to-population (percent) | 59.3 | 58.5 | 58.4 | 58.6 | 58.6 | 59 | 59.5 | 59.7 | 59.7 | 59.7 | 59.2 |
| Income and wealth | |||||||||||
| Real disposable personal income | -0.4 | 1 | 2.5 | 3 | -0.2 | 2.4 | 3 | 3.5 | 3.8 | 3 | 2.3 |
| Net household wealth ($ trillions) | 58 | 62 | 64 | 70 | 79 | 85 | 98 | 104 | 112 | 122 | 134 |
| Personal saving rate (percent of disposable income) | 6.1 | 5.6 | 6 | 7.2 | 4.9 | 4.8 | 4.6 | 4.9 | 5.2 | 4.8 | 4.8 |
| After-tax corporate profits with corporate profits with inventory valuation and capital consumption adjustments | 8.7 | 25 | 4 | 11.4 | 4.2 | -0.5 | 9.8 | 5.9 | 1.6 | 1.2 | 1.4 |
| Housing | |||||||||||
| Housing starts (thousands) | 554 | 586 | 612 | 784 | 930 | 1,004 | 1,174 | 1,471 | 1,691 | 1,671 | 1,434 |
| Stock of owner occupied homes (millions) | 131 | 132 | 132 | 132 | 133 | 133 | 134 | 135 | 136 | 138 | 139 |
| Interest rate on 30-year fixed-rate mortgages (percent) | 5.04 | 4.69 | 4.46 | 3.66 | 3.98 | 4.17 | 3.88 | 5.21 | 6.66 | 6.89 | 6.8 |
| Foreign trade | |||||||||||
| Current account balance, share of GDP (percent) | -2.6 | -3 | -3 | -2.9 | -2.4 | -2.4 | -1.9 | -1.8 | -2 | -2.3 | -2.2 |
| Merchandise trade balance ($ billions) | -547 | -691 | -784 | -789 | -689 | -742 | -722 | -737 | -760 | -816 | -816 |
| Relative unit labor costs (Index, 2008=100) | 105.6 | 96.6 | 90.1 | 88.7 | 84.9 | 84.2 | 89.6 | 89.8 | 88.1 | 86.5 | 84.7 |
| Financial | |||||||||||
| Federal funds rate (percent) | 0.13 | 0.13 | 0.13 | 0.13 | 0.13 | 0.13 | 0.72 | 2.73 | 3.75 | 3.75 | 3.75 |
| Yield on 10-year treasury note (percent) | 3.46 | 2.86 | 2.05 | 1.71 | 2.75 | 2.28 | 2.2 | 3.96 | 4.65 | 4.6 | 4.37 |
| Government | |||||||||||
| Federal budget balance, unified basis (share of GDP, percent) | -8.7 | -8.9 | -8.5 | -7.3 | -4.3 | -2.9 | -2.6 | -2.2 | -2.2 | -2.5 | -2.8 |
| Sources: Historical data: US government agencies and Oxford Economics. Forecast: Deloitte, using the Oxford Global Economic Model. | |||||||||||
Table 2. Coordinated global recovery
Percent change, year over year unless otherwise noted.
| 2009 | 2010 | 2011 | 2012 | 2013 | 2014 | 2015 | 2016 | 2017 | 2018 | 2019 | |
| History | Forecast | ||||||||||
| GDP components | |||||||||||
| Real GDP | -2.8 | 2.5 | 1.6 | 2.3 | 2.2 | 2.4 | 3.9 | 4.6 | 4.2 | 4 | 3.8 |
| Real consumer spending | -1.6 | 1.9 | 2.3 | 1.8 | 2.4 | 2.5 | 3.5 | 3.3 | 3.8 | 3.7 | 3.3 |
| Real consumer spending, durable goods | -5.5 | 6.1 | 6.1 | 7.3 | 6.7 | 7 | 6.8 | 4.8 | 3.6 | 5 | 4.9 |
| Real consumer spending, nondurable goods | -1.8 | 2.2 | 1.8 | 0.8 | 1.9 | 1.8 | 3 | 2.6 | 3.3 | 3.4 | 3 |
| Real consumer spending, services | -0.9 | 1.2 | 1.8 | 1.3 | 1.9 | 2 | 3.2 | 3.3 | 4 | 3.6 | 3.1 |
| Real investment in private housing | -21.2 | -2.5 | 0.6 | 13.5 | 11.9 | 1.6 | 4.7 | 20 | 16.4 | 0.5 | -11.3 |
| Real fixed business investment | -15.6 | 2.5 | 7.7 | 7.2 | 3.1 | 6.1 | 12 | 15.5 | 8 | 9.4 | 11.7 |
| Real inventory accumulation | -148 | 58 | 38 | 57 | 64 | 79 | 71 | 74 | 76 | 76 | 76 |
| Real exports of goods and services | -8.8 | 11.9 | 6.9 | 3.3 | 3.1 | 3.1 | 5.3 | 5.4 | 5.7 | 6.5 | 7 |
| Real imports of goods and services | -13.7 | 12.7 | 5.5 | 2.3 | 1.1 | 3.9 | 5.7 | 7.1 | 6.4 | 5.9 | 5.3 |
| Real government consumption and investment | 3.2 | 0.1 | -3 | -1.5 | -2 | -0.2 | 0.3 | 0.2 | 0.5 | 0.6 | 0.7 |
| Real federal government consumption and investment | 5.7 | 4.3 | -2.7 | -1.8 | -5.7 | -1.9 | -0.6 | -0.9 | -0.6 | -0.4 | -0.1 |
| Real state and local government consumption and investment | 1.6 | -2.7 | -3.3 | -1.2 | 0.5 | 0.9 | 1.1 | 1 | 1.1 | 1.2 | 1.2 |
| Prices | |||||||||||
| Consumer price index | -0.3 | 1.6 | 3.1 | 2.1 | 1.5 | 1.6 | 0.9 | 2 | 1.9 | 2.1 | 2.1 |
| Chained price index for personal consumption expenditures | -0.1 | 1.7 | 2.5 | 1.8 | 1.2 | 1.3 | 0.8 | 1.8 | 1.7 | 1.8 | 1.8 |
| Chained GDP price index | 0.8 | 1.2 | 2.1 | 1.8 | 1.5 | 1.4 | 1.2 | 2.4 | 2 | 1.8 | 1.8 |
| Employment cost index | 1.7 | 1.9 | 2 | 1.9 | 1.9 | 2.1 | 3.4 | 4 | 4 | 4.3 | 4.7 |
| Labor markets | |||||||||||
| Average monthly change in employment | -468 | 65 | 165 | 184 | 205 | 245 | 174 | 160 | 155 | 123 | 45 |
| Unemployment rate (percent) | 9.3 | 9.6 | 8.9 | 8.1 | 7.4 | 6.2 | 5.5 | 5.2 | 5 | 4.9 | 4.8 |
| Employment-to-population (percent) | 59.3 | 58.5 | 58.4 | 58.6 | 58.6 | 59 | 59.5 | 59.8 | 60 | 60.1 | 59.7 |
| Income and wealth | |||||||||||
| Real disposable personal income | -0.4 | 1 | 2.5 | 3 | -0.2 | 2.4 | 3.1 | 4 | 4.1 | 3.6 | 3.1 |
| Net household wealth ($ trillions) | 58 | 62 | 64 | 70 | 79 | 85 | 98 | 105 | 114 | 126 | 142 |
| Personal saving rate (percent of disposable income) | 6.1 | 5.6 | 6 | 7.2 | 4.9 | 4.8 | 4.4 | 5.1 | 5.6 | 5.5 | 5.4 |
| After-tax corporate profits with corporate profits with inventory valuation and capital consumption adjustments | 8.7 | 25 | 4 | 11.4 | 4.2 | -0.5 | 11.2 | 7.6 | 1.9 | 3.3 | 4.5 |
| Housing | |||||||||||
| Housing starts (thousands) | 554 | 586 | 612 | 784 | 930 | 1,004 | 1,175 | 1,482 | 1,715 | 1,705 | 1,478 |
| Stock of owner-occupied homes (millions) | 131 | 132 | 132 | 132 | 133 | 133 | 134 | 135 | 136 | 138 | 139 |
| Interest rate on 30-year fixed-rate mortgages (percent) | 5.04 | 4.69 | 4.46 | 3.66 | 3.98 | 4.17 | 3.88 | 5.19 | 6.62 | 6.86 | 6.74 |
| Foreign trade | |||||||||||
| Current account balance, share of GDP (percent) | -2.6 | -3 | -3 | -2.9 | -2.4 | -2.4 | -2 | -2.1 | -2.4 | -2.6 | -2.7 |
| Merchandise trade balance ($ billions) | -547 | -691 | -784 | -789 | -689 | -742 | -751 | -788 | -834 | -888 | -926 |
| Relative unit labor costs (Index, 2008=100) | 105.6 | 96.6 | 90.1 | 88.7 | 84.9 | 84.2 | 89.4 | 89.6 | 87.8 | 86 | 83.9 |
| Financial | |||||||||||
| Federal funds rate (percent) | 0.13 | 0.13 | 0.13 | 0.13 | 0.13 | 0.13 | 0.72 | 2.73 | 3.75 | 3.75 | 3.75 |
| Yield on 10-year treasury note (percent) | 3.46 | 2.86 | 2.05 | 1.71 | 2.75 | 2.28 | 2.19 | 3.96 | 4.63 | 4.57 | 4.31 |
| Government | |||||||||||
| Federal budget balance, unified basis (share of GDP, percent) | -8.7 | -8.9 | -8.5 | -7.3 | -4.3 | -2.9 | -2.6 | -2 | -1.9 | -1.9 | -2 |
| Sources: Historical data: US government agencies and Oxford Economics. Forecast: Deloitte, using the Oxford Global Economic Model. | |||||||||||
Table 3. Recession
Percent change, year over year unless otherwise noted.
| 2009 | 2010 | 2011 | 2012 | 2013 | 2014 | 2015 | 2016 | 2017 | 2018 | 2019 | |
| History | Forecast | ||||||||||
| GDP components | |||||||||||
| Real GDP | -2.8 | 2.5 | 1.6 | 2.3 | 2.2 | 2.4 | 1.5 | 0.6 | 6.5 | 4 | 2.2 |
| Real consumer spending | -1.6 | 1.9 | 2.3 | 1.8 | 2.4 | 2.5 | 1.3 | 1.7 | 5.5 | 3.5 | 1.9 |
| Real consumer spending, durable goods | -5.5 | 6.1 | 6.1 | 7.3 | 6.7 | 7 | 6.8 | 4.8 | 2.6 | 3.3 | 4 |
| Real consumer spending, nondurable goods | -1.8 | 2.2 | 1.8 | 0.8 | 1.9 | 1.8 | 0.5 | 0.7 | 5.4 | 3.3 | 1.5 |
| Real consumer spending, services | -0.9 | 1.2 | 1.8 | 1.3 | 1.9 | 2 | 0.7 | 1.5 | 6 | 3.6 | 1.7 |
| Real investment in private housing | -21.2 | -2.5 | 0.6 | 13.5 | 11.9 | 1.6 | -13.3 | 2.2 | 55.5 | 11.6 | -19.6 |
| Real fixed business investment | -15.6 | 2.5 | 7.7 | 7.2 | 3.1 | 6.1 | 4.1 | -3.9 | 13.6 | 15 | 13.6 |
| Real inventory accumulation | -148 | 58 | 38 | 57 | 64 | 79 | 45 | -22 | 94 | 83 | 47 |
| Real exports of goods and services | -8.8 | 11.9 | 6.9 | 3.3 | 3.1 | 3.1 | 3.8 | 4.7 | 6.8 | 5.8 | 7.4 |
| Real imports of goods and services | -13.7 | 12.7 | 5.5 | 2.3 | 1.1 | 3.9 | -0.8 | 2.7 | 15.7 | 9.8 | 6.4 |
| Real government consumption and investment | 3.2 | 0.1 | -3 | -1.5 | -2 | -0.2 | 0.3 | 0.2 | 0.5 | 0.6 | 0.7 |
| Real federal government consumption and investment | 5.7 | 4.3 | -2.7 | -1.8 | -5.7 | -1.9 | -0.6 | -0.9 | -0.6 | -0.4 | -0.1 |
| Real state and local government consumption and investment | 1.6 | -2.7 | -3.3 | -1.2 | 0.5 | 0.9 | 1.1 | 1 | 1.2 | 1.2 | 1.2 |
| Prices | |||||||||||
| Consumer price index | -0.3 | 1.6 | 3.1 | 2.1 | 1.5 | 1.6 | 0.9 | 1.6 | 0.5 | 1.3 | 1.6 |
| Chained price index for personal consumption expenditures | -0.1 | 1.7 | 2.5 | 1.8 | 1.2 | 1.3 | 0.8 | 1.4 | 0.3 | 1.1 | 1.4 |
| Chained GDP price index | 0.8 | 1.2 | 2.1 | 1.8 | 1.5 | 1.4 | 1.2 | 2.4 | 0.6 | 0.1 | 1.1 |
| Employment cost index | 1.7 | 1.9 | 2 | 1.9 | 1.9 | 2.1 | 3.2 | 2.6 | 4.3 | 3.4 | 3 |
| Labor markets | |||||||||||
| Average monthly change in employment | -468 | 65 | 165 | 184 | 205 | 245 | -81 | 121 | 309 | 163 | 32 |
| Unemployment rate (percent) | 9.3 | 9.6 | 8.9 | 8.1 | 7.4 | 6.2 | 6.3 | 7.7 | 6.3 | 5.5 | 5.3 |
| Employment-to-population (percent) | 59.3 | 58.5 | 58.4 | 58.6 | 58.6 | 59 | 59 | 58.2 | 58.9 | 59.5 | 59.2 |
| Income and wealth | |||||||||||
| Real disposable personal income | -0.4 | 1 | 2.5 | 3 | -0.2 | 2.4 | 2.4 | 1.6 | 5 | 3.3 | 1.9 |
| Net household wealth ($ trillions) | 58 | 62 | 64 | 70 | 79 | 85 | 71 | 110 | 111 | 118 | 125 |
| Personal saving rate (percent of disposable income) | 6.1 | 5.6 | 6 | 7.2 | 4.9 | 4.8 | 5.7 | 5.7 | 5.3 | 5.1 | 5.2 |
| After-tax corporate profits with corporate profits with inventory valuation and capital consumption adjustments | 8.7 | 25 | 4 | 11.4 | 4.2 | -0.5 | 0.8 | 2 | 11.1 | -1.1 | -0.7 |
| Housing | |||||||||||
| Housing starts (thousands) | 554 | 586 | 612 | 784 | 930 | 1,004 | 968 | 1,045 | 1,614 | 1,782 | 1,401 |
| Stock of owner-occupied homes (millions) | 131 | 132 | 132 | 132 | 133 | 133 | 134 | 134 | 135 | 137 | 138 |
| Interest rate on 30-year fixed-rate mortgages (percent) | 5.04 | 4.69 | 4.46 | 3.66 | 3.98 | 4.17 | 4.06 | 3.43 | 4.25 | 5.86 | 6.34 |
| Foreign trade | |||||||||||
| Current account balance, share of GDP (percent) | -2.6 | -3 | -3 | -2.9 | -2.4 | -2.4 | -1.3 | -0.9 | -1.4 | -1.8 | -2.1 |
| Merchandise trade balance ($ billions) | -547 | -691 | -784 | -789 | -689 | -742 | -626 | -548 | -771 | -1,004 | -1,112 |
| Relative unit labor costs (Index, 2008=100) | 105.6 | 96.6 | 90.1 | 88.7 | 84.9 | 84.2 | 90.4 | 89.8 | 86.2 | 84 | 81.6 |
| Financial | |||||||||||
| Federal funds rate (percent) | 0.13 | 0.13 | 0.13 | 0.13 | 0.13 | 0.13 | 0.09 | 0.09 | 2.19 | 3.19 | 3.31 |
| Yield on 10-year treasury note (percent) | 3.46 | 2.86 | 2.05 | 1.71 | 2.75 | 2.28 | 1.88 | 1.63 | 2.82 | 3.86 | 3.89 |
| Government | |||||||||||
| Federal budget balance, unified basis (share of GDP, percent) | -8.7 | -8.9 | -8.5 | -7.3 | -4.3 | -2.9 | -2.9 | -3.6 | -3 | -2.7 | -3 |
| Sources: Historical data: US government agencies and Oxford Economics. Forecast: Deloitte, using the Oxford Global Economic Model. | |||||||||||
Table 4. Continued slow growth
Percent change, year over year unless otherwise noted.
| 2009 | 2010 | 2011 | 2012 | 2013 | 2014 | 2015 | 2016 | 2017 | 2018 | 2019 | |
| History | Forecast | ||||||||||
| GDP components | |||||||||||
| Real GDP | -2.8 | 2.5 | 1.6 | 2.3 | 2.2 | 2.4 | 2.5 | 2.1 | 2.2 | 2 | 2 |
| Real consumer spending | -1.6 | 1.9 | 2.3 | 1.8 | 2.4 | 2.5 | 2.4 | 2.1 | 2.3 | 2.2 | 2.1 |
| Real consumer spending, durable goods | -5.5 | 6.1 | 6.1 | 7.3 | 6.7 | 7 | 6.9 | 5.9 | 3.5 | 3.6 | 3.4 |
| Real consumer spending, nondurable goods | -1.8 | 2.2 | 1.8 | 0.8 | 1.9 | 1.8 | 1.7 | 1 | 1.6 | 1.8 | 1.8 |
| Real consumer spending, services | -0.9 | 1.2 | 1.8 | 1.3 | 1.9 | 2 | 1.9 | 1.9 | 2.3 | 2.1 | 1.9 |
| Real investment in private housing | -21.2 | -2.5 | 0.6 | 13.5 | 11.9 | 1.6 | 4.2 | 12 | 8.8 | -1.9 | -13.4 |
| Real fixed business investment | -15.6 | 2.5 | 7.7 | 7.2 | 3.1 | 6.1 | 4.8 | 4.2 | 4.6 | 6.2 | 8.3 |
| Real inventory accumulation | -148 | 58 | 38 | 57 | 64 | 79 | 53 | 22 | 28 | 27 | 30 |
| Real exports of goods and services | -8.8 | 11.9 | 6.9 | 3.3 | 3.1 | 3.1 | 3.9 | 3.5 | 3.4 | 3.2 | 4.4 |
| Real imports of goods and services | -13.7 | 12.7 | 5.5 | 2.3 | 1.1 | 3.9 | 1.5 | 4 | 5.7 | 5.1 | 5.3 |
| Real government consumption and investment | 3.2 | 0.1 | -3 | -1.5 | -2 | -0.2 | 0.3 | 0.1 | 0.4 | 0.7 | 0.8 |
| Real federal government consumption and investment | 5.7 | 4.3 | -2.7 | -1.8 | -5.7 | -1.9 | -0.6 | -1.2 | -1.2 | -0.4 | 0.1 |
| Real state and local government consumption and investment | 1.6 | -2.7 | -3.3 | -1.2 | 0.5 | 0.9 | 1.1 | 0.9 | 0.9 | 1.1 | 1.2 |
| Prices | |||||||||||
| Consumer price index | -0.3 | 1.6 | 3.1 | 2.1 | 1.5 | 1.6 | 1.1 | 2.4 | 2.1 | 2.2 | 2.2 |
| Chained price index for personal consumption expenditures | -0.1 | 1.7 | 2.5 | 1.8 | 1.2 | 1.3 | 1 | 2.2 | 1.9 | 1.9 | 2 |
| Chained GDP price index | 0.8 | 1.2 | 2.1 | 1.8 | 1.5 | 1.4 | 1.5 | 3 | 2.4 | 2 | 2 |
| Employment cost index | 1.7 | 1.9 | 2 | 1.9 | 1.9 | 2.1 | 2.9 | 2.9 | 3 | 3 | 3.2 |
| Labor markets | |||||||||||
| Average monthly change in employment | -468 | 65 | 165 | 184 | 205 | 245 | 121 | 115 | 100 | 97 | 92 |
| Unemployment rate (percent) | 9.3 | 9.6 | 8.9 | 8.1 | 7.4 | 6.2 | 5.7 | 5.7 | 5.6 | 5.7 | 5.7 |
| Employment-to-population (percent) | 59.3 | 58.5 | 58.4 | 58.6 | 58.6 | 59 | 59.4 | 59.4 | 59.2 | 59.1 | 59 |
| Income and wealth | |||||||||||
| Real disposable personal income | -0.4 | 1 | 2.5 | 3 | -0.2 | 2.4 | 2.5 | 2.4 | 2.7 | 2.3 | 2 |
| Net household wealth ($ trillions) | 58 | 62 | 64 | 70 | 79 | 85 | 99 | 109 | 117 | 126 | 137 |
| Personal saving rate (percent of disposable income) | 6.1 | 5.6 | 6 | 7.2 | 4.9 | 4.8 | 5 | 5.3 | 5.8 | 5.9 | 5.9 |
| After-tax corporate profits with corporate profits with inventory valuation and capital consumption adjustments | 8.7 | 25 | 4 | 11.4 | 4.2 | -0.5 | 6.2 | 2.4 | -0.3 | 0.6 | 0.7 |
| Housing | |||||||||||
| Housing starts (thousands) | 554 | 586 | 612 | 784 | 930 | 1,004 | 1,169 | 1,376 | 1,488 | 1,443 | 1,222 |
| Stock of owner-occupied homes (millions) | 131 | 132 | 132 | 132 | 133 | 133 | 134 | 135 | 136 | 137 | 138 |
| Interest rate on 30-year fixed-rate mortgages (percent) | 5.04 | 4.69 | 4.46 | 3.66 | 3.98 | 4.17 | 3.85 | 3.95 | 4.85 | 5.16 | 5.25 |
| Foreign trade | |||||||||||
| Current account balance, share of GDP (percent) | -2.6 | -3 | -3 | -2.9 | -2.4 | -2.4 | -1.6 | -1.4 | -1.4 | -1.7 | -1.9 |
| Merchandise trade balance ($ billions) | -547 | -691 | -784 | -789 | -689 | -742 | -676 | -669 | -713 | -786 | -859 |
| Relative unit labor costs (Index, 2008=100) | 105.6 | 96.6 | 90.1 | 88.7 | 84.9 | 84.2 | 90.1 | 91.1 | 89.6 | 87.9 | 86.4 |
| Financial | |||||||||||
| Federal funds rate (percent) | 0.13 | 0.13 | 0.13 | 0.13 | 0.13 | 0.13 | 0.25 | 1.11 | 1.9 | 2.07 | 2.24 |
| Yield on 10-year treasury note (percent) | 3.46 | 2.86 | 2.05 | 1.71 | 2.75 | 2.28 | 1.98 | 2.42 | 2.76 | 2.89 | 2.84 |
| Government | |||||||||||
| Federal budget balance, unified basis (share of GDP, percent) | -8.7 | -8.9 | -8.5 | -7.3 | -4.3 | -2.9 | -2.8 | -2.6 | -2.7 | -3 | -3.5 |
| Sources: Historical data: US government agencies and Oxford Economics. Forecast: Deloitte, using the Oxford Global Economic Model. | |||||||||||