Digital media trends: A look beyond generations Redrawing battle lines in the video streaming war
14 minute read
30 October 2019
 Kevin Westcott United States
 Jeff Loucks United States
 David Ciampa United States
 Shashank Srivastava India
As the streaming war fires up the direct-to-consumer space and subscription fatigue sets in, providers should take a long view of what consumers want. A model that offers both ad-free and ad-supported services may be the key.
If anyone needed convincing that the video streaming war is heating up in the United States, a few events over an action-packed summer erased any doubt. A Hollywood studio announced plans to launch a global direct-to-consumer (DTC) streaming service; a smartphone manufacturer is making one of the most expensive TV shows in history;1 and, amid intensifying competition, the leading streaming video service lost subscribers for the first time in many years.
Learn more
View more from the Digital media trends survey, 13th edition
Explore the Telecom, media & entertainment collection
Subscribe to receive related content from Deloitte Insights
Download the Deloitte Insights and Dow Jones app
Even as the traditional TV ecosystem continues to lose subscribers, more and more studios, TV networks, and high-profile media companies are launching DTC video streaming services in an already saturated market. More than 300 such services are vying for their share of attention (and their wallet), with the average consumer subscribing to three subscriptions. For media companies that are going “direct”—or have already made the leap—billions of dollars are at stake due to transformational shifts in content distribution.2 But if they don’t get it right, the very existence of their DTC services could conceivably be at risk, given there’s not enough room for all 300-plus players. A relative handful are likely to thrive, while many might vanish or retreat into a niche.
In the immediate term, as the video streaming war intensifies, the fight for acquiring customers is becoming fierce among technology, media, and telecom (TMT) industry giants, who’re all trying to get consumers to add their service among a burgeoning collection of streaming services. Looking ahead, as the streaming war moves into its next phase—scaling up and monetizing the subscriber base—media and entertainment (M&E) companies should know their potential customers better than ever before. Some consumers are receptive to ad-supported video services. Others want an ad-free experience and are willing to pay for it. Some consumers want maximum choice and availability, and care more about convenience than price. Other savvy consumers deftly switch from one special offer to another, cancel services when their favorite series ends, and work the angles to watch as much as they can for as little as possible.
As service providers consider which streaming models to adopt—subscription; ad-supported; hybrid; aggregation; original content; video bundled with connectivity, music, and gaming—they should understand how many customers they’ll attract, and how many they’ll potentially lose with each one. More importantly, they should recognize the opportunity to tailor multiple offerings, or multiple tiers of the same offering, to consumers based on their behaviors. They also should find ways to battle subscription fatigue, which is spiraling along with the number of subscriptions per consumer and time spent streaming among digital media segments.
M&E companies should recognize the opportunity to tailor multiple offerings, or multiple tiers of the same offering, to consumers based on their behaviors.
As Deloitte showed in its 2018 study, Digital media segments: Looking beyond generations, M&E companies can look beyond generations to see how different consumers behave in different ways and are attracted to different services. Our five multidimensional behavior profiles offered companies a new way to classify and more effectively target customers. In our digital media segments analysis, we use data from Deloitte’s 2019 Digital media trends survey, 13th edition to show how the behavior of these segments has evolved, and what this means for M&E companies that are courting them. As we’ll see, the differentiating traits of each segment are deepening. What succeeds with one media segment may fail with another, and customer analysis, segmentation, and targeting will likely be the keys to success. In fact, consumers themselves may demand more diversity in streaming offerings than major players have planned or expect.
What succeeds with one media segment may fail with another, and customer analysis, segmentation, and targeting will likely be the keys to success.
Video streaming in the United States and elsewhere
In the United States, the dominant model for video streaming services is one in which subscribers pay a monthly fee to watch TV shows and movies free of ads. So, the fight isn’t just for consumers’ eyeballs; it’s for a monthly subscription that creates recurring revenue for the provider. This escalates the cost for consumers, who should balance their voracious demand for video content with economic realities that limit the number of services they can pay for. As seen in our Digital media trends survey, 13th edition, video isn’t the only entertainment service consumers subscribe to: Music and gaming are popular as well, especially among Generation Z and millennials. And while pay TV may be declining, it still attracts a sizable number of viewers for its live sports and news content. As a result, 43 percent of consumers have both a pay TV and a video streaming subscription.
Besides, the “subscription-ization” of nearly every imaginable product—exercise bikes, men’s razors, cosmetics, clothes, pet food, prepared meals—means that consumers should now weigh the importance of entertainment services against staples and competing leisure activities. Banks are launching credit cards that specialize in ferreting out underused subscriptions, so consumers can free up cash.
In the United States, ad-supported video streaming services may have taken a back seat to subscription-based, ad-free video services. However, in other parts of the world, such as Asia, ad-supported video services dominate. iQiyi and Tencent Video in China boast more than 500 million monthly average users (MAU), attracting them with free content, and reserving premium shows, movies, and sports for subscribers. Hotstar in India follows the same model and has attracted 300 million users since launching in 2014. Free, ad-supported content enabled these services to scale quickly to hundreds of millions of users and generate revenue from consumers who can’t—or won’t—pay a fee. But ad-supported video is ramping up in the United States as well, with about 70 percent of Hulu’s subscribers accepting ads to help defray their monthly costs, and free, ad-supported services such as Roku and Pluto TV reaching millions of MAUs.
Digital media segments: What consumers want
Given the rising competition and consumer complexity in the sector, we revisited the media segments this year to see how they have developed in their choice of providers and viewing habits. Some of the traits and patterns that defined these segments have intensified in this year’s survey results. In particular, behavioral trends related to preferred device and content viewing platforms (such as mobile, tablet, and TV) have persisted and strengthened across the five media segments. Here’s how:
Behavior trends related to preferred device and content viewing platform—mobile, tablet, TV, etc.—have persisted and strengthened in this year’s survey.
Mobile-first viewers (MVs): These are on-the-go streamers who want music and gaming with their video. The mobile consumption behavior of this segment grew this year. Mobile-first viewers spend more than half their TV viewing time on a mobile device (smartphone, tablet, or laptop); most notably, smartphone makes up 30 percent of viewing time, up 5 percentage points from last year, and is No. 1 among all segments. Streaming video and mobile data plan penetration for MV households surpassed home internet in terms of penetration. Close to 80 percent of MVs have all three subscriptions (home internet, mobile data, and streaming video). Around 70 percent of their weekly video consumption is through streaming. On average, they have three video streaming subscriptions. They spend 46 percent of their streaming time on paid streaming and 30 percent on free streaming services. More than half subscribe to a music streaming service as well. The segment continues to have the highest concentration of gamers—close to 80 percent play video games at least once in a month, while about half subscribe to a gaming service. About 39 percent watch esports on a weekly basis as well.
Mobile-first viewers at a glance
On-demand and on-the-go consumers who live by their smartphones
- Size: 19 percent of market (+1 percent year-over-year)
- Mean age: 33 years
- Mean household income: US$63,900
- Generational profile: Gen Z: 20 percent; millennials: 42 percent; Gen X: 30 percent; boomers: 7 percent; matures: 1 percent
- Favorite genre: Movies
- Favorite device: Smartphone
- On-the-go: More than 50 percent of viewing happens through mobile devices
Power streamers (PSs): These are lean-back viewers who avidly stream video on bigger screens in the comfort of their living rooms; they don’t mind paying a premium for an ad-free experience. Over the past year, power streamers have become even more enamored of streaming video and watching it on a bigger screen. The proportion of time they streamed paid videos grew to 63 percent this year (from 56 percent last year). They spend only 20 percent of their streaming time on free platforms, the lowest among all segments. In addition, PSs spend close to 80 percent of their long-form content (TV/movie) viewing time on flat-panel TVs. More than 60 percent of their weekly video content consumption happens on streaming platforms. Fifty-six percent of them watch more than 10 hours of streaming videos per week, highest among all the segments.
Their aversion to advertising has increased, with a third of PSs deeming the “fair amount” of advertising to be three minutes or less. Interestingly, despite this group’s “ad-lergic-ness,” it does respond favorably to product placement and prefers it to any other marketing ploy.
Power streamers at a glance
Lean-back viewers preferring to pay for an ad-free experience
- Size: 20 percent of market (+2 percent year-over-year)
- Mean age: 46 years
- Mean household income: US$66,900
- Generational profile: Gen Z: 8 percent; millennials: 25 percent; Gen X: 28 percent; boomers: 33 percent; matures: 6 percent
- Favorite device: Flat-panel TV
- Favorite service: Streaming video
- Ad-lergic-ness: Won’t consider watching content if there is more than 15 minutes of advertising per hour
Highly subscribed (HS): They use multiple services to enjoy uninterrupted content access. Highly subscribed consumers continued to invest in multiple subscriptions. More than 90 percent have both pay TV and a video streaming subscription, 10 percentage points above last year’s figure. On an average, HS consumers pay for 11 subscriptions (including live TV streaming services). Close to 80 percent of HS subscribe to a music streaming service, while more than 60 percent subscribe to a gaming service. They exhibit a strong love of sports: More than a third watch four or more hours of sports per week.
HS continues to lead other segments in terms of device ownership—64 percent of HS households have a voice-assisted speaker, almost twice the average. Seventy-five percent have a gaming console, while 47 percent own a smartwatch. They are more balanced when it comes to weekly video consumption, spending close to 54 percent of their time watching live broadcast TV and 46 percent on streaming video. Forty-six percent of their video streaming time is spent on paid services and 21 percent on free services.
Highly subscribed at a glance
Maximalists, who want it all, are willing to pay a price for the optionality and experience they want
Size: 19 percent of market (-2 percent)
Mean age: 42 years
Mean household income: US$93,100
Generational profile: Gen Z: 17 percent; millennials: 23 percent; Gen X: 29 percent; boomers: 24 percent; matures: 7 percent
Favorite genre: TV sitcoms/dramas
Favorite device: Smartphone
Average number of service subscriptions: 11
Hybrid adopters (HAs): They shuffle between devices and services to access content, while maximizing value. However, this shuffle is increasingly shifting toward digital platforms. HAs’ digital savviness rose significantly this year. For example, they posted the largest growth in video streaming subscriptions among all media segments. Household penetration of video streaming services increased from 43 percent to 70 percent, while the proportion of time HAs spent consuming video on streaming platforms grew from 29 percent to 45 percent.
HAs were the only segment that reported above-average price/value gap sensitivity across pay TV, streaming, and internet services. Close to 30 percent of HAs’ streaming time is spent on free, ad-supported streaming services. Price is a critical factor for them—in fact, more than 50 percent (of those who don’t subscribe to pay TV) mentioned price as the primary reason for not having a pay TV service. Smartphone continues to be their preferred device, with 83 percent of HAs ranking it among their top three devices. When it comes to playing video games, HAs spend 36 percent of their gaming time on smartphones, second only to mobile-first viewers.
Hybrid adopters at a glance
Cost-conscious consumers willing to make changes for the best deal and value
Size: 18 percent of market (0 percent)
Mean age: 43 years
Mean household income: US$69,500
Generational profile: Gen Z: 14 percent; millennials: 26 percent; Gen X: 29 percent; boomers: 26 percent; matures: 5 percent
Favorite genres: TV sitcoms/dramas
Favorite device: Smartphone
Use, but don’t pay: 47 percent of HAs who have access to a live TV streaming service don’t pay for it
Linear TV consumers (LCs): They are the biggest group of customers for traditional outlets such as live broadcast TV, and among the biggest for print media. The total proportion of linear TV consumers decreased slightly this year. However, LCs still rely on traditional media services and devices—75 percent have a pay TV subscription, while 90 percent of their long-format content viewing happens on flat-panel TVs. Live broadcast TV accounts for more than 90 percent of LCs’ weekly video consumption and when they watch TV, they prefer live news. Close to 40 percent of LCs watch four or more hours of live news per week, which is encouraging for broadcast networks and advertisers. However, some LCs have taken baby steps toward digital consumption; for example, the number of LC households using video streaming services grew from 7 percent to 13 percent. However, LCs spend only 16 percent of their video streaming time on paid services; free streaming accounts for more than half of their streaming consumption.
Like last year, LCs show the least tolerance toward ads in general, and targeted ads in particular. Only 16 percent are willing to provide more personal data to receive targeted ads, compared with 48 percent of mobile-first viewers.
Linear TV Consumers at a glance
Media traditionalists warming to digital services
Size: 24 percent of market (-1 percent)
Mean age: 59 years
Mean household income: US$68,300
Generational profile: Gen Z: 4 percent; millennials: 7 percent; Gen X: 17 percent; boomers: 53 percent; matures: 19 percent
Live broadcast TV hours to streaming video hours ratio: 23:1
Favorite service: Pay TV
Finger on the pulse: Nearly 40 percent watch more than four hours of live news per week
Subscription fatigue sets in
As new video subscription services continue to hit the market, consumers are increasingly experiencing “subscription fatigue”: frustration with the hassles and cost of managing multiple video subscriptions. This friction is expected to rise in the short and medium term as major content companies terminate third-party licensing agreements and retain rights for their own services.3 Most segments feel a high level of frustration when the content they want to watch is no longer available on their streaming services. In the longer term, however, the shift from an environment of opportunistic content licensing to one with a higher rate of content exclusivity could provide certainty and stability that consumers will appreciate. But until then, the segment most likely to be affected by this shift will be mobile-first viewers, who consume the highest proportion of content via streaming.4
Most segments feel a high level of frustration when the content they want to watch is no longer available on their streaming services.
That’s not all: In addition to video streaming, pay TV and live TV subscriptions are testing consumers’ patience. Our data shows a high correlation between subscription fatigue and the number of video subscriptions (aggregate of video streaming, live TV, and pay TV subscriptions) that consumers should maintain (figure 1).

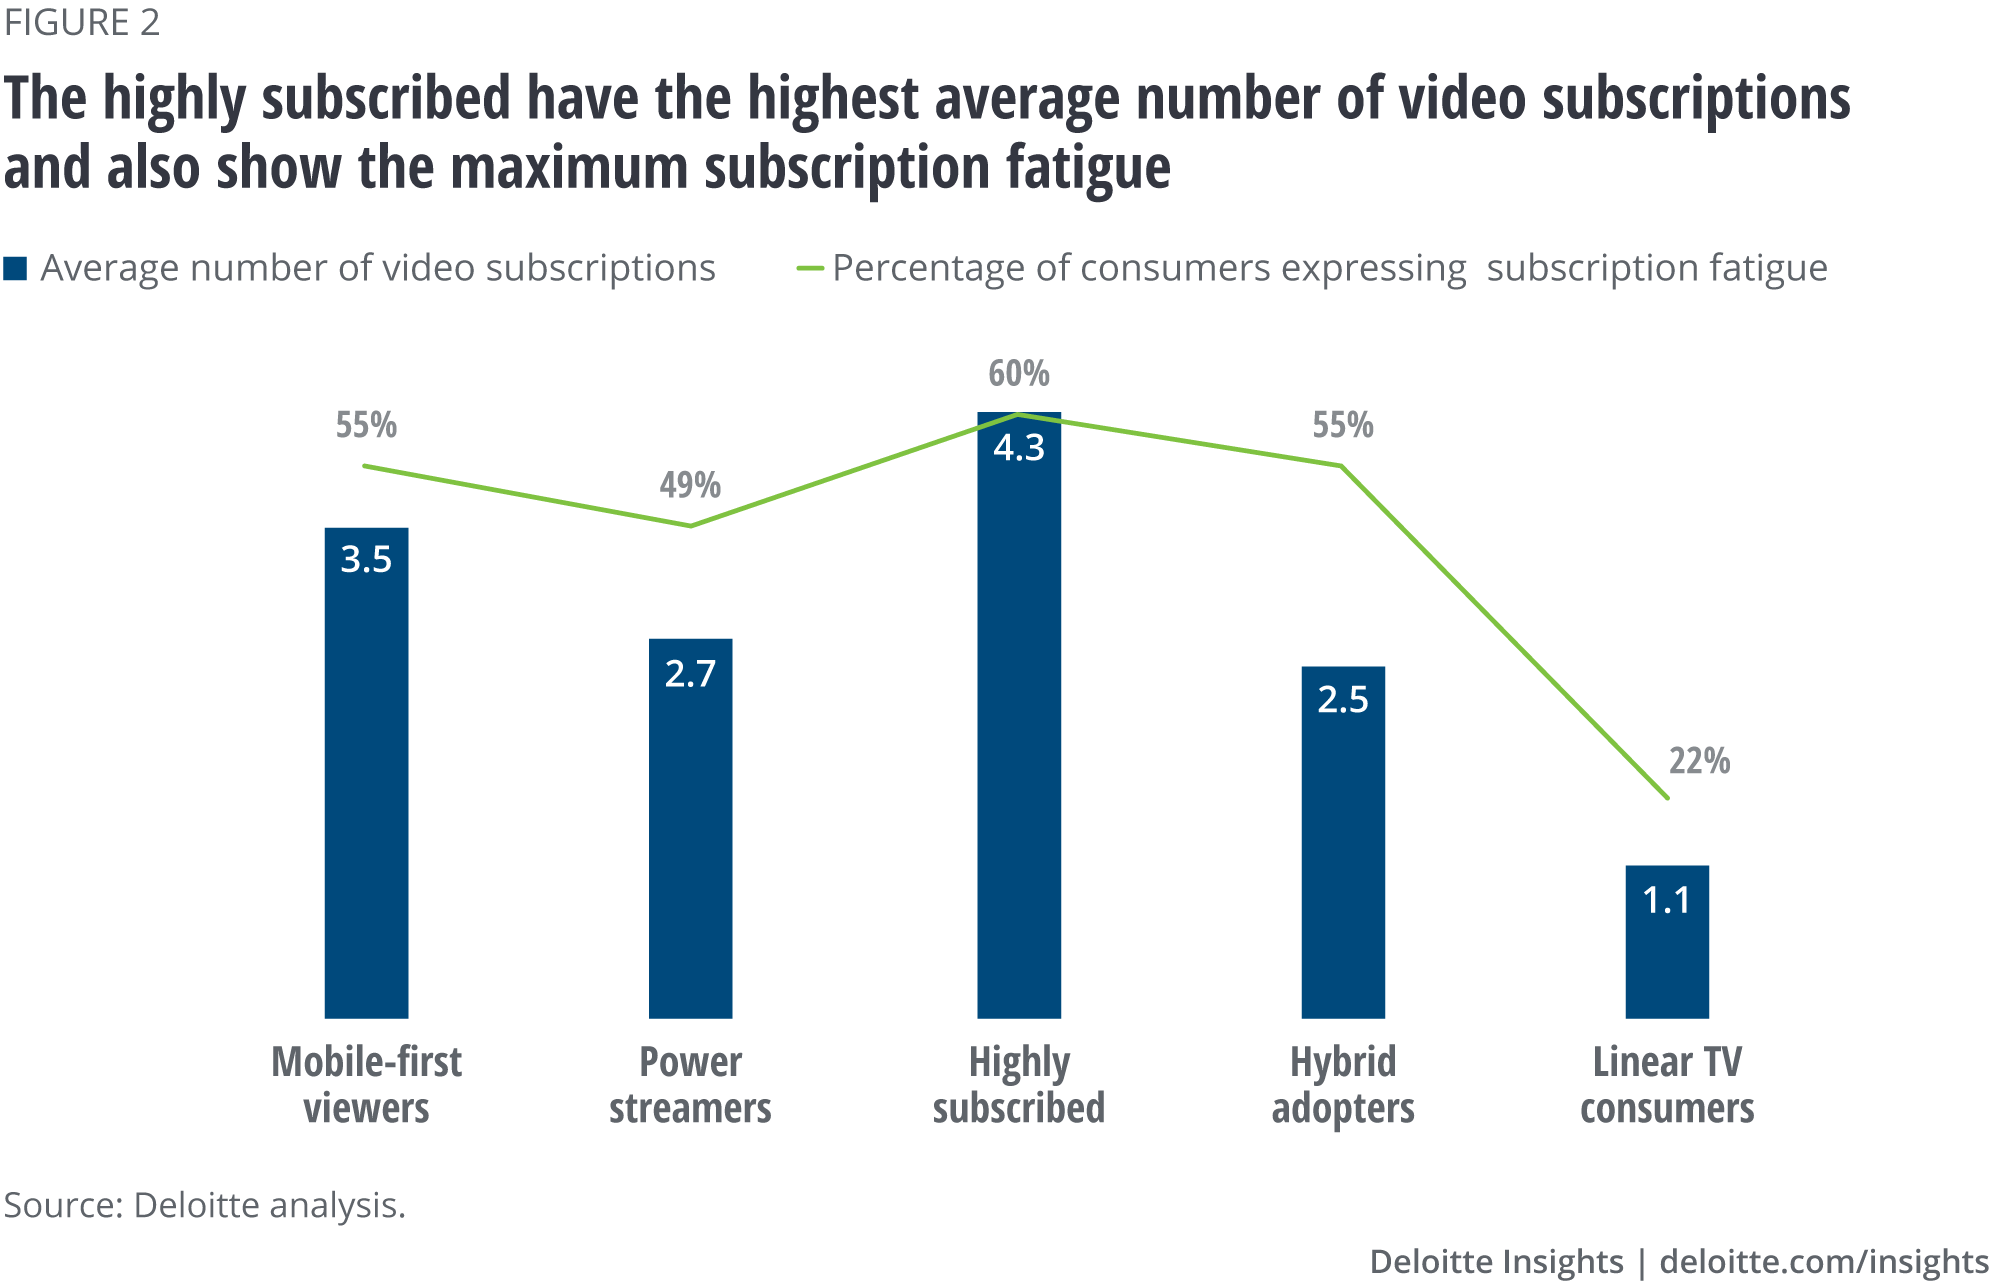
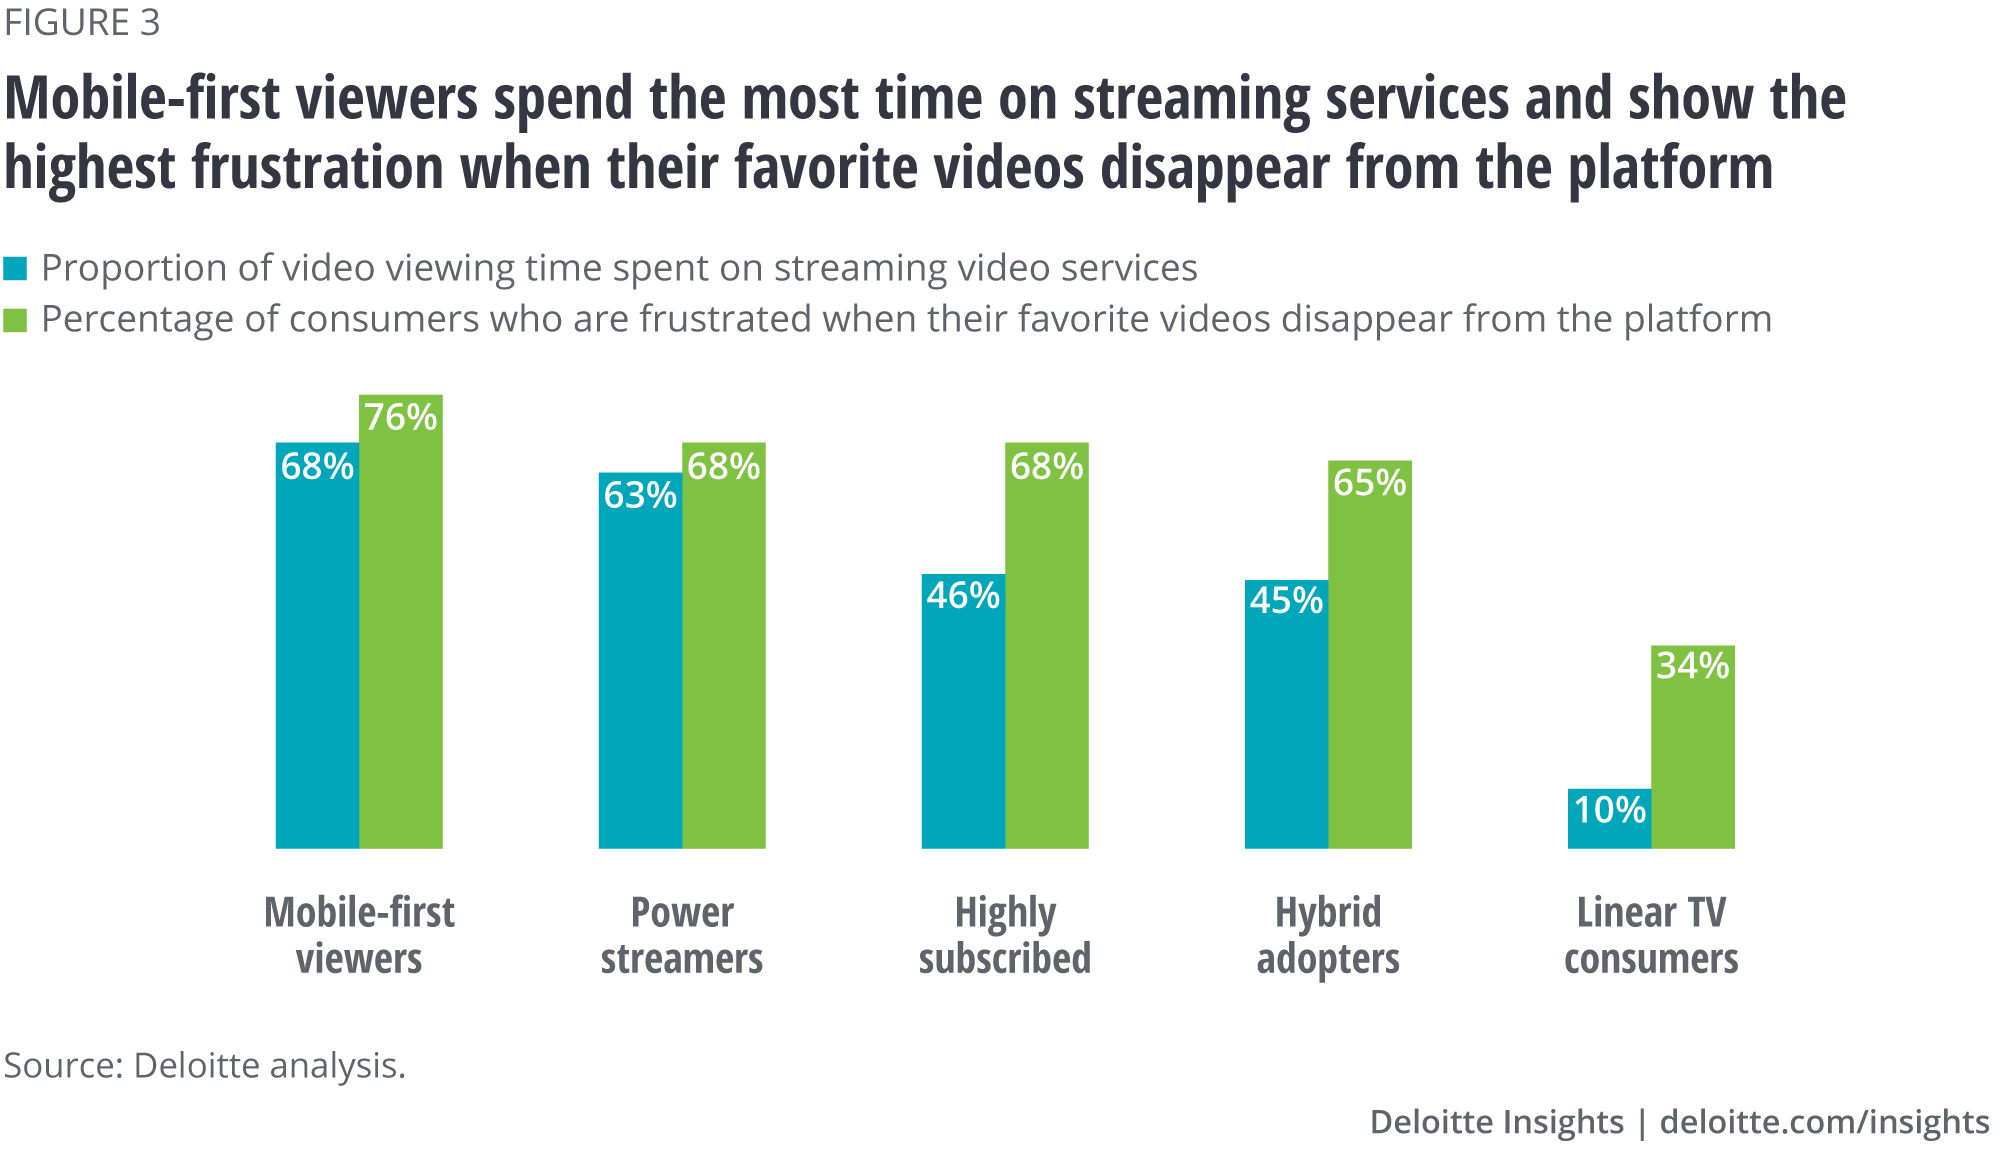
Not surprisingly, subscription fatigue and disappearing content have impacted some segments more than others. The highly subscribed, who have the highest average number of video subscriptions among all segments (4.3), show the greatest frustration (figure 2). More than 60 percent of HS are frustrated that they must maintain multiple subscriptions to access the content they want to watch. A similar proportion of HS find it hard to discover their desired content when it is spread across multiple services. Another key factor is the percentage of time a consumer spends on streaming: The more time they spend on streaming, the higher the frustration when their favorite videos disappear from the platform. Our data shows that mobile-first viewers, who spend the most time on streaming services, display the most frustration when their favorite videos disappear from the streaming platform (figure 3).
The highly subscribed, who have the highest average number of subscriptions among all segments (3.2), show the greatest frustration.
Can ad-supported streaming counter subscription fatigue?
The increasing friction and fatigue related to managing video subscription services has resulted in two key challenges for consumers:
- Economic pressures related to managing monthly spending on entertainment subscriptions, while making sure they don’t miss their favorite content
- The burden of managing accounts, preferences, and passwords associated with multiple streaming platforms
One of the ways some consumers are cutting subscription costs is by choosing ad-supported streaming services. Though the option is not available on all streaming platforms, it can significantly reduce monthly subscription charges. For example, Hulu offers its ad-supported service at just US$5.99 per month, while the ad-free version costs US$11.99 monthly. Other platforms offer similar services.
One of the ways some consumers are cutting subscription costs is by choosing ad-supported streaming services.
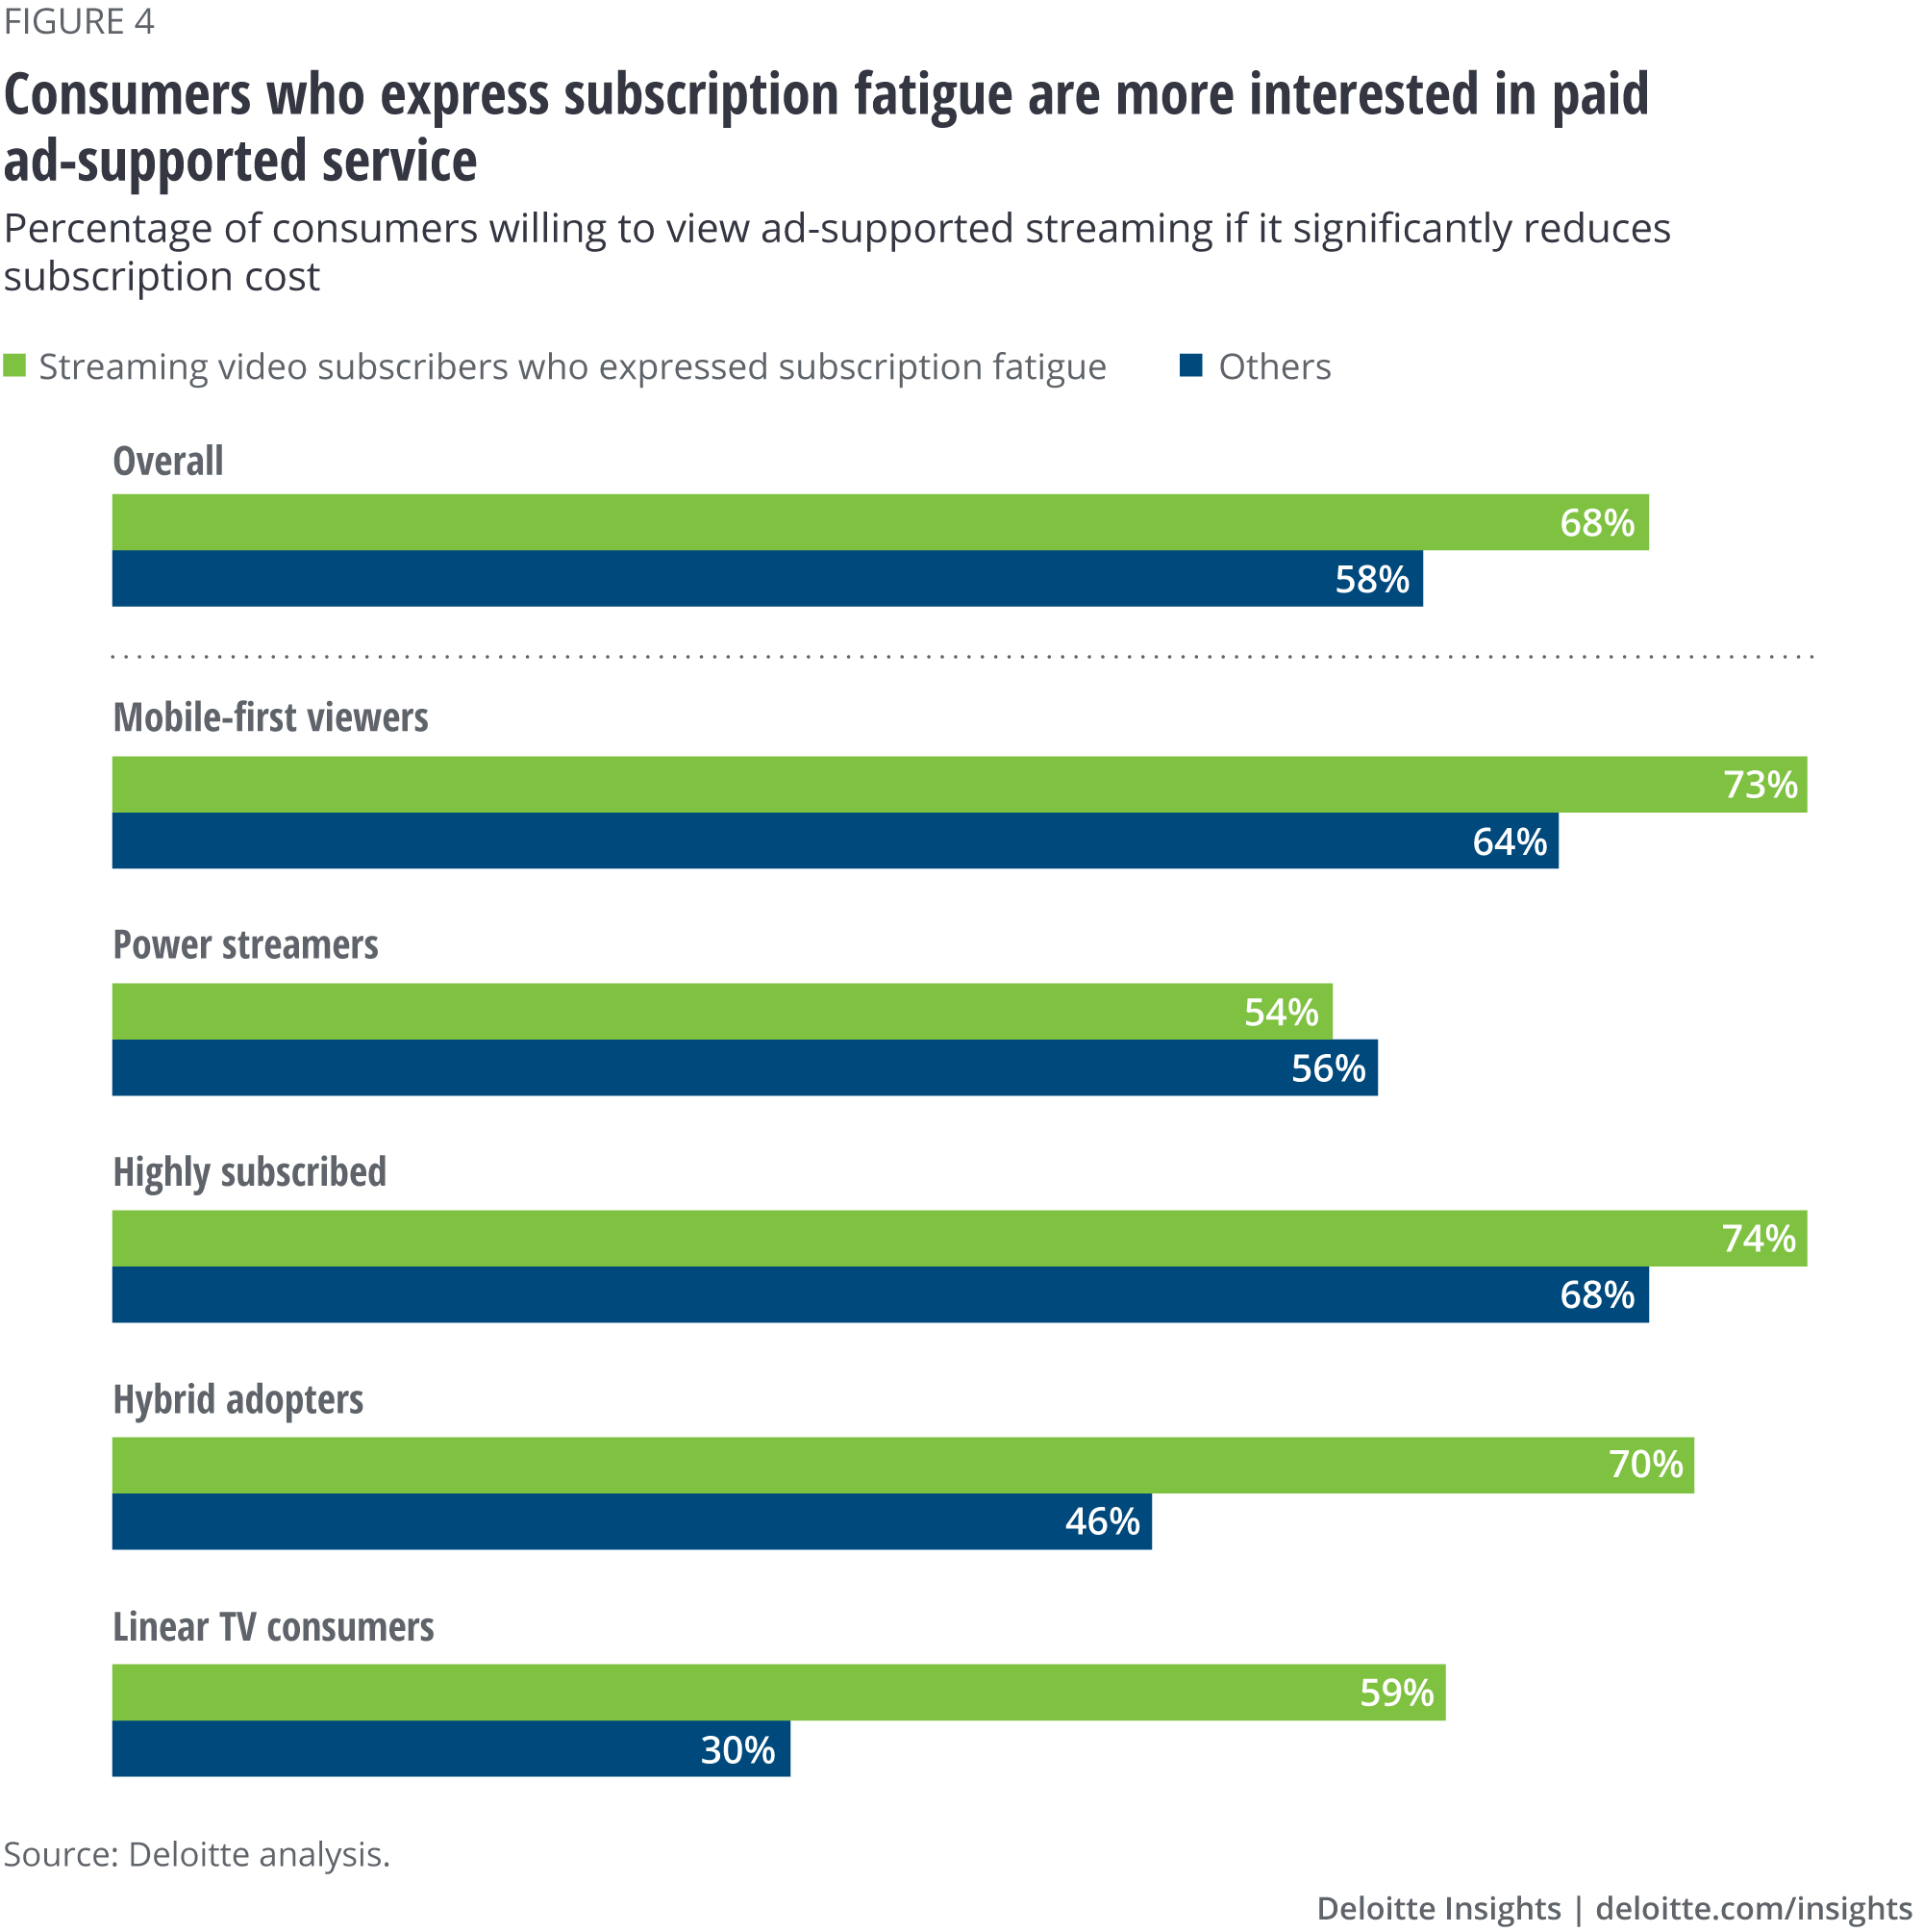
Our analysis also shows that consumer interest in discounted ad-supported services has grown, particularly across certain segments. In addition, the Digital media trends survey, 13th edition shows that people suffering from subscription fatigue are more willing to opt for ad-supported services than other consumers (figure 4). Overall, 68 percent of video streaming subscribers with subscription fatigue are interested in ad-supported services—and this figure is even higher for the highly subscribed segment. More than 70 percent of highly subscribed consumers are willing to view advertising with streaming if it significantly reduces the cost of the subscription. Close to 70 percent mobile-first viewers and hybrid adopters feel the same.5
The rising interest in ad-supported streaming is driven not only by its lower cost, but also by the superior ad experience on digital platforms. Because these ads tend to be more targeted and relevant, consumers are more likely to respond to them versus generic ads on a linear channel. Our latest Digital media trends survey data shows that the highly subscribed and mobile-first viewers are most open to targeted digital ads (figure 5).

Our survey findings are validated by the recent growth of ad-supported streaming platforms. For example, as of May 2019, Hulu had 82 million users, 70 percent (58 million) of whom were using ad-supported services.6 Roku was next on the list with more than 30 million active users as of June 2019, representing a year-over-year growth of 39 percent.7 These platforms’ advertising revenues have exploded as well: Hulu generated ad revenues of US$1.5 billion in 2018,8 while Roku’s total platform revenue (which includes revenue from advertising) for the second quarter of 2019 was US$167.7 million—representing 86 percent year-over-year growth.9
Some of these ad-supported platforms are innovating their offerings by reaggregating or bundling other streaming services. The Roku TV platform enables users to aggregate their content from a range of providers/platforms through one interface. And in some cases, Roku can collect payment for content it provides directly and on behalf of these other providers/platforms—which, for users, reduces the burden of managing multiple accounts or passwords. In a way, it also mitigates constraints related to content library churn, as consumers can add desired content from different platforms on their playlists—albeit through a la carte pricing.
Some ad-supported platforms are innovating their offerings by allowing reaggregation or bundling of other streaming services.
A balancing act: Offering both ad-free and ad-supported services
In this intense battle for video streaming dominance, it’ll be increasingly important for M&E companies to reassess their business models and offerings. The one-size-fits-all model may not work. On one hand, as consumers shift from linear to digital platforms, ad-supported video offerings will likely emerge as the heir apparent to TV advertising dollars. On the other hand, intense competition in the video subscription space may lead to saturation in the subscriber base, followed by stagnation in subscription revenues. Raising subscription prices may not work, either, and could lead to consumer churn.
What, then, should video streaming providers do? Based on our research, here are some steps they can consider to tap into the growing market and keep grabbing the eyeballs:
- Maintain a portfolio of both ad-supported and ad-free services to meet different consumer needs (see figure 6).
- Consider using fee free trial incentives and free ad-supported content to attract a new group of consumers.
- To address the “advertising vs. subscription dollars” question, include consumers in the decision-making process, potentially enabling consumers to choose their ideal ratio of fees to ads.
- Understand where they can pitch ad-supported content and where they’re going to have to make more money through ad-free subscriptions.
- Use our digital media segments insights to determine where consumers fall on the spectrum between being “ad-lergic” and “subscription fatigued.”

M&E companies pulling back their content from third-party streaming platforms should also keep in mind that they will most likely lose the licensing/syndication revenues associated with that content. The objectives in this case are to expand the library of exclusive content, attract more consumers to the platforms, and increase platform revenues. While the latter leads to lucrative direct relationships, blindly pulling back content (and losing licensing revenues) may not be the ideal thing to do.
Companies should thoroughly analyze their own historical content and make an informed decision around its exclusivity. It may be worthwhile to leave some content on third-party platforms and earn revenues from them, rather than having it on your own platform where no one sees it. Conversely, third-party streaming platforms should weigh the risks and rewards of retaining libraries of popular studio content versus spending on original content that could fail to develop a fan base.
Companies should thoroughly analyze their own historical content and make an informed decision around its exclusivity.
While the first phase of the streaming war focused on whether or not to go direct, the next phase will likely emphasize scaling up and monetizing the subscriber base. Customer analysis, segmentation, and targeting will likely be the keys to success.
The Center for Technology, Media & Telecommunications
Deloitte's Center for Technology, Media & Telecommunications (TMT Center) conducts research and develops insights to help business leaders see their options more clearly. Beneath the surface of new technologies and trends, the center's research will help executives simplify complex business issues and frame smart questions that can help companies compete—and win—both today and in the near future. The center can serve as a trusted adviser to help executives better discern risk and reward, capture opportunities, and solve tough challenges amid the rapidly evolving TMT landscape.
Learn more
Get in touch

- Kevin Westcott
- Vice chairman, leader, US Telecommunications, Media & Entertainment practice
- Deloitte Consulting LLP
- kewestcott@deloitte.com
- +1 213 553 1714


More from the Telecom, media & entertainment collection
-
 Redesigning stadiums for a better fan experience Article4 years ago
 -
 Is the European esports industry entering the mainstream? Article4 years ago
 -
 How to begin regulating a digital reality world Article5 years ago
 -
 How experienced TMT organizations are navigating AI Article5 years ago
 -
 Connectivity of tomorrow Article5 years ago