


The US debt crisis: Bumping against the ceiling again has been saved

The US debt crisis: Bumping against the ceiling again Behind the Numbers, October 2015
22 October 2015
At some point during the next couple of months, the Treasury will not likely be able to make timely payments to holders of US debt and other creditors. So who are those debt holders that might not get paid?
Explore
View the Behind the Numbers collection, a monthly series from Deloitte’s economists.
Under an agreement reached in February 2014, in exchange for mandatory spending restrictions (the “sequester”), US Congress agreed to a suspension of the debt ceiling of $17.2 trillion until March 15, 2015. When the suspension ended, the total public debt outstanding was $18.2 trillion, which became the new ceiling.1 Since spending was still outpacing revenues, the Treasury began implementing a series of “extraordinary measures,” to continue paying all bills on time without incurring more debt. These measures involve a change in operating procedures where the Treasury stops redeeming existing investments and suspends new investments in various funds under its control, such as the Civil Service Retirement and Disability Fund and the Postal Service Retirees Health Benefit Fund.2
These maneuvers only buy a limited amount of additional time. In his most recent letter to Congress on October 1, 2015, Secretary of the Treasury Jacob Lew stated that “We now estimate that Treasury is likely to exhaust its extraordinary measures on or about Thursday, November 5.”3 The uncertainty surrounding the exact point at which timely payments would not be possible stems from the unevenness of the inflow of corporate and income tax payments to the Treasury and the size of payments that the Treasury needs to make on any given day.
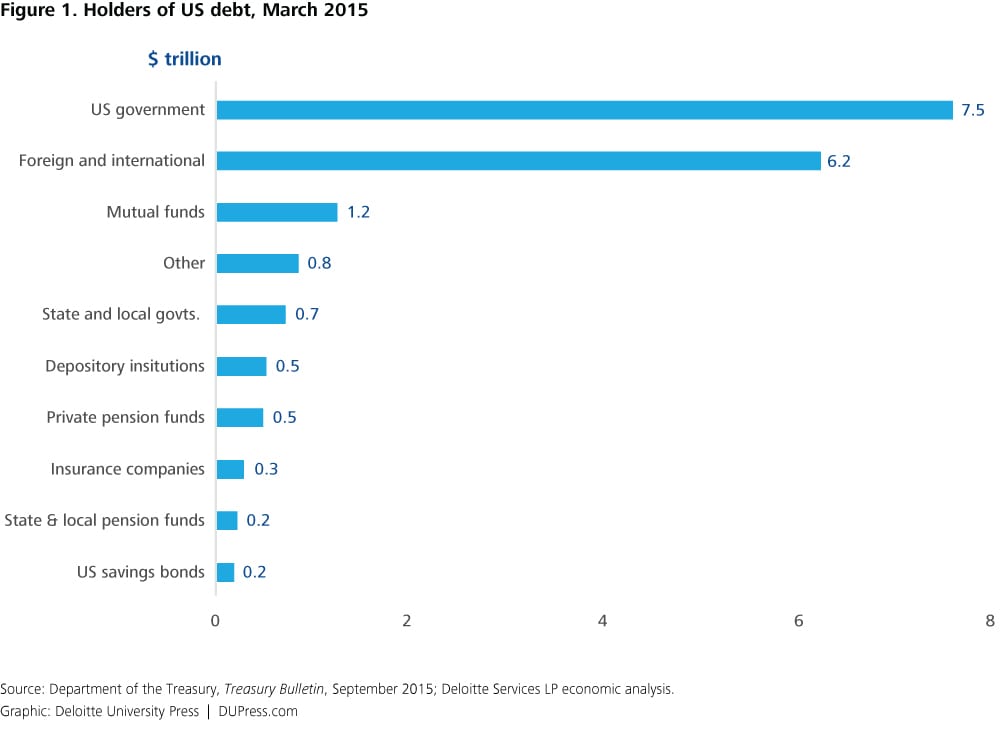
So who are these debt holders?
The US government issues debt in a variety of forms: Treasury bills, sold at a discount to their face value and with maturities of a year or less; Treasury notes, which pay interest every six months and have maturities of 2–10 years; Treasury bonds, which pay interest every six months and mature in 30 years; and Treasury Inflation-Protected Securities (TIPS), whose principal is adjusted by changes in the inflation rate and that have variable maturities.4 Given the relative stability and positive growth prospects of the United States, these “Treasuries” are fortunately in high demand—fortunately because high demand means that the US government does not incur high interest cost to finance the government.
As shown in figure 1, the largest holders of debt, accounting for two-thirds of the total, are the US government itself ($7.5 trillion or 41 percent) and foreign/international accounts ($6.4 trillion or 34 percent). Although dwarfed by these two groups, even the smaller debt holders hold significant dollar amounts. For example, the $1.2 trillion held by mutual funds is approximately 7.5 percent of the total invested in US mutual funds, and the $500 billion held by private pension funds is approximately 7 percent of total private pension assets.5
Debt held by US government: Debt held by the government falls into two categories: Treasuries held by the US Federal Reserve (Fed), and Treasuries held in intragovernmental accounts. The balance between these two has shifted since the recession, although taken together, they now account for a smaller proportion of the total than in prior years. In 2007, they accounted for over 50 percent of debt holdings; currently, they account for approximately 40 percent, as other categories such as foreign/international grew more rapidly.6
In the years leading up to the recession, the Fed’s holdings of Treasuries grew slowly, averaging under 3 percent per year. Between 2007 and the ending of the third round of quantitative easing (QE3) in October 2014, Fed Treasury holdings grew almost 18 percent per year on average. In 2007, the Fed held an average of $783 billion in Treasuries on its balance sheet. When QE3 ended in October 2014, the Fed had $2.5 trillion—a threefold increase.7 Treasuries held in intragovernmental accounts have also grown over time, but at a slower pace, and are currently almost 30 percent higher in nominal value. Because of the differential growth rates, Treasuries held by the Fed have risen from 17 percent of government holdings to 33 percent (figure 2).

Treasuries held in intragovernmental accounts are an accounting of money that the government owes itself. For example, when payroll tax receipts for Social Security (Federal Old-Age and Survivors Insurance Trust Fund) exceed payments to retirees, the balance remaining in the trust fund is invested in Treasuries—an asset on the trust fund balance sheet and a liability to the federal government at large. The 15 largest of these government holders of debt are presented in figure 3, and together they account for 97 percent of the intragovernmental holdings; Social Security alone accounts for 55 percent. Only 5 of the top 15 are not related to retirement, disability, or health insurance.
Figure 3. Largest intragovernmental holders of debt (in USD)
| Federal Old-Age and Survivors Insurance Trust Fund | 2,772,129 |
| Civil Service Retirement and Disability Fund, Office of Personnel Management | 718,952 |
| Department of Defense Military Retirement Fund | 533,985 |
| Department of Defense, Medicare Eligible Retiree Fund | 206,246 |
| Federal Hospital Insurance Trust Fund | 191,742 |
| Federal Supplementary Medical Insurance Trust Fund | 63,460 |
| Deposit Insurance Fund | 58,195 |
| Nuclear Waste Disposal Fund, Department of Energy | 51,806 |
| Unemployment Trust Fund | 48,229 |
| Postal Service Retiree Health Benefits Fund | 45,237 |
| Federal Disability Insurance Trust Fund | 44,159 |
| Employees' Life Insurance Fund, Office of Personnel Management | 43,960 |
| Employees' Health Benefits Fund, Office of Personnel Management | 23,454 |
| Exchange Stabilization Fund, Office of the Secretary, Treasury | 22,644 |
| Pension Benefit Guaranty Corporation | 18,422 |
| Foreign Service Retirement and Disability Fund | 18,069 |
| Total intragovernmental debt | 5,008,752 |
Source: US Department of the Treasury.
Foreign/international owners of US debt: The second-largest category of debt holders are Treasuries that are held outside the United States. The two largest, China and Japan, together account for 40 percent of the total. The nationalities of actual owners of custody accounts in the case of the third-largest category, the Caribbean Banking Centers (which include Bonaire, St. Eustatius, and Saba; Bahamas; Bermuda; Cayman Islands; Curacao; Sint Maarten; and Panama), are unknown.8
Figure 4. Major foreign holders of Treasury securities
| China, mainland | $1,240.80 |
| Japan | $1,197.50 |
| Caribbean Banking Centers | $324.50 |
| Brazil | $256.70 |
| Switzerland | $217.50 |
| Ireland | $216.60 |
| United Kingdom | $212.60 |
| Luxembourg | $185.20 |
| Hong Kong | $182.30 |
| Taiwan | $168.60 |
| Belgium | $155.40 |
| Total | $6,076.60 |
Source: US Treasury department.
What happens when the Treasury department cannot pay its bills?
Without an increase in the debt ceiling, the Treasury is currently limited to cash on hand to pay the obligations incurred by the federal government. Should Congress fail to raise the debt ceiling and the cash is insufficient to pay the bills due on any given day, a queue begins to build, and the payments fall farther and farther behind. That would include interest owed to all the holders of Treasuries detailed above—a default. They would be in the same queue as others who collect government checks, including Social Security and Medicare recipients, military personnel, and those expecting tax refunds.9 While these direct impacts and the ensuing hardships they would cause are a certainty without an increase in the debt, the great unknown is the amount of turbulence that such an event would cause in world financial markets. Some have opined that a default, particularly if of short duration, would not have a big impact on financial markets. Others predict that it would start another financial crisis. With such a huge downside potential, this is a risky chance to take.