Analysis from the first nine years of our Measuring the return from pharmaceutical innovation series concluded that a transformational change in R&D productivity is required to reverse declining trends in R&D returns across the biopharma industry. Analysis from this, our tenth report, shows that this conclusion is still true today.
The original cohort’s projected returns have declined slightly to 1.8 per cent
In 2019, the consolidated average IRR for the original cohort has declined to 1.8 per cent – a slight decrease of 0.1 per cent from 2018, but a decrease of 8.3 per cent from 2010. This represents an average decline of 0.83 per cent per year.
The wide variations in performance between individual companies in the original cohort that have been a feature of previous analyses are no longer evident, as the range in values from the top and bottom performer has declined from 10.4 per cent in 2018 (top performer: 7.5 per cent, bottom performer: -2.9 per cent) to 7.2 per cent in 2019 (top performer: 5.1 per cent, bottom performer: -2.0 per cent). In addition, while eight of the 12 biopharma companies in our original cohort improved slightly from 2018, only one company achieved returns above five per cent. On a three-year rolling average basis, the average IRR of the original cohort is now tracking at 2.5 per cent for 2017-19.
Declining returns are the result of internal and external productivity challenges
In recent years, we have seen declines in the number of assets in the original cohort’s late-stage pipeline, which reached a low of 159 in 2018, an average of 13.25 per company. However, there is significant variation between the companies (from four to twenty-one). However, this year the number of late-stage assets has increased to 183, a three year high and very close to the ten year average of 186.5, corresponding to an average of 15.25 assets per company, with the range narrowing from eight to twenty-two.
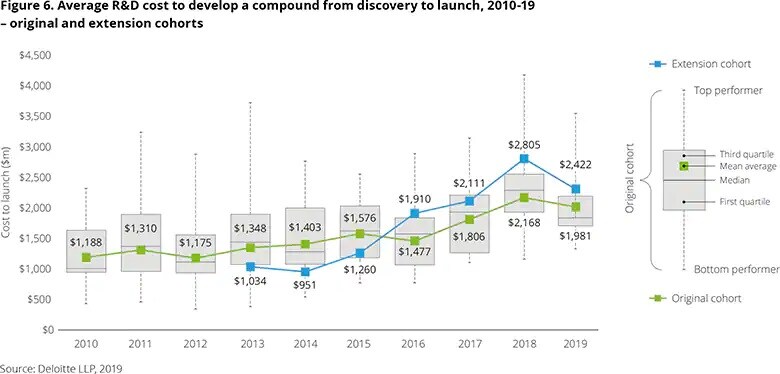
The average cost to develop an asset has decreased due to pipeline replenishment
Our cohort companies spent $79 billion on R&D in 2019, corresponding to an increase of 17 per cent in underlying R&D expenditure since 2010. However, due to the increase in the number of pipeline assets, the average cost to develop an asset in 2019 is $1,981 million, a decrease of $187 million from 2018. At constant late-stage asset numbers (159 from 2018), the average cost per asset would have increased to $2,280 million, an increase of $112 million.
With the decline in average cost to develop an asset, we also see a decline in the range from the top and bottom performers from our cohort, although this variance is still significant across our cohort companies.
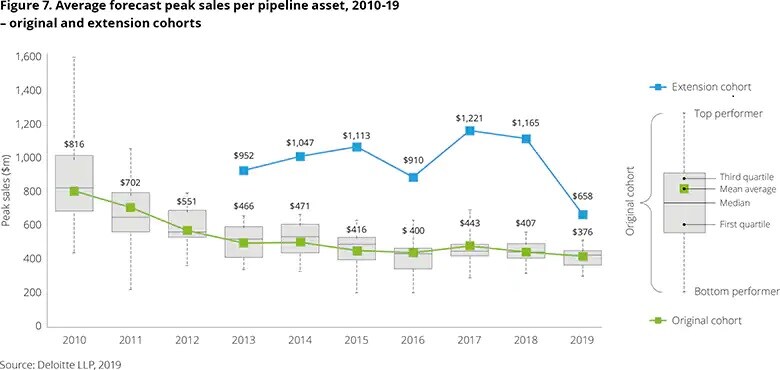
Forecast peak sales decline slightly in 2019
The decrease in the average forecast peak sales per asset has, and continues to be, the greatest reason for the decline in IRR of the pipeline factors. This year has seen a decline in average forecast peak sales per pipeline asset from $407 million in 2018 to $376 million in 2019. The range in average forecast peak sales this year is the lowest is has been over the last ten years. On a three-year rolling average basis, average forecast peak sales per asset is now tracking at $408 million for 2017-19.