Artikkel

Nordic Banks under the spotlight
Increasing regulatory focus on climate risks
As evidence of the growing recognition of the importance of environmental, social, and governance (ESG) factors in assessing the long-term viability and sustainability of banks and institutions, the European Banking Authority (EBA) has published binding standards on Pillar 3 ESG risk disclosures in January 2022.
Published: 20. august 2023
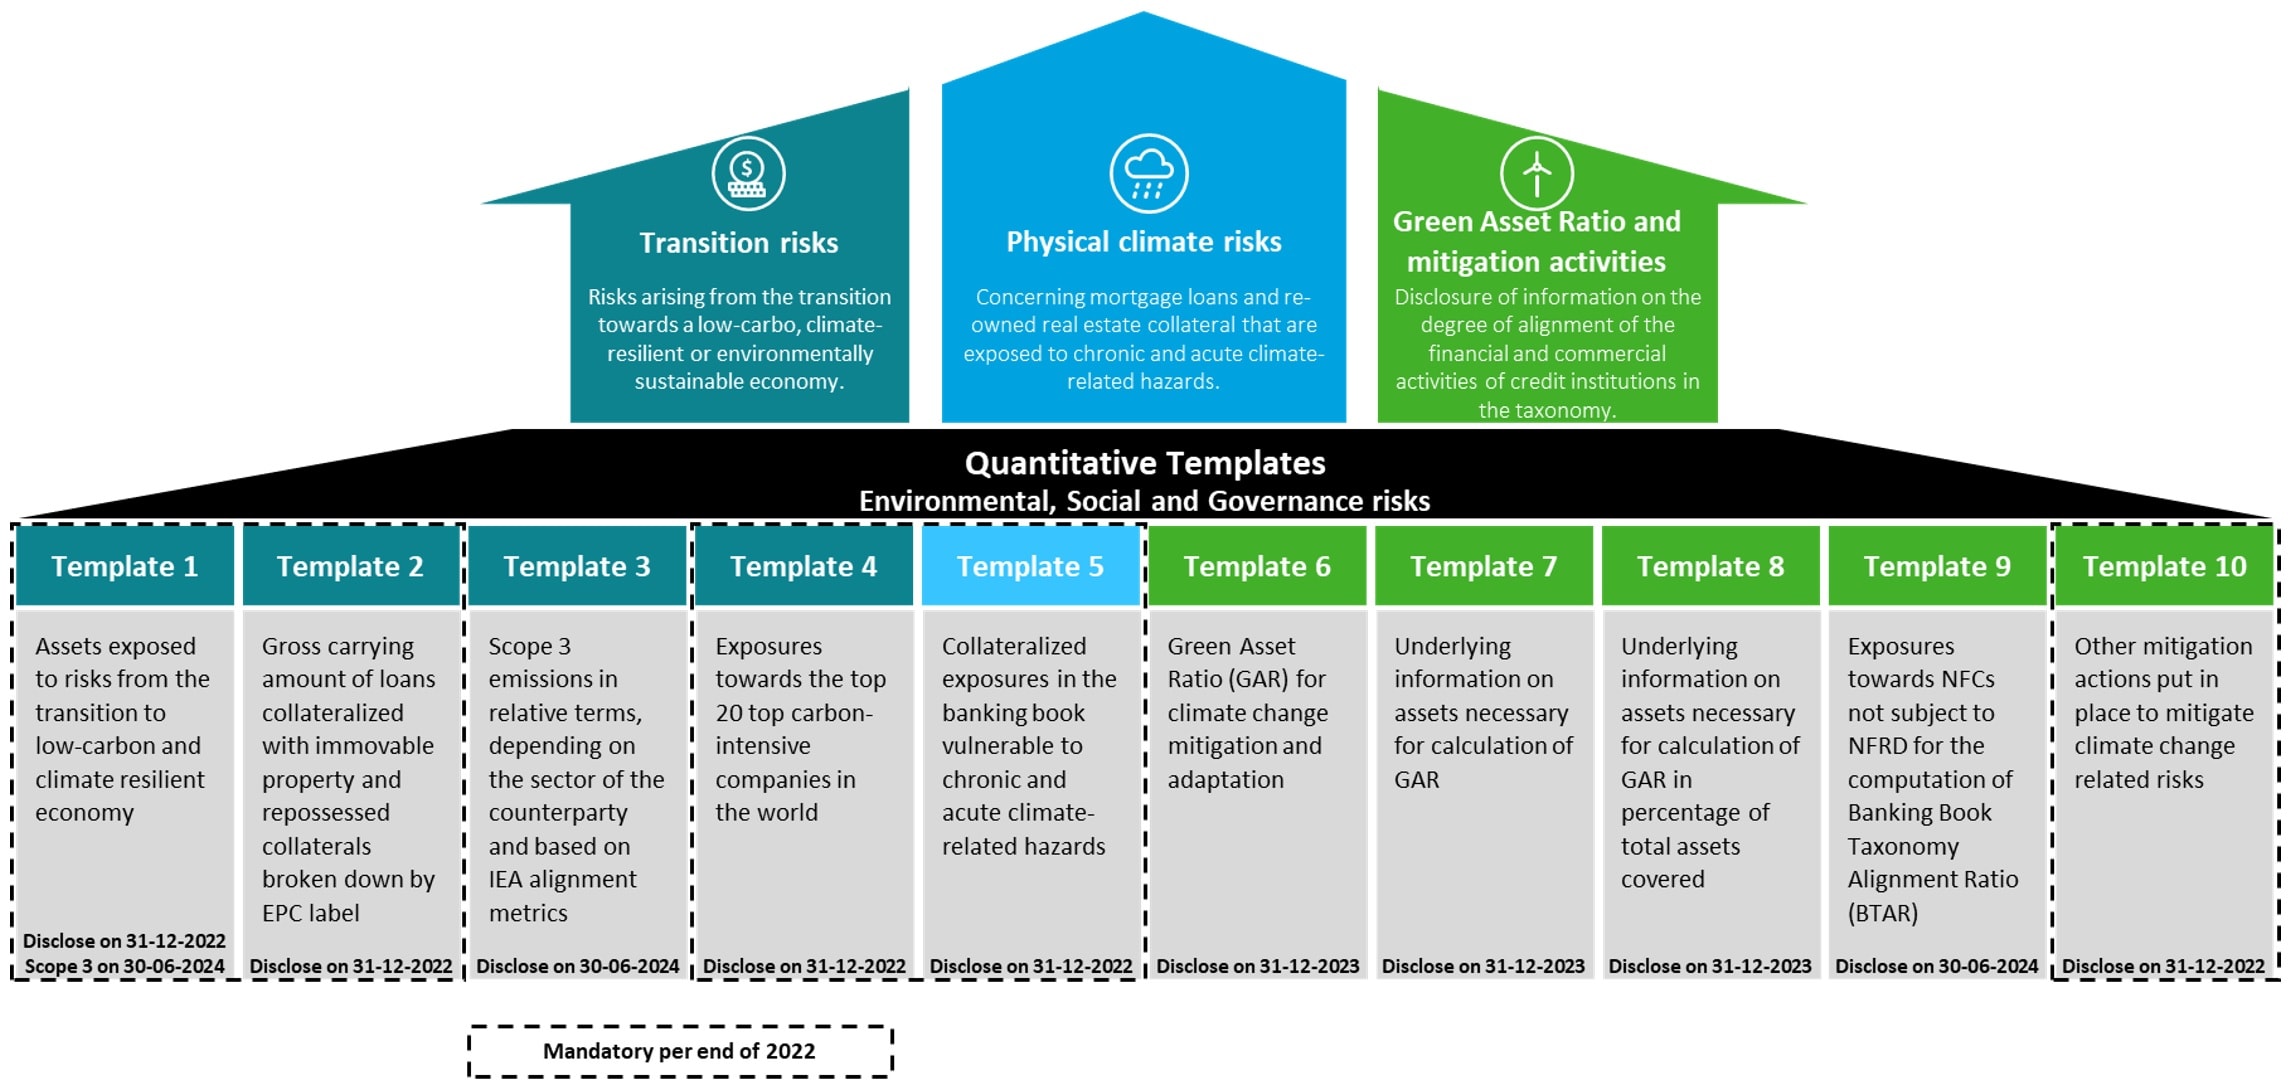
Large banks with securities traded on a regulated market of any Member State1 are required to provide information in four categories according to the EBA Pillar 3 disclosures: exposure to carbon-related assets and assets subject to climate change-related risks, their mitigating actions supporting the counterparties’ transition into a net-zero economy and in climate change adaptation. In addition, KPIs are included regarding the institutions’ assets financing environmentally sustainable activities in line with the EU Taxonomy’s criteria. These categories should be reported in ten templates where the related information is disclosed by the banks. The overview of the scope of the templates and disclosure timelines are illustrated below.
Deloitte performed a benchmark across European banks to assess their first publication ESG Pillar III disclosures for FY2022. Publicly disclosed information of 50+ banks was collected, including the following Nordic2 banks: OP Bank, Nordea, Danske Bank, Nykredit, Swedbank, Kuntarahoitus Oyj, SEB & SHB. Our key takeaways from the first reporting period follow, focused on the Nordic group of banks.
Exposure to sectors that highly contribute to climate change and financed emissions
In the Nordic peer group that had disclosed the templates, 6 banks have become PCAF3 members. These are OP, Nordea, Kuntarahoitus, SHB, Swedbank and Danske Bank. These banks, therefore, followed the PCAF methodology to estimate financed emissions, while Nykredit listed the Finance Denmark CO2 model and its principles for the financial sector's determination and disclosure of emissions from financed activities as the applied approach. The graph below shows the indirect GHG emissions4 attributable to a bank due to its involvement in providing capital or financing to a company that emits GHGs. Northern Europe5 constitutes only 8% of the total European financed emissions in the sample of Pillar 3 reports we collected. The distribution of sectors contributing to financed emissions in Europe versus Northern Europe is shown in the graph below.
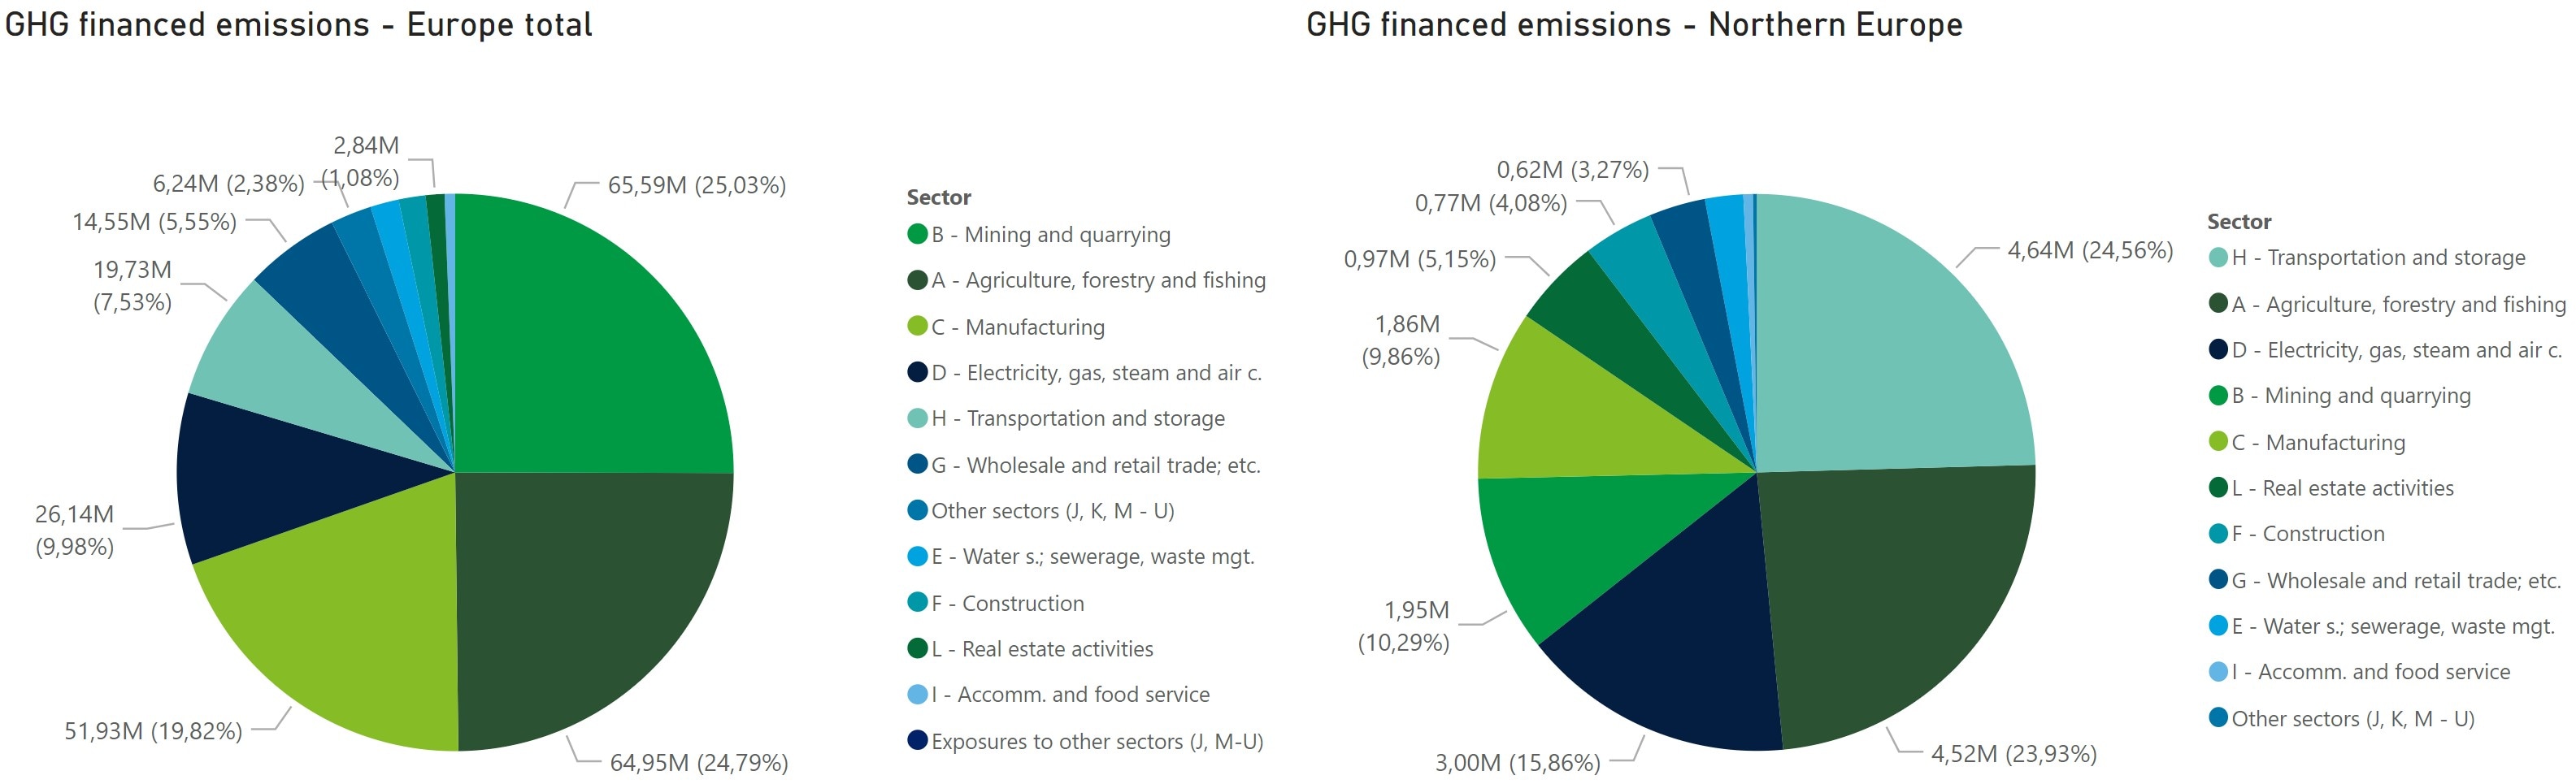
While Mining, Agriculture and Manufacturing constitute about 70% of the financed emissions at a European level, Transportation, Agriculture and Electricity sectors are responsible for about 64% of the total financed emissions in Northern Europe.
The distribution of accumulated impairments by bank and sector that highly contribute to climate change shows that the highest percentage of impairments are related to the Manufacturing, Wholesale and retail trade, and Real estate sectors with electricity and water supply being the lowest:
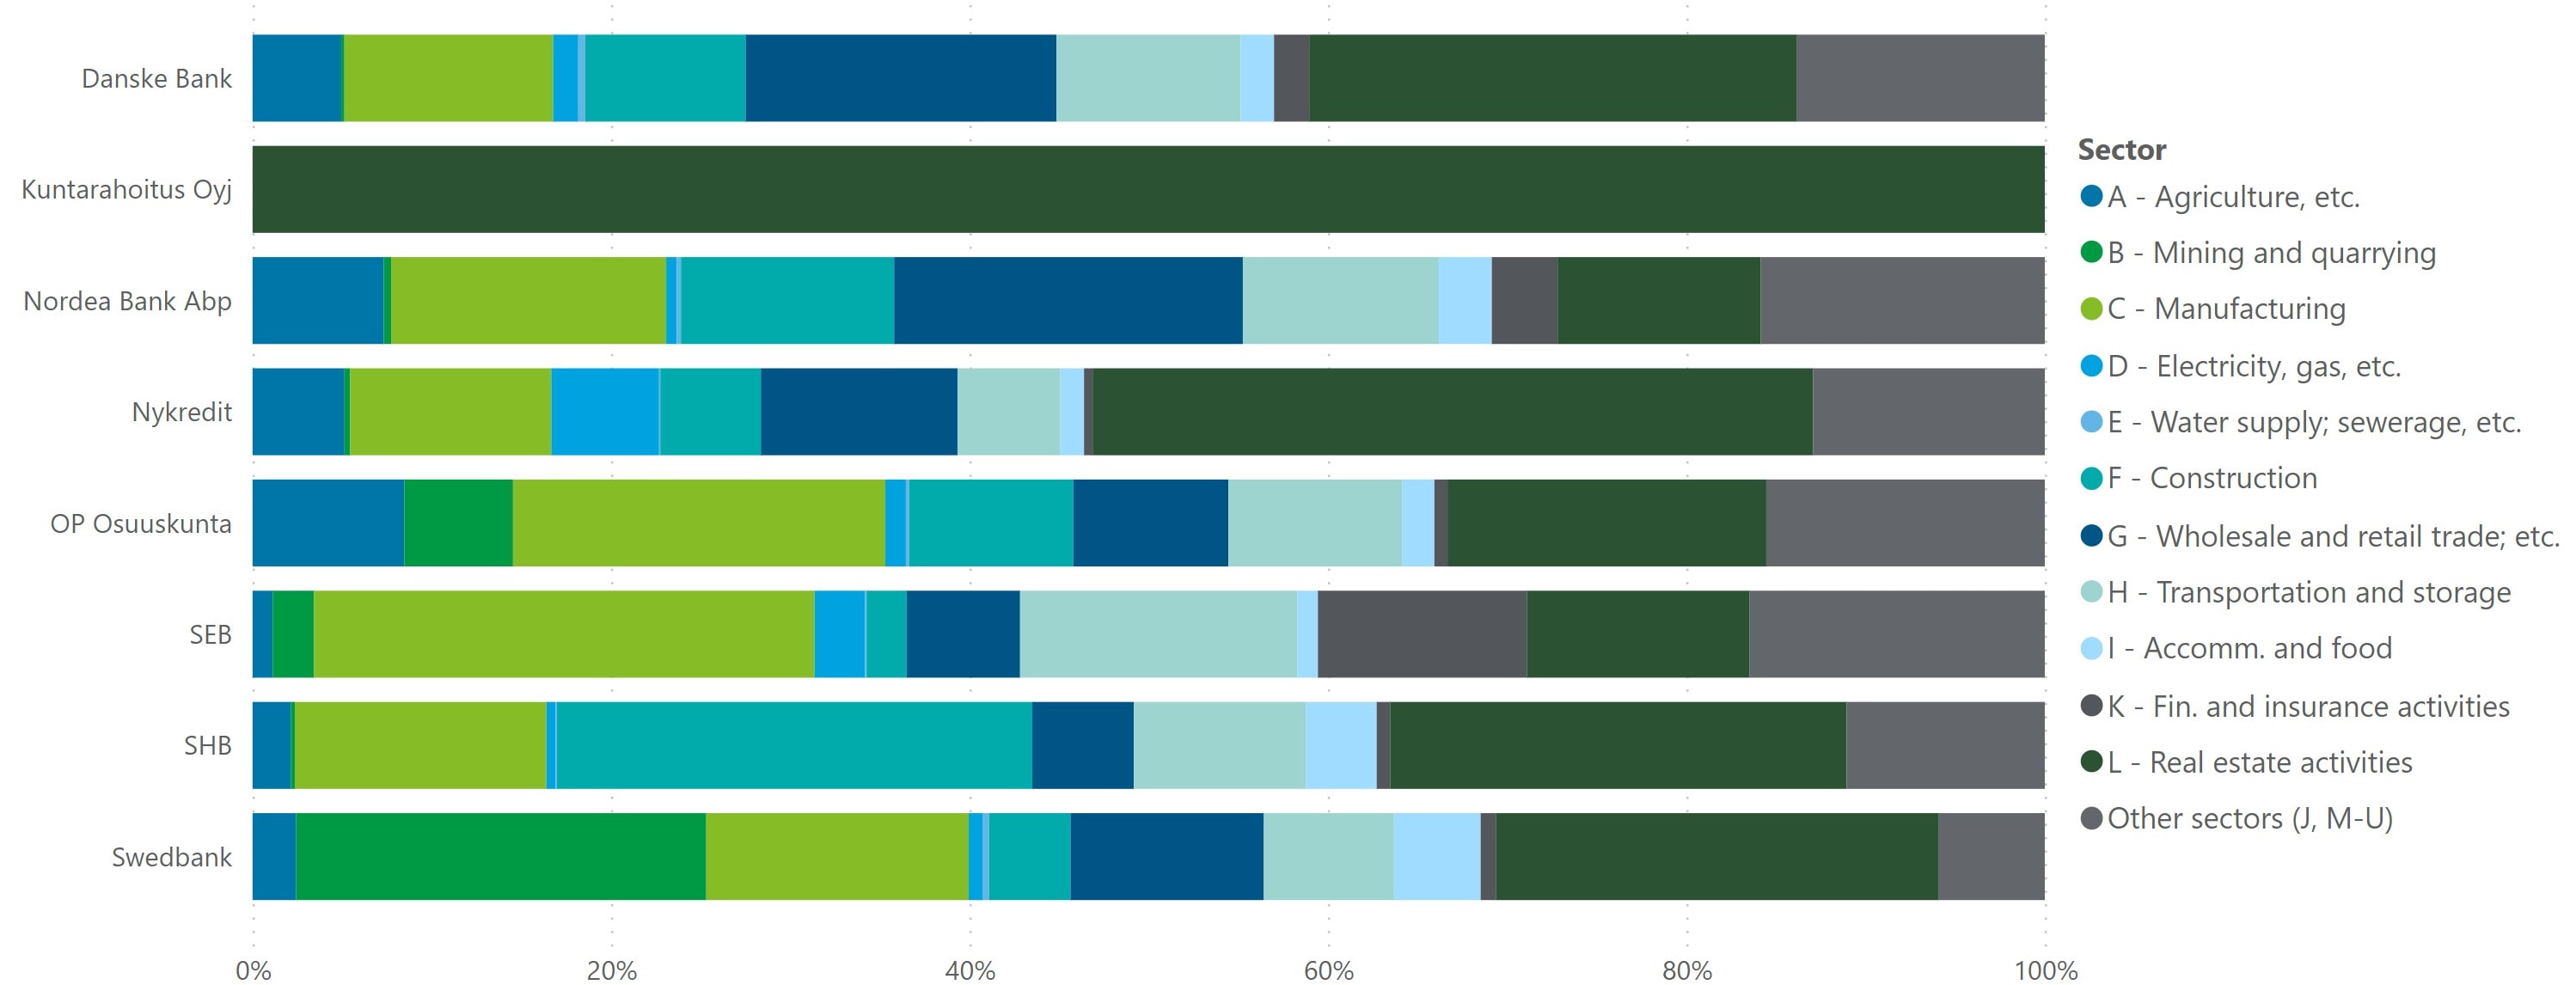
Generally, a higher share of impairment can indicate a risk of stranded assets. In this case, it could stem from stricter regulatory changes that result in assets that will not be able to earn their original economic return or have the risk of being written off completely.
Considering the average weighted maturity of the exposures in climate-vulnerable sectors, the ones with the longest maturities are in Agriculture and Real Estate activities.
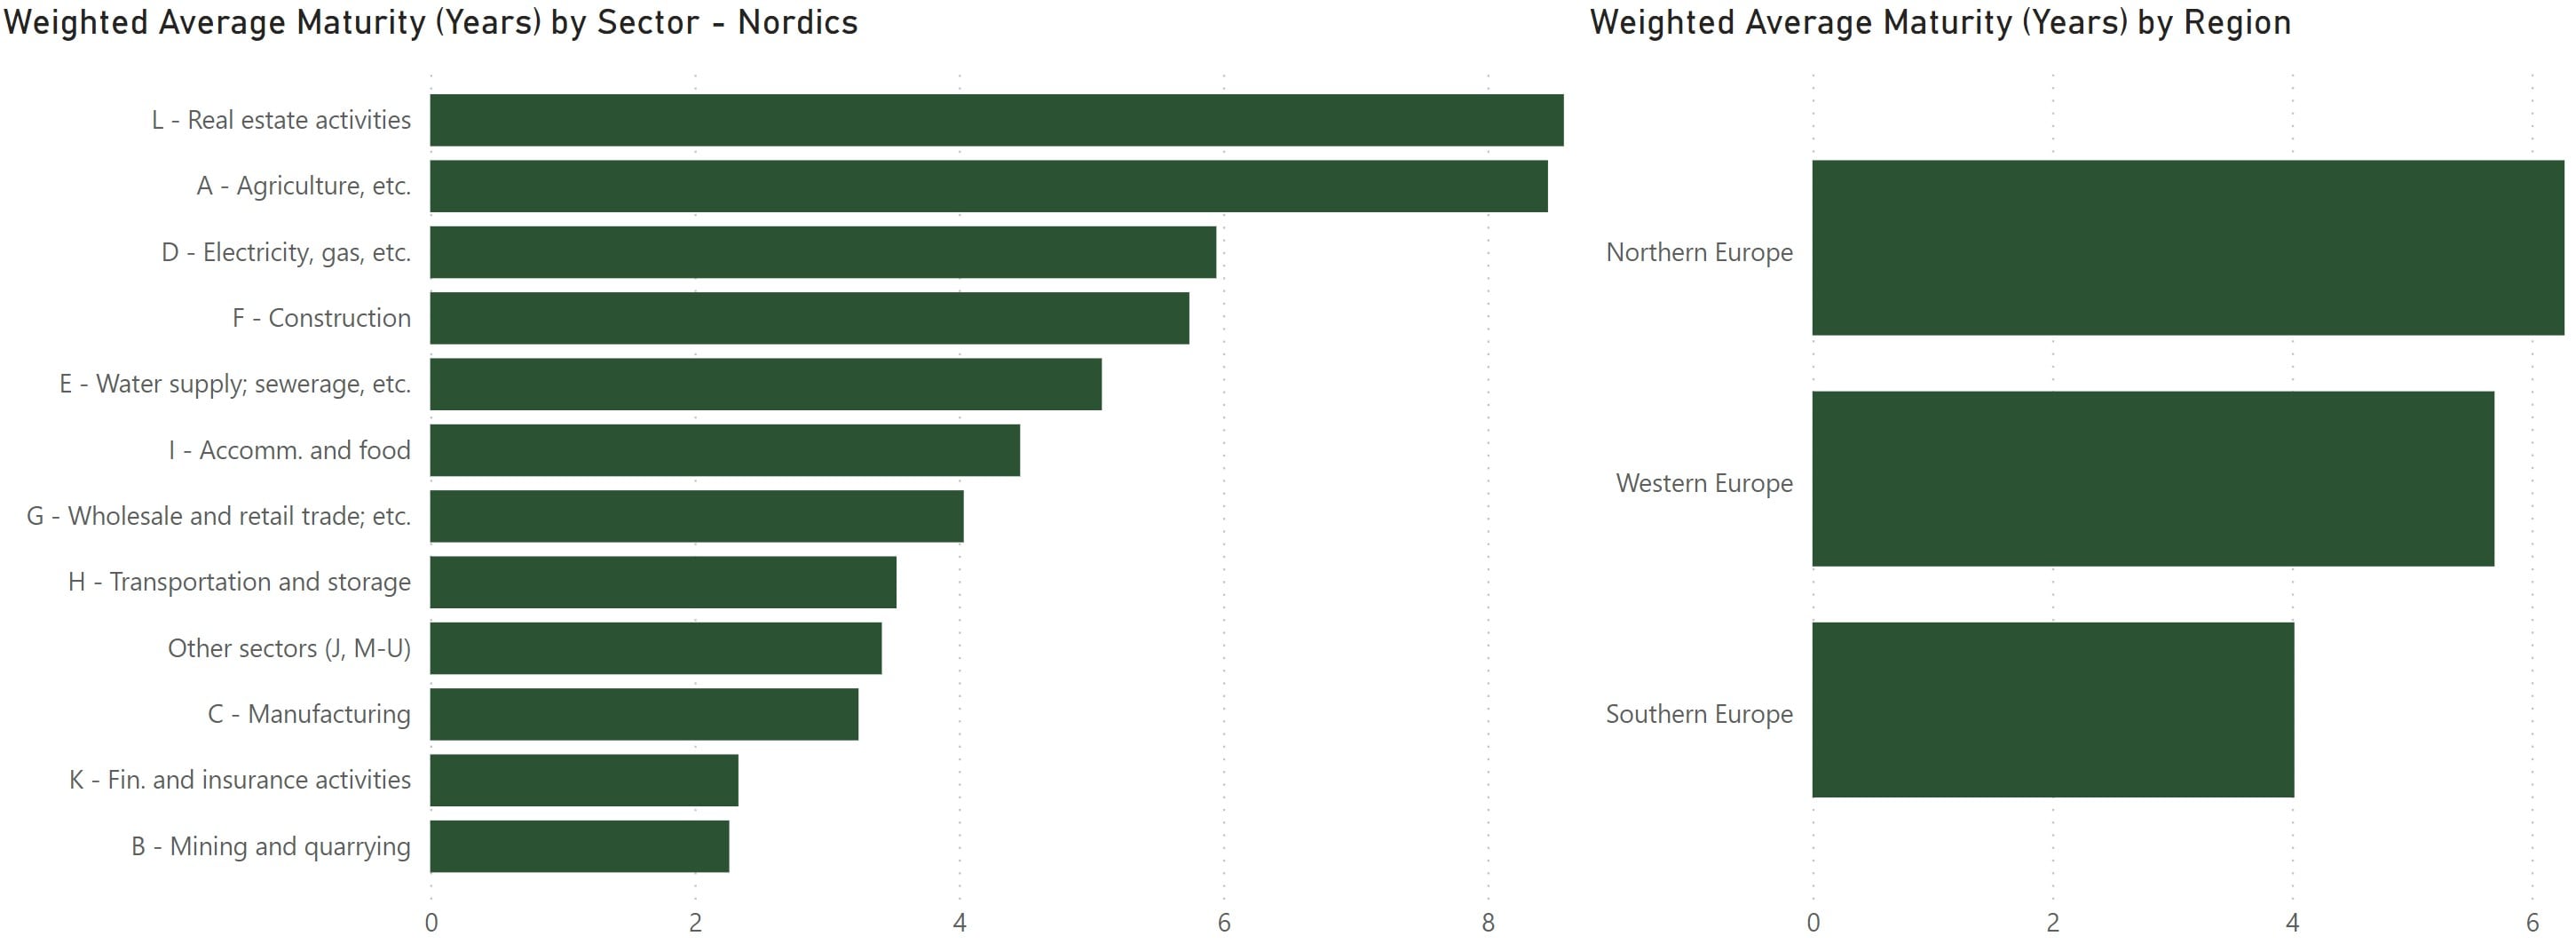
Financial assets with longer maturities can more likely be impacted by the physical and transition risks of climate change, so the sectors mentioned before would more likely be in the focus in the future as well. In addition, longer maturities can also increase the risk of carbon lock-in, as these loans can provide longer financing for carbon-intensive assets and projects.
Loans collateralised by immovable property – energy efficiency of the collateral
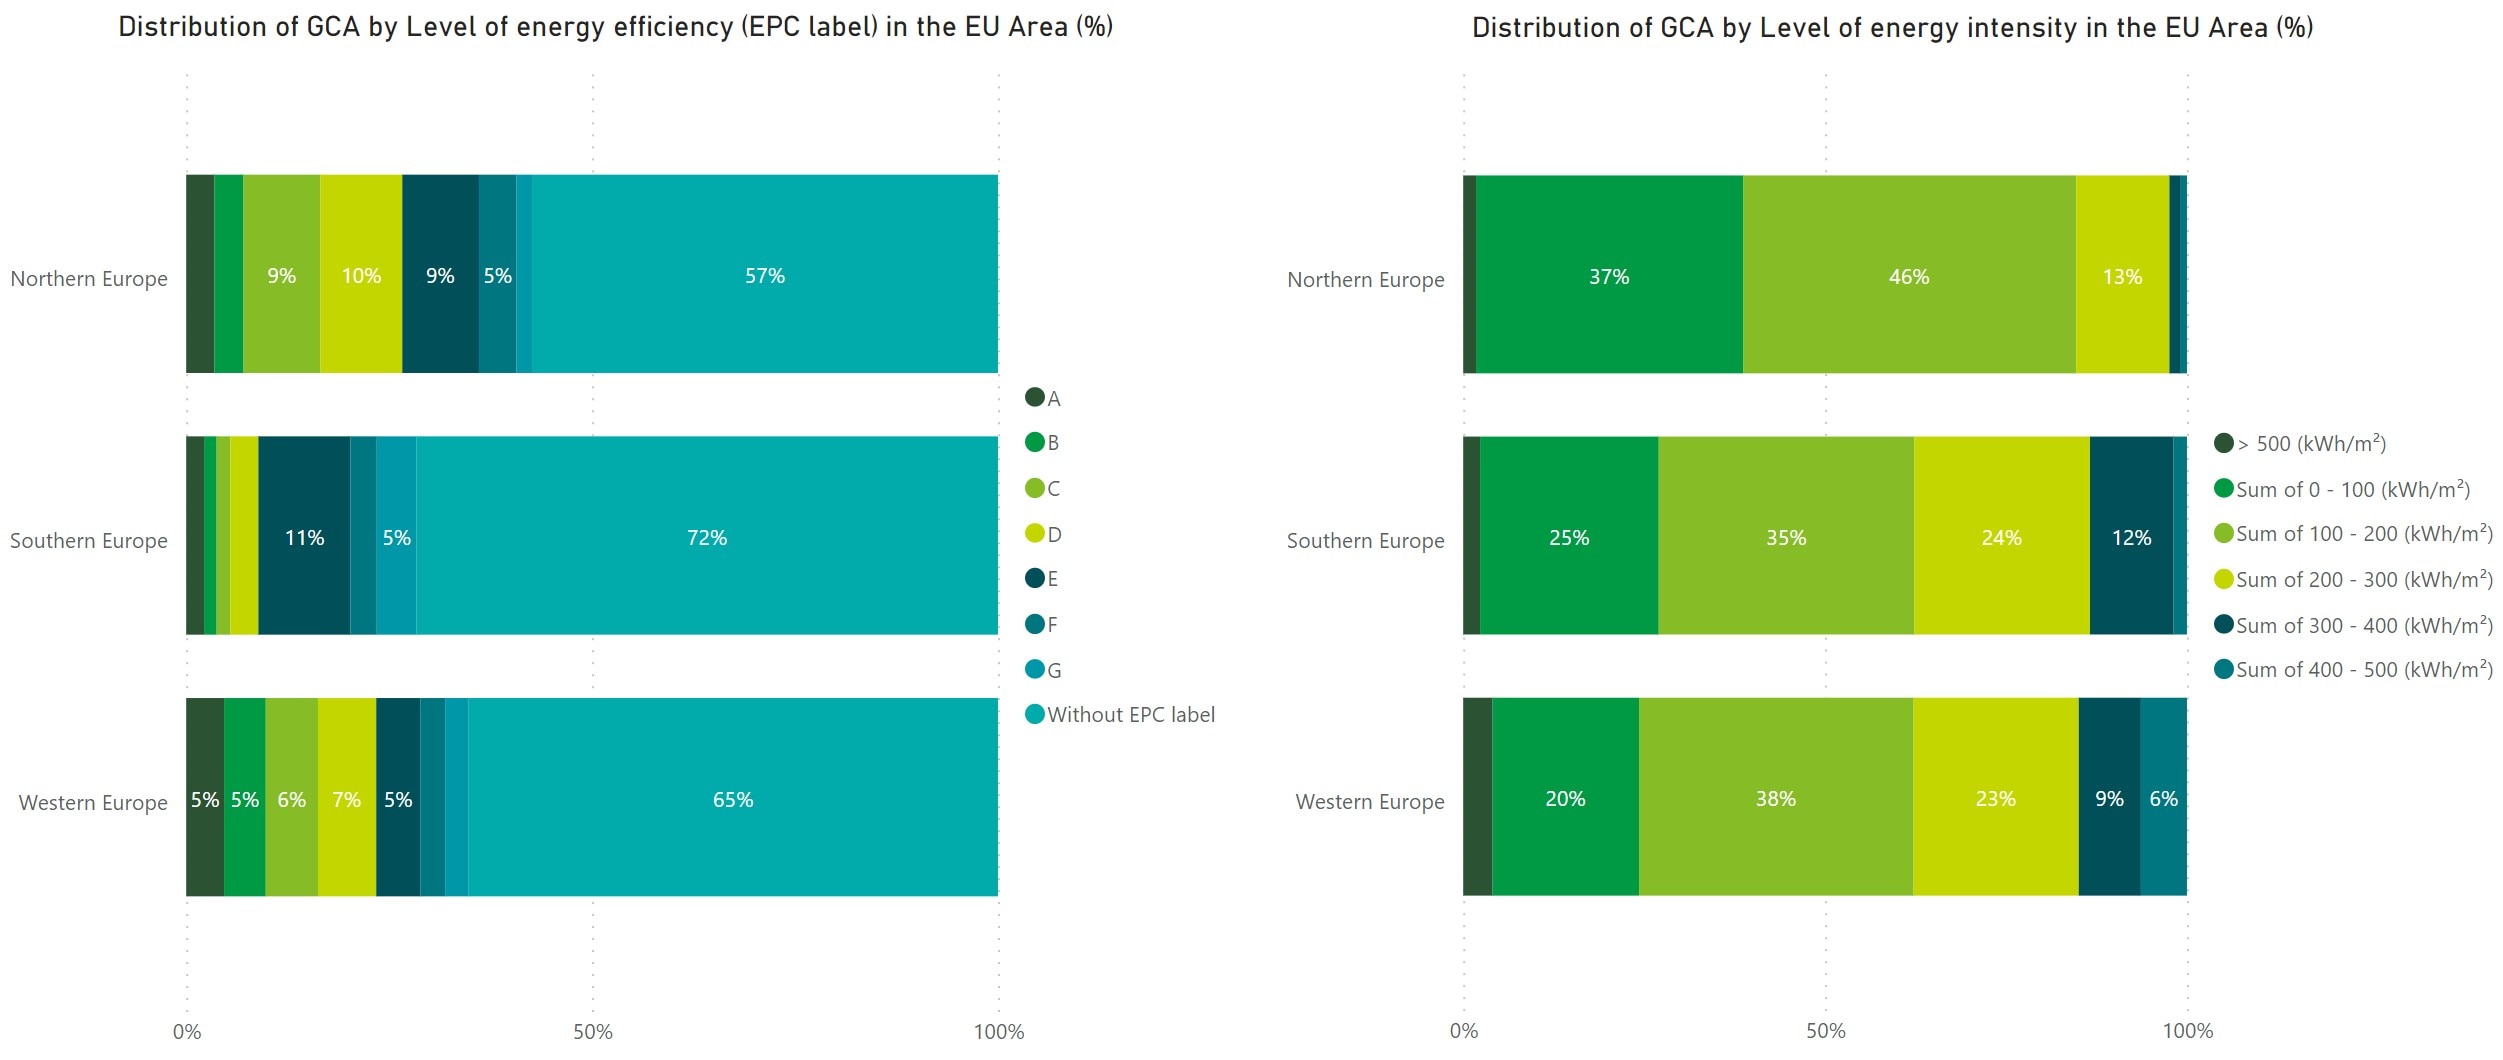
The energy efficiency in kWh/m2 is mostly concentrated between 100-200 and after that 0-100 and 200-300. Generally, the availability of EPC labels is low for banks’ loans collateralised by immovable property. On average, 57% of the GCA6 in the peer group is without EPC labels.
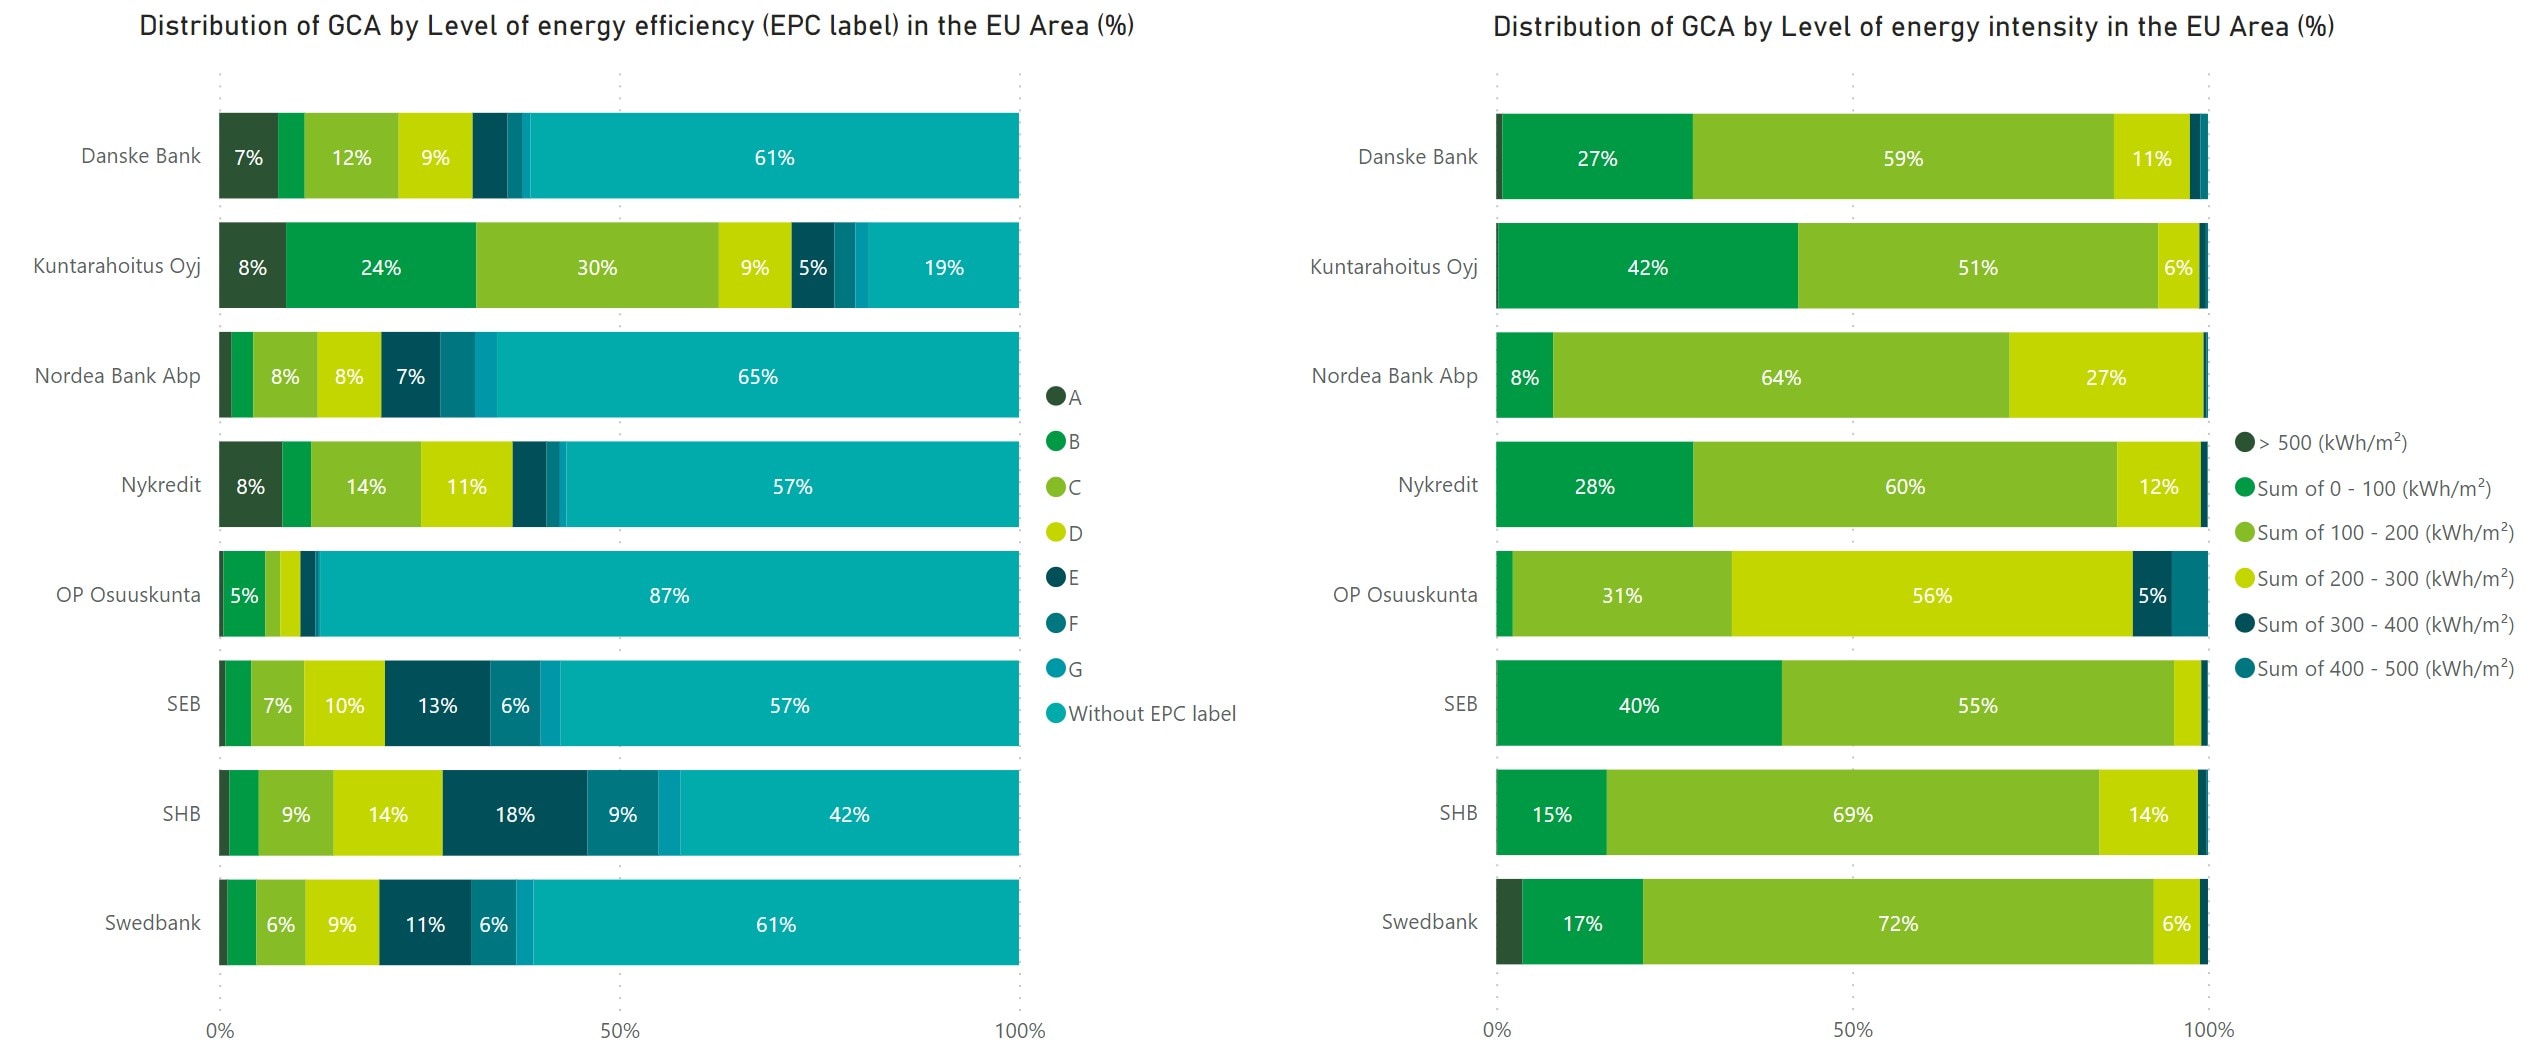
When comparing Northern Europe with Southern and Western Europe, both the availability of EPC7 labels and energy efficiency are higher in the Northern Europe. It is important to note that the actual energy efficiency data for EPC labels can vary across countries, therefore the geographical distribution of the loan portfolio can also influence these numbers. The methodology of using EPC labels can include the use of the latest available certificate or the worst EPC in the case of multiple certificates for a single property. If the EPC labels are not available, national averages from the PCAF database were used in many cases, according to the Nordic banks’ comments.
Exposures to top 20 most carbon-intensive firms
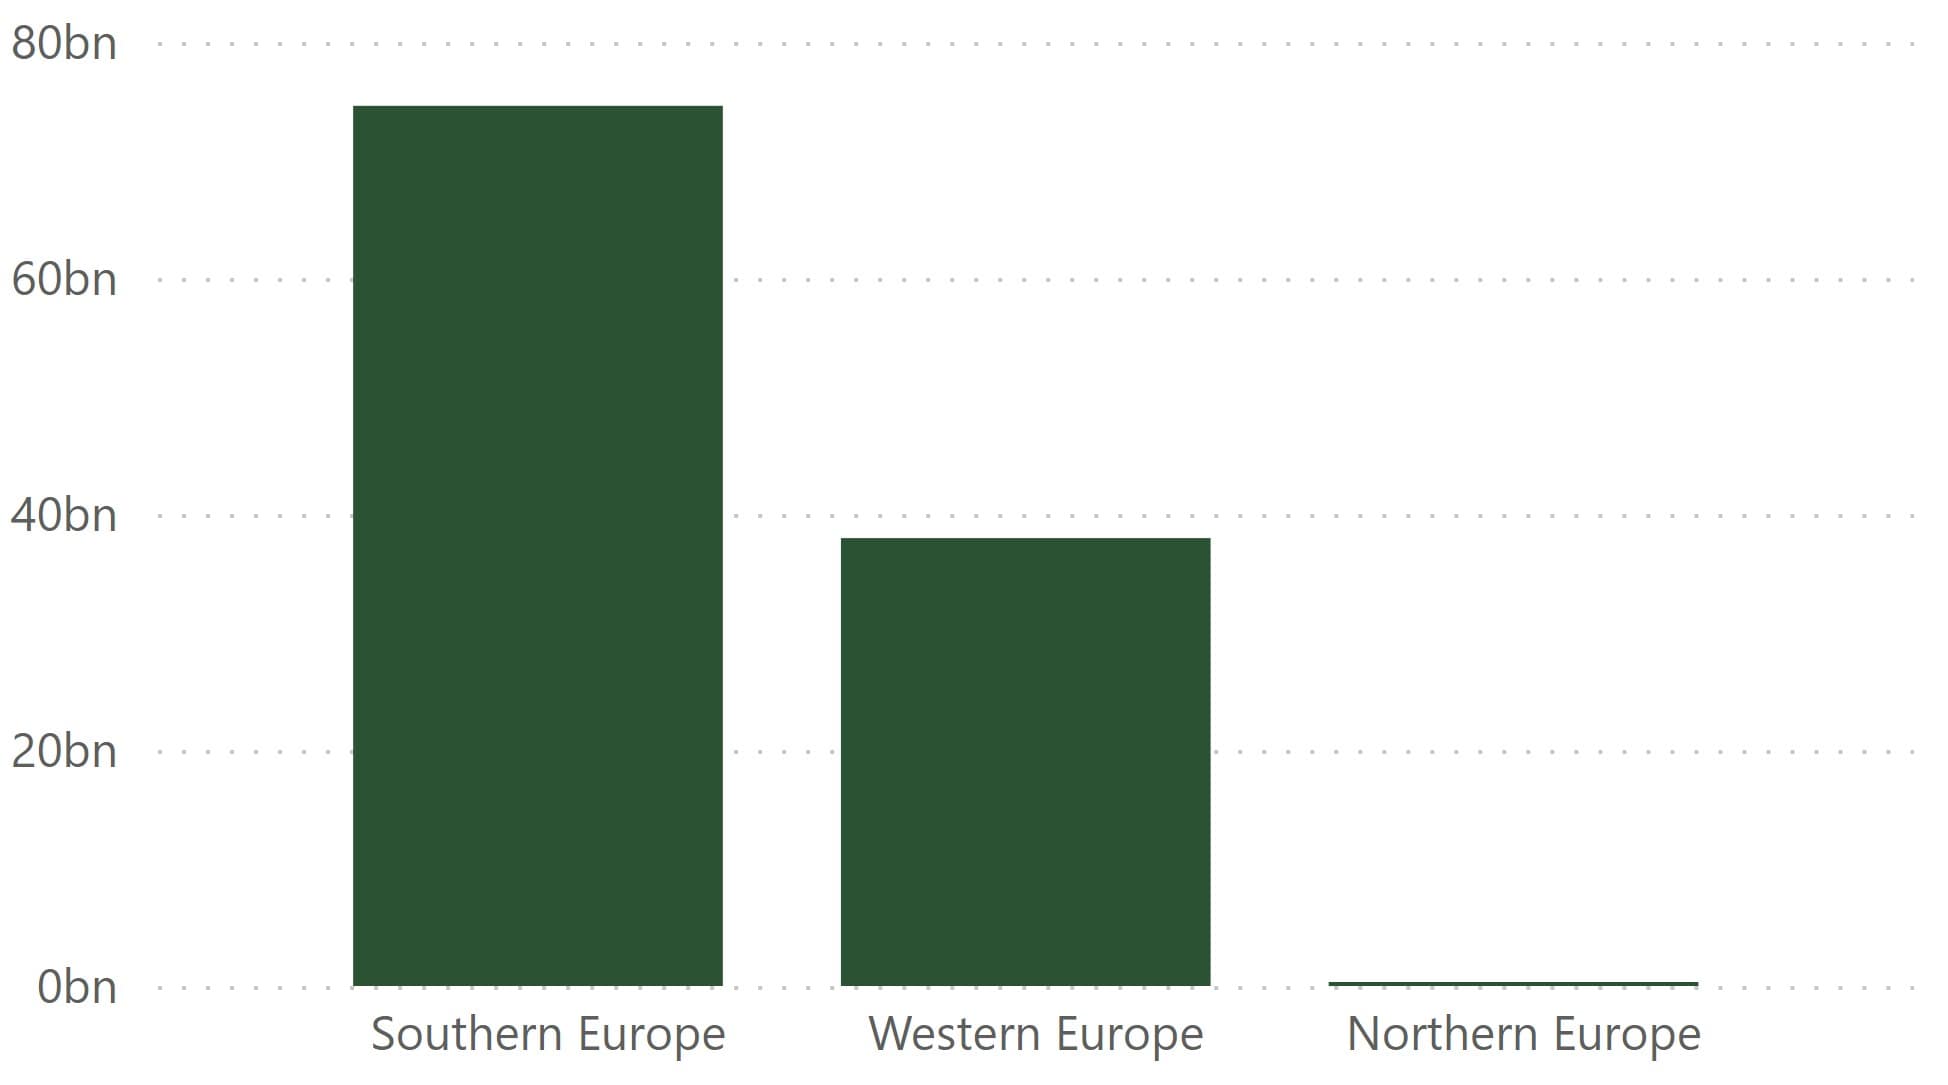
Since the top 20 carbon-intensive firms are most active in the bigger countries, mostly outside Europe, and their activities are related to the Power Plants, Petroleum and Natural Gas, Minerals and Chemicals sectors, the banks with a significant international presence reported such exposures. The geographical breakdown that is shown in the image below confirms our assumption that most likely Western and Southern European institutions have a significant presence at a global level, while the Northern European banks are active in their own region. The general methodological approach to define the largest polluters generally relies on the Climate Accountability Institute’s Carbon Majors Data Set, the Moody’s database combined Scope 1 and 2 emissions values, or the CDP’s Full GHG Emissions Dataset.
Exposures sensitive to climate change
Banks had to disclose the proportion of exposures sensitive to acute, chronic or acute & chronic climate change over the total GCA of the banking book. Most impacted sector in the peer group was “Loans collateralized by residential immovable properties”, for both acute and chronic climate change risks. However, exposures sensitive to acute climate risks are notably larger compared to chronic in all sectors. Volumes and sector distribution can be seen in the graphs below.
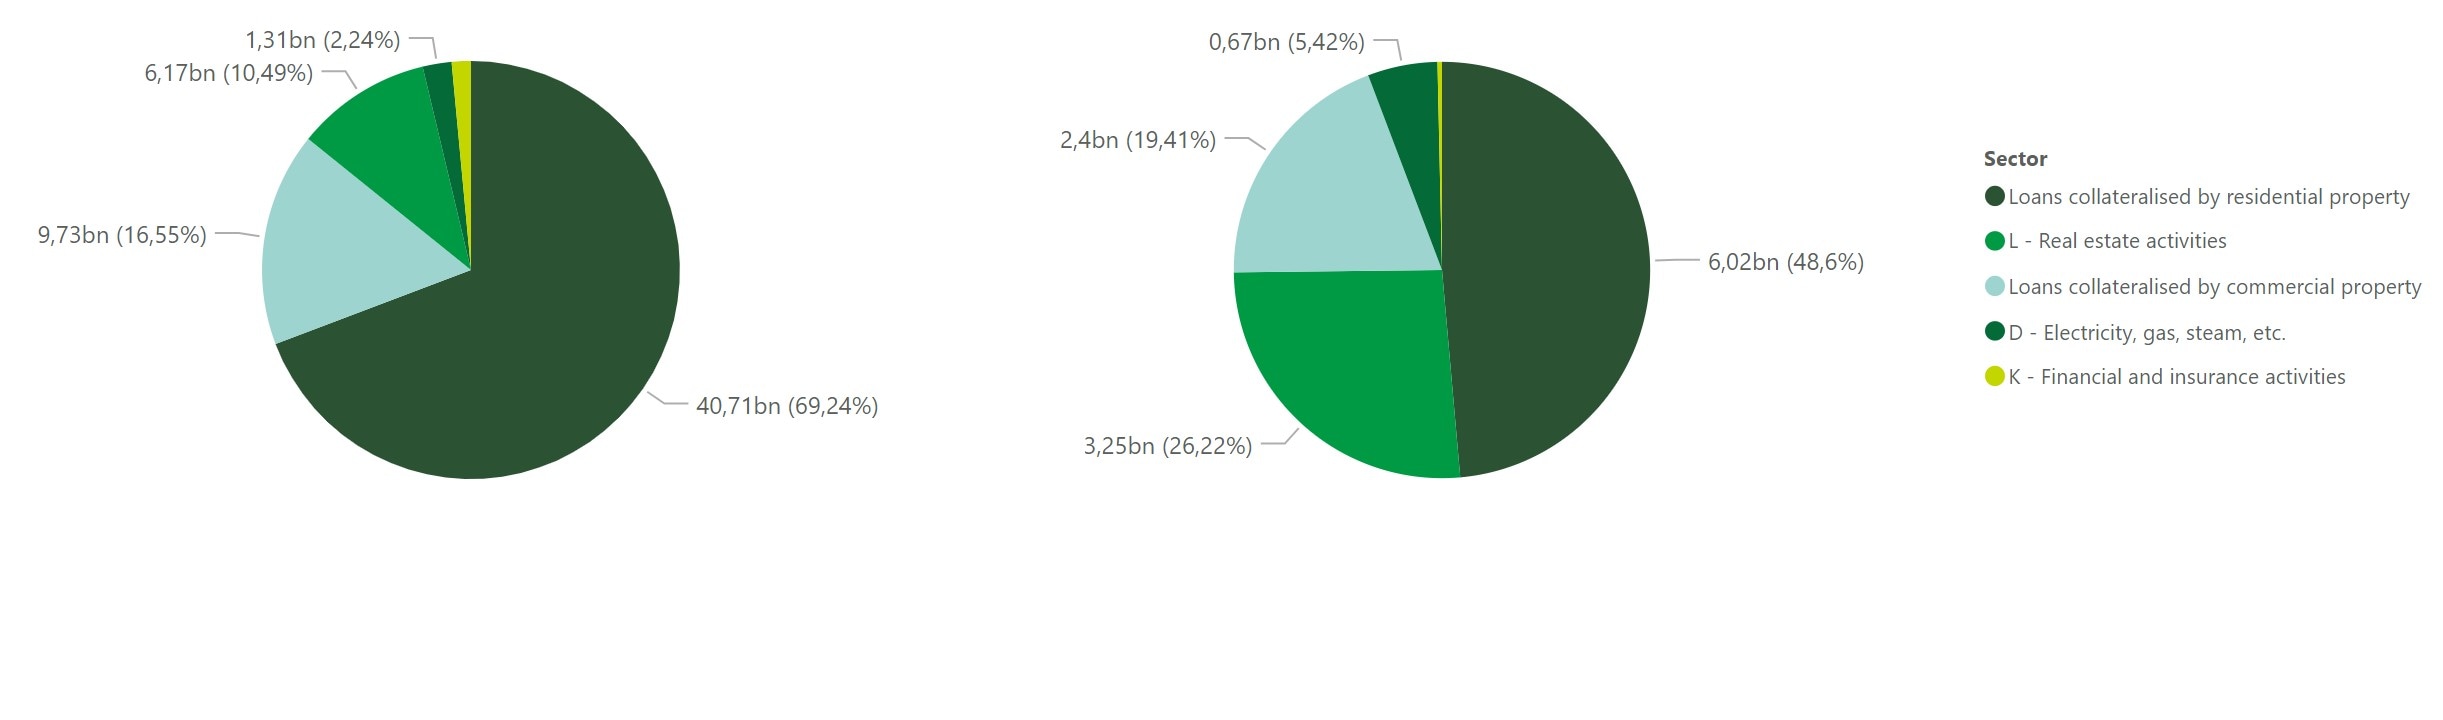
It is important to note that based on the reported information in the qualitative and quantitative disclosures banks define their climate change sensitive exposures differently. For example, some banks use a binary method (sensitive to climate or not), others use a rank ordering method (including an exposure as sensitive if it scores above a certain score out of 5), and others use the results from climate stress tests to inform the sensitivity based on different scenarios.
The banks typically utilise external databases such as Moody’s Climate Risk Assessment, the national authorities’ relevant maps and hazard data, and they usually consider the Representative Concentration Pathways (RCP) 8.5 scenario of the UN Intergovernmental Panel on Climate Change (IPCC), while the terms can vary from short to long term, even up to the year 2100. We expect more meaningful conclusions and comparisons will be available with time, as methodologies become more standardised.
Final takeaways
The first reports have provided initial insights and key trends of the banks’ ESG risks for regulators, investors and other stakeholders. As the reporting practices mature, the benchmarking analysis will be updated semi-annually to incorporate new data and trends. Furthermore, specific peer group analyses can be performed to offer clients across Europe tailored insights and lessons learned from data collection to solution implementation.
While financial institutions prepare for the implementation of new Pillar 3 reporting templates, we see potential challenges related to the regulatory interpretation, data availability and quality, and the experience to implement all the relevant reporting and disclosure criteria.
As a global advisor, Deloitte can support clients across Europe to navigate this rapidly changing area and implement best practices to stand out among competitors. We encourage our clients to have a forward-looking perspective and take proactive measures of preparing for ESG-related reporting.
1 Member states are the EU and EEA/EFTA countries: https://www.eba.europa.eu/about-us/organisation/board-of-supervisors/members
2 The peer group includes largest banks in Norway, Denmark, Sweden & Finland. DNB, the Norwegian bank, will disclose Pillar 3 ESG starting in 2024, therefore not included in this benchmarking analysis.
3 Partnership for Carbon Accounting Financials (PCAF) is a global partnership among financial institutions collaborating to establish a unified methodology for assessing and disclosing the greenhouse gas (GHG) emissions linked to their loans and investments.
4 Greenhouse gas emissions.
5 Northern Europe, according to definition of UN geoscheme classification, includes the following Irish banks: AIB Group plc, Bank of Ireland Group, AS LHV Group.
6 The Gross Carrying Amount (GCA) of a financial asset is the amortized cost of the financial assets, before adjusting for any loss allowance.
7 Energy performance certificates inform consumers about the energy efficiency of buildings, offering an energy performance rating and suggestions for cost-effective enhancements.
As global advisor, Deloitte can support clients across Europe to navigate the regulatory requirements and implement best reporting practices.
Industry: Financial Services
Get in touch with us