
Have US households adequately deleveraged? Economics Spotlight, September 2018
22 September 2018
Ten years since the 2008 recession, consumer debt is making a reappearance. But exactly how financially well-positioned are households to take on more debt amid persisting uncertainties?
Consumer spending has always been the primary driver of US economic growth and this recovery has been no different. Thanks to the painful deleveraging process that US households have undergone in the decade after the global financial crisis, consumers are now in a better position to increase spending.1 A recent study by Deloitte drew attention to the return of consumer debt—that is, consumers purchase goods and services today that they will pay for in the future.2 However, there are economic risks associated with substituting current spending for future spending and therefore future growth. It also raises several questions: Are consumers financially well-positioned to buttress growth in the long run despite uncertainties? How have their balance sheets improved after a decade of deleveraging? Which households are well-positioned financially to take on more debt to finance their future spending?
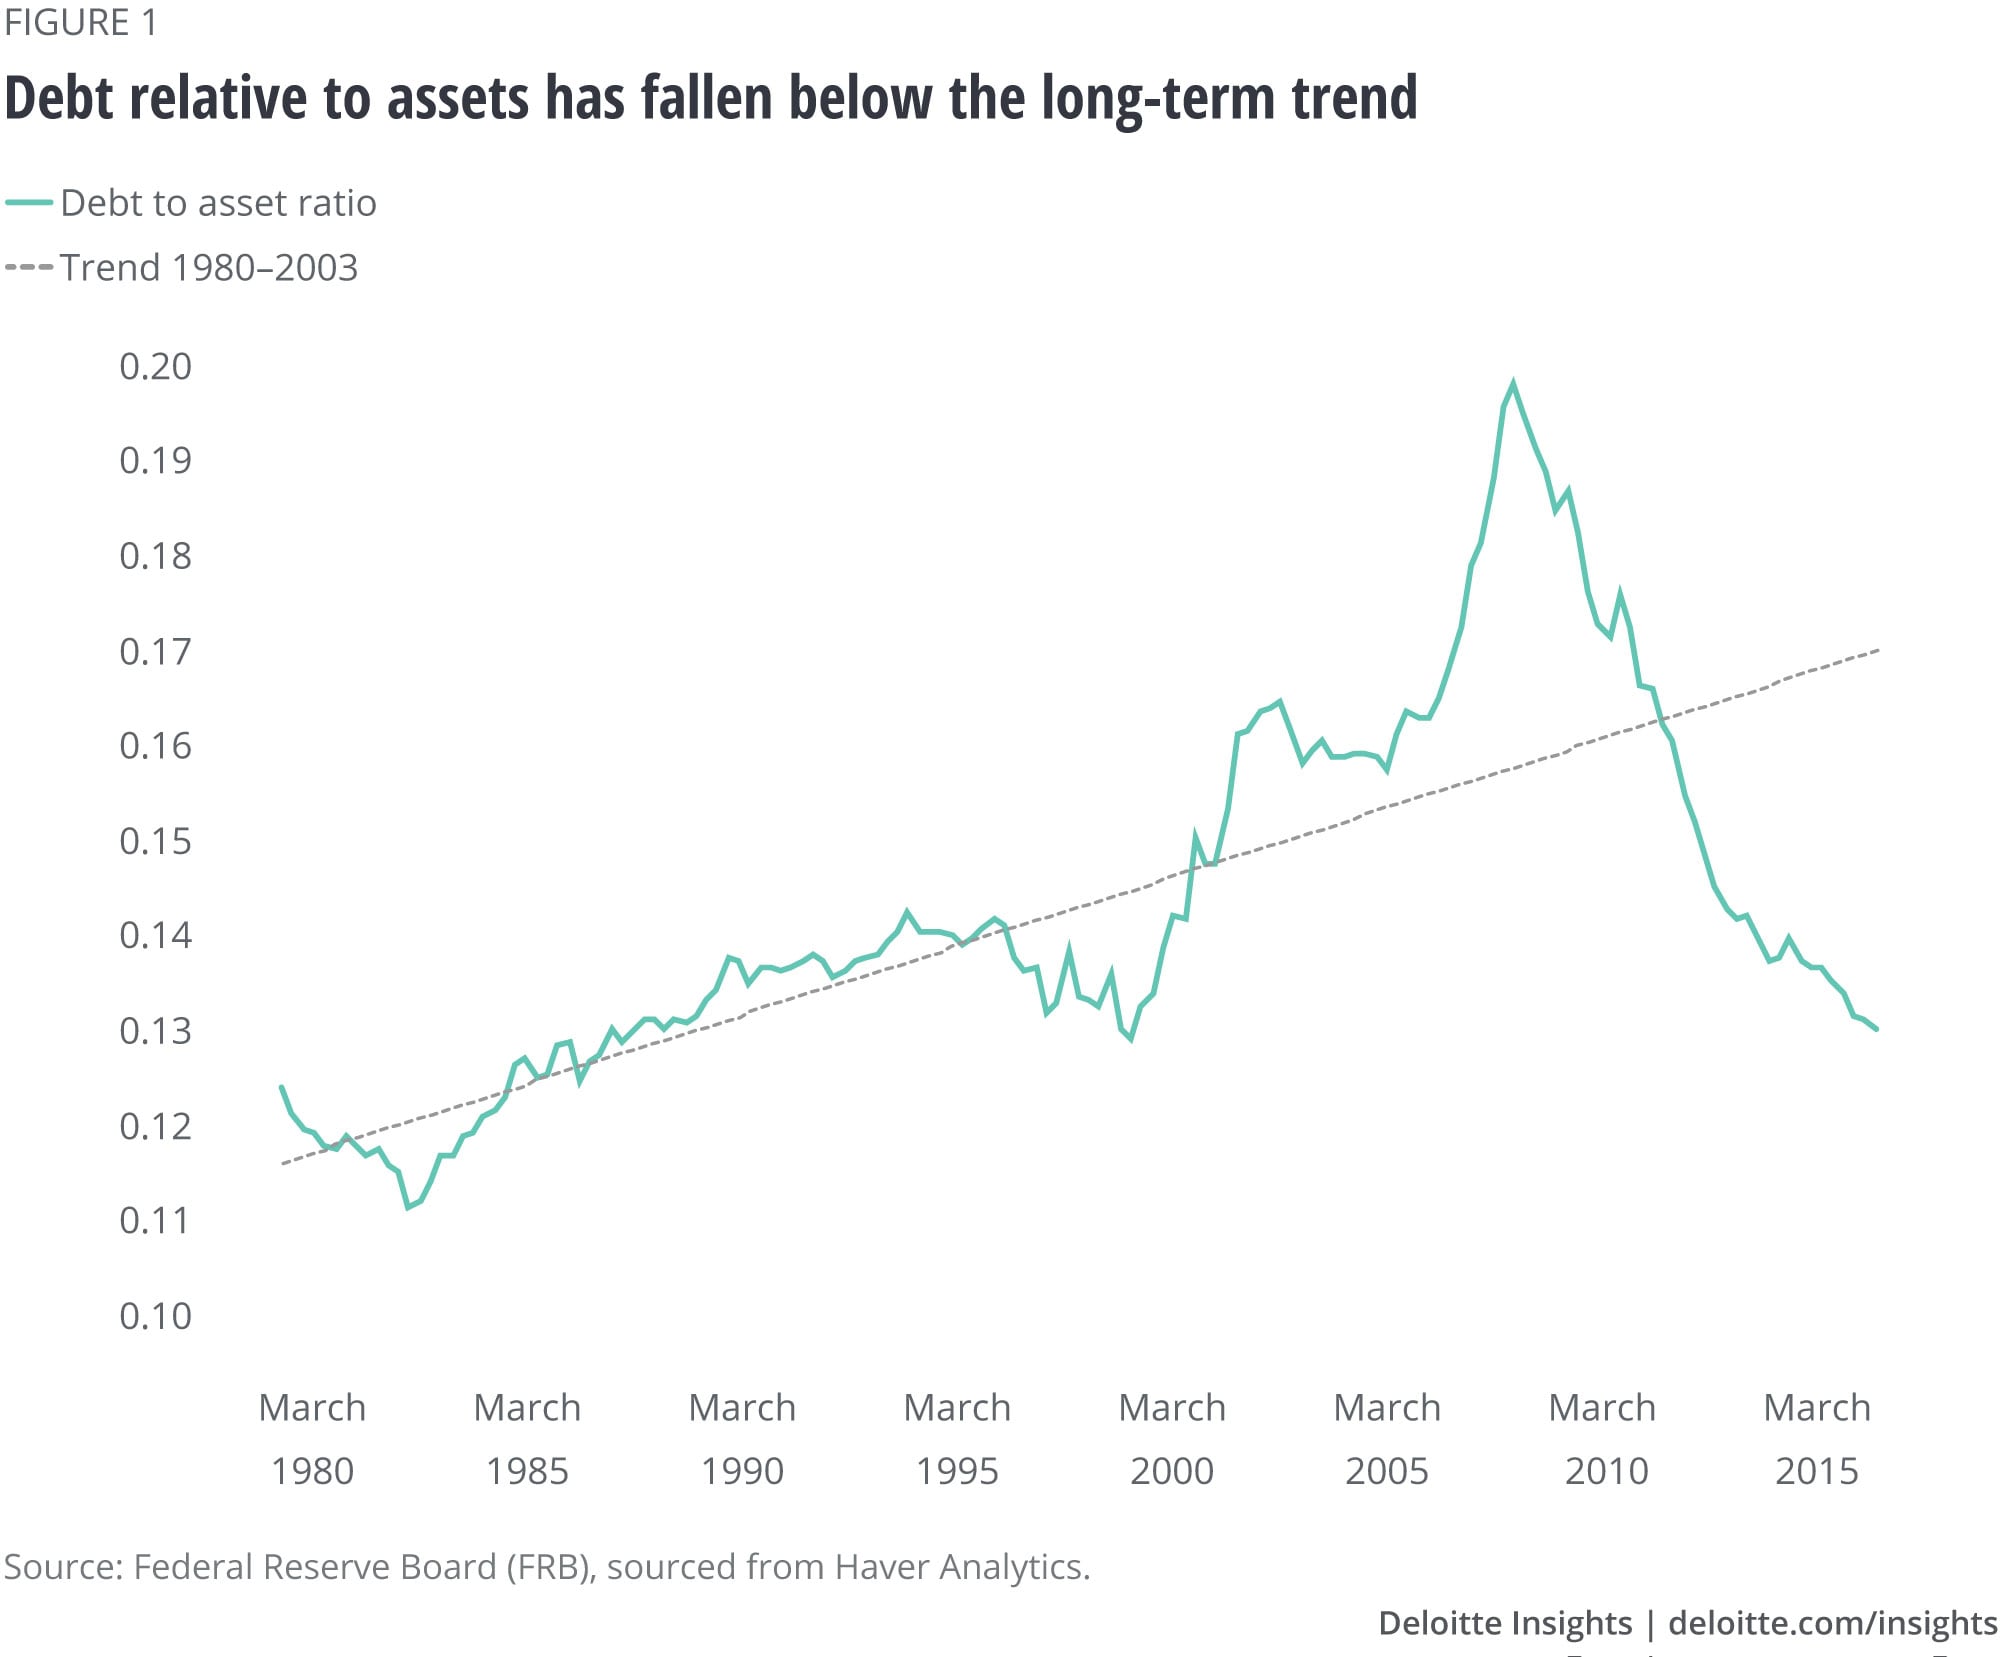
Balance sheet adjustments in the household sector have been a prominent feature in the United States during the crisis and the subsequent recovery. Prior to 2001, the household leverage ratio, which indicates the level of debt held by households and measured by the household-debt-to-asset ratio, rose steadily owing to increased access to mortgage and consumer credit and reduced savings as interest rates trended down (figure 1). However, during 2003-08, consumer spending and the pace of debt accumulation rapidly grew because of easy credit conditions and rising house and stock prices pushing the leverage ratio to unsustainable levels, making households more vulnerable to financial shocks. With the onset of the 2008 crisis, house prices plunged and asset values fell, causing the leverage ratio to spike. With access to credit drying up because of tightening lending standards by banks and financial intermediaries, consumers were forced to reduce new borrowing (and in many cases default on mortgages and other types of credit), resulting in deleveraging. A decade since the deleveraging process started, the debt-to-asset ratio has now reached the levels seen in 1990s and is much below the long-term trend calculated over the period 1980-2003 (figure 1).
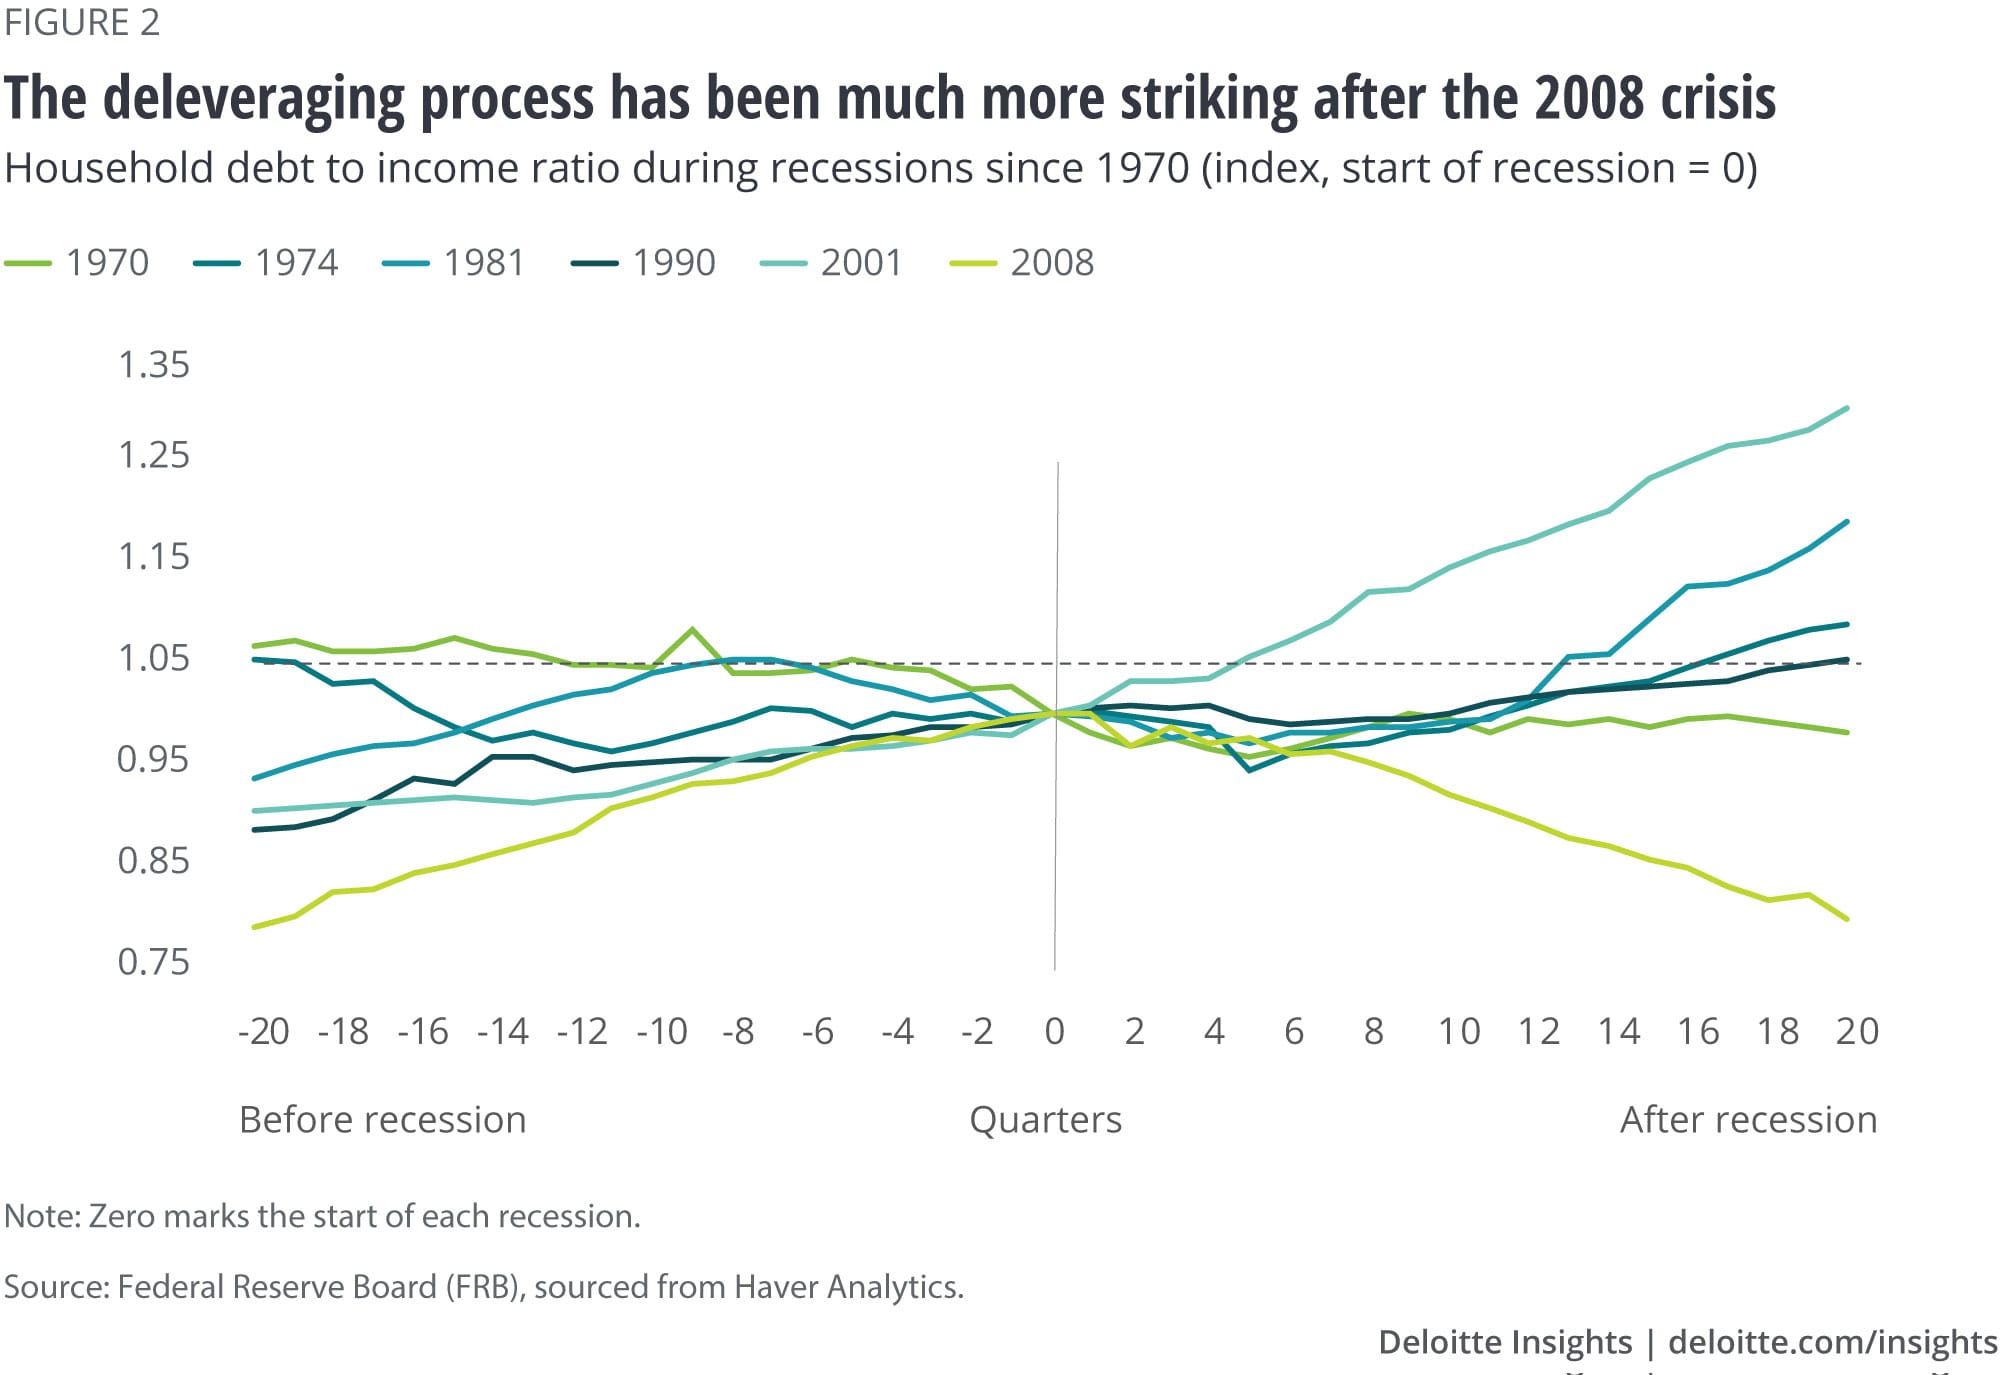
An alternate measure of household leverage, household-debt-to-income ratio, shows a similar trend. After a strong build-up in debt relative to personal disposable income before the crisis, the ratio came down at a rapid pace. When compared to prior recessions, the correction in the ratio appears to be much more striking after the 2008 crisis (figure 2). That said, the swing in the household-debt-to-income ratio (that is, the pace of increase in debt and the correction that followed) has also been the greatest in this most recent crisis relative to previous ones. Even after 20 weeks from the beginning of the 2008 crisis, the debt-to-income ratio of households continued to deleverage, either because of paying down or paying off, but primarily through default.3 This ratio had started rebounding by this time in all prior recessions.
A bulk of the decline in household debt has been in mortgages, which accounts for the lion’s share of household debt (figure 3). Even the share of mortgages in total debt has come down from its peak of 76 percent during the crisis to 68 percent in 2017. The decline in mortgage debt corresponds to a decline in homeownership rates.4 Consumer credit, comprising credit cards, auto loans, student loans, and other household debt, also declined after 2008, but has lately been rising as banks are more willing to lend to consumers. The share of consumer credit has gone up from 19 percent in 2008 to 26 percent in 2018, indicating the return of consumer debt.5

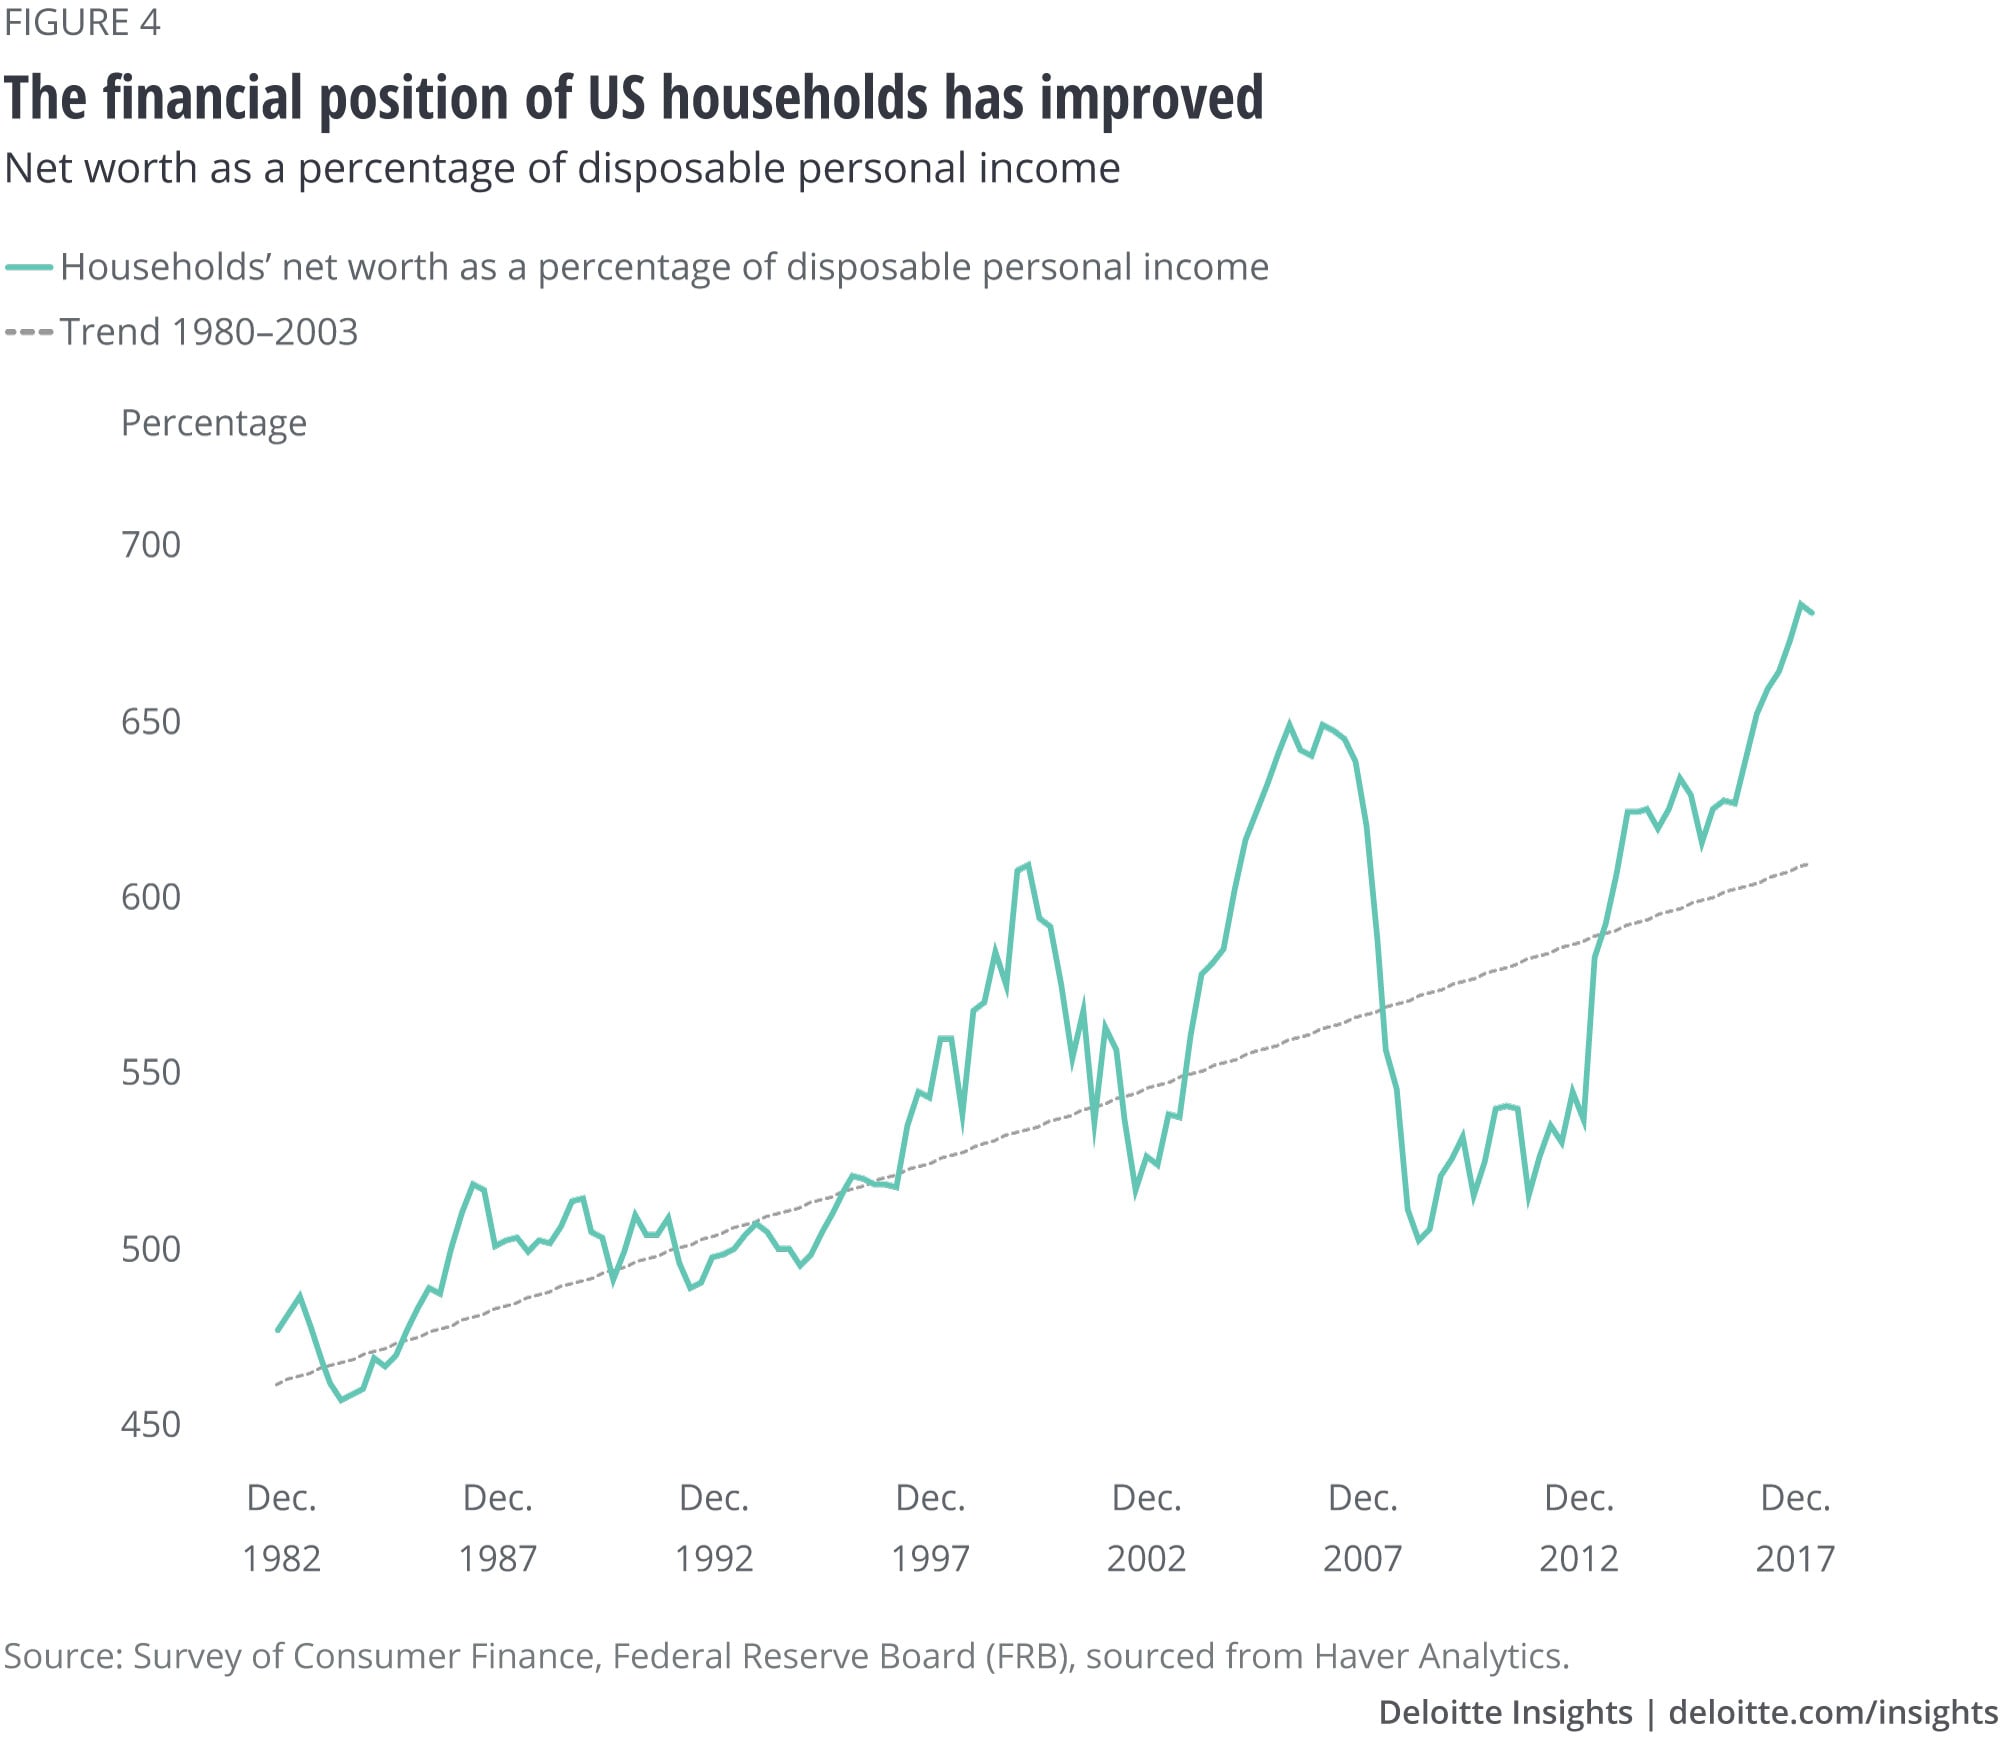
Deleveraging has likely improved the financial position of US households. The sustained reduction in household debt and improved stock prices have improved US households’ net worth relative to their income ratio, so much so that the ratio has increased much higher than the peak reached during the 2008 crisis, when the housing bubble and asset valuations were at their zenith (figure 4). The levels have even crossed the net-worth-to-income ratio trend spanning the period 1980–2003, suggesting that households have over-deleveraged and are well-positioned to spend more and take on more debt.
Deleveraging across different segments of households
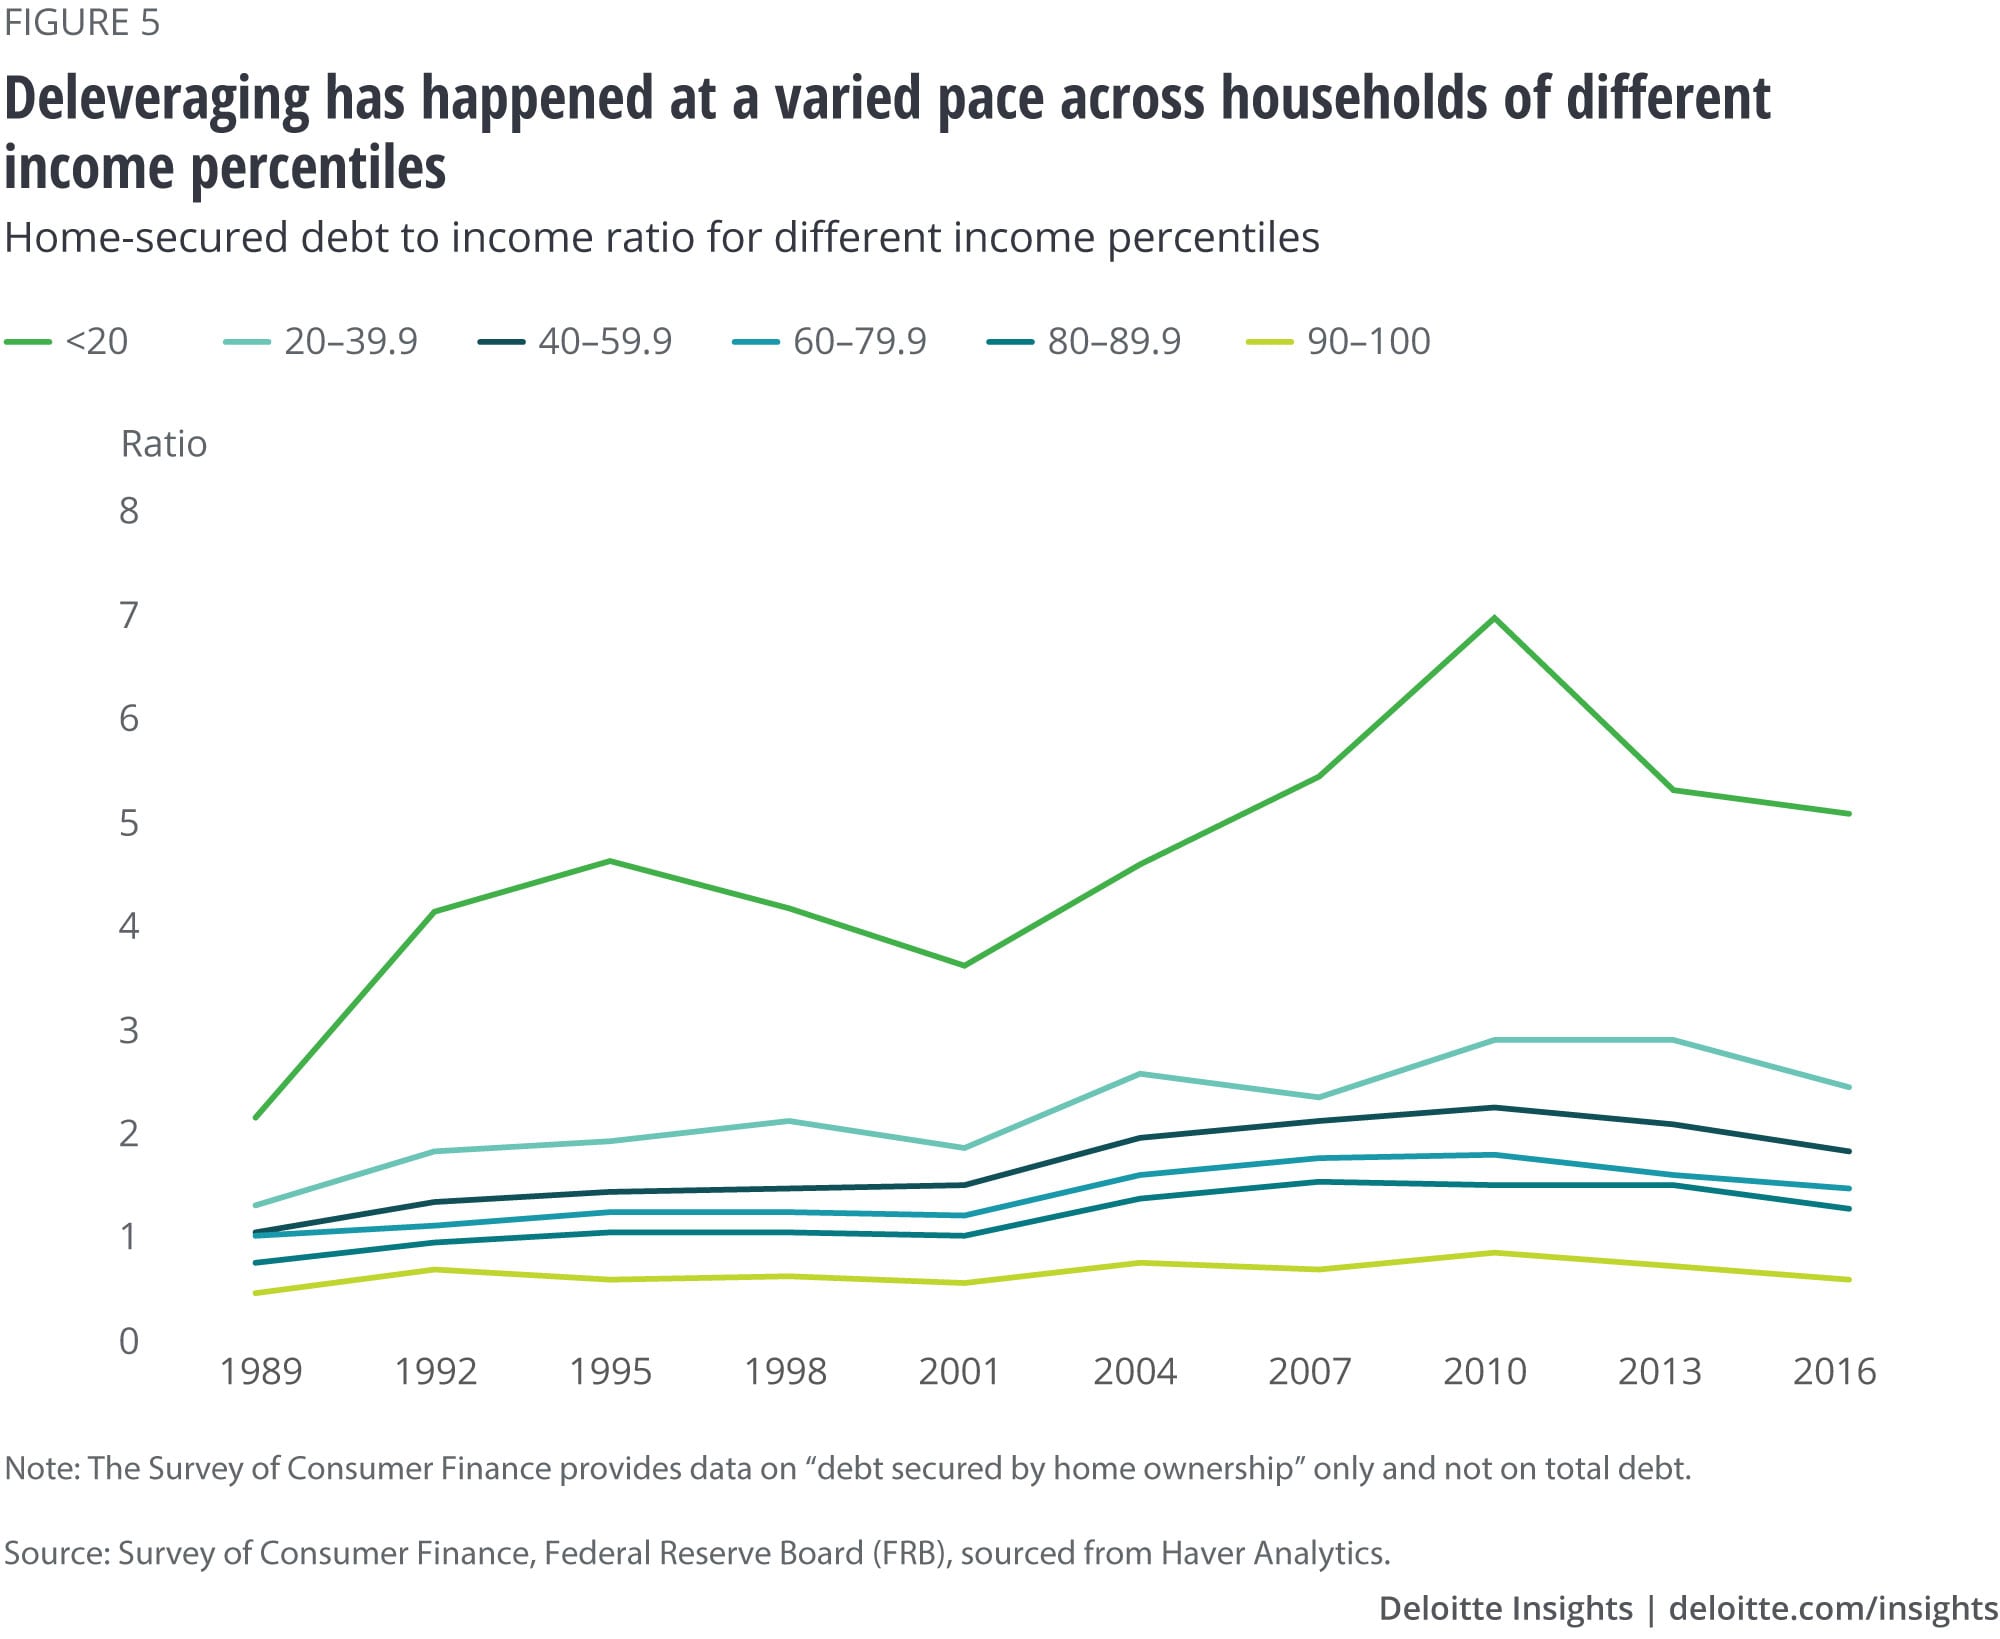
While the leverage ratio has come down at an aggregate level, deleveraging has happened at a varied pace across households of different income percentiles. According to the survey of consumer finance conducted by the Federal Reserve board, many households belonging to the lower income percentile witnessed a sharp increase in the household-debt-to-income ratio during the crisis (figure 5).6 While these families have deleveraged since 2008 and the ratio has fallen back to their pre-crisis levels, they still have some more deleveraging to do.
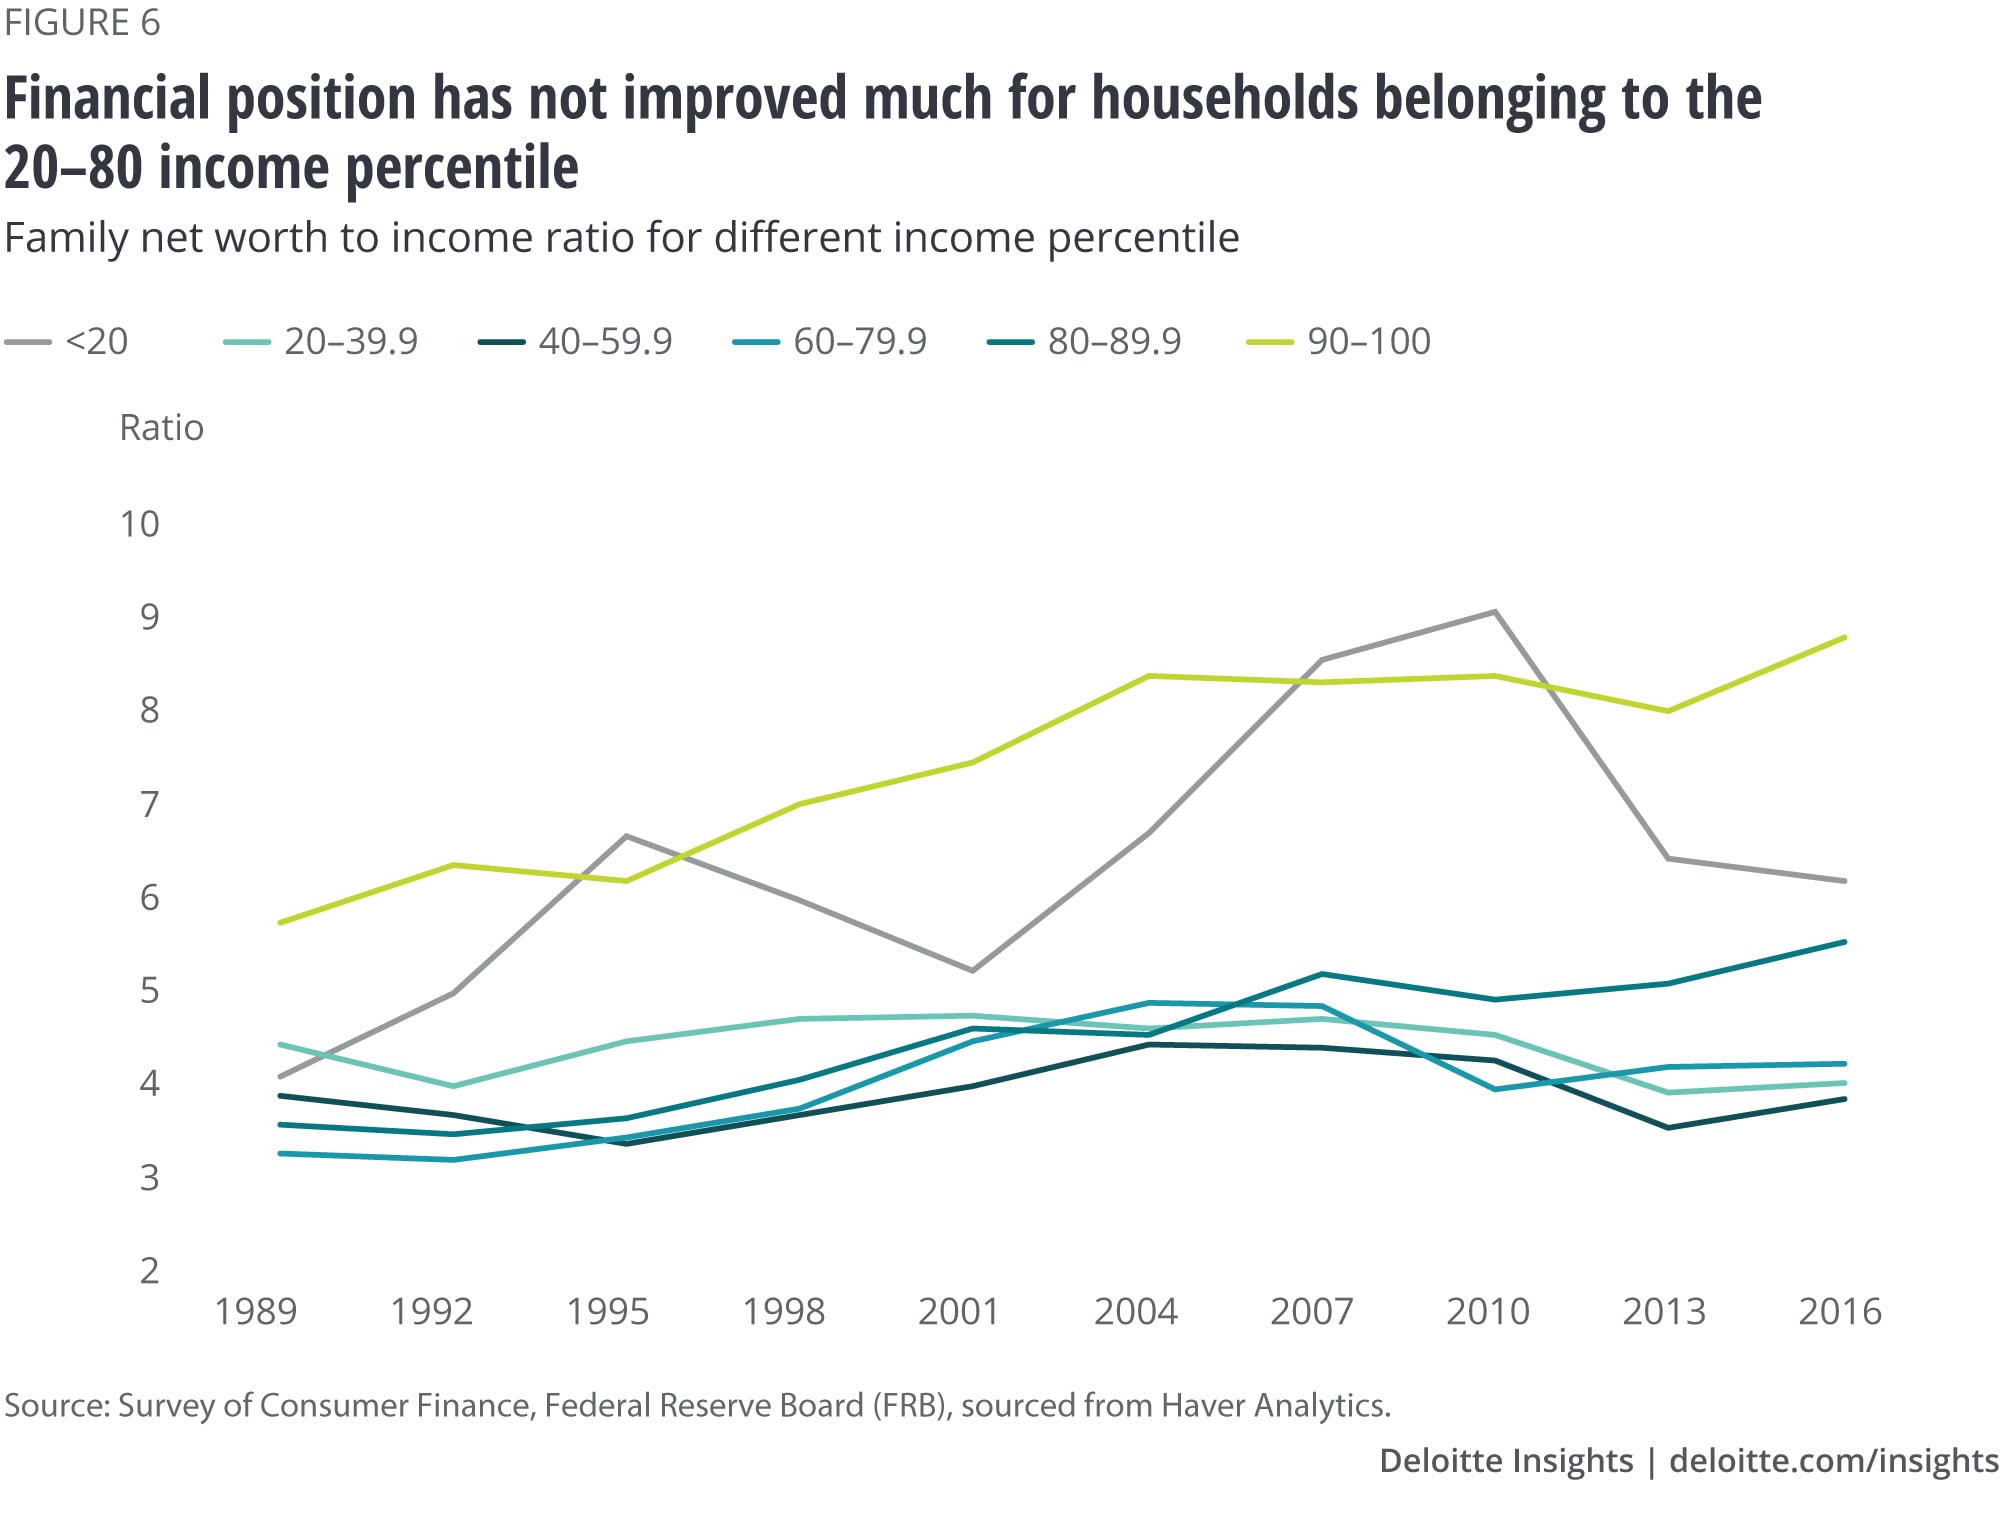
Apart from a slight correction during the 2008 crisis, many households belonging to the high-income percentile (greater than 80) have seen a steady improvement in the net-worth-to-income ratio (figure 6). On the other hand, households in the 20–80 income percentile have not been able to improve their financial position much as the ratio remains below the pre-crisis levels. Interestingly, families belonging to the lowest income percentile have a relatively better net-worth-to-income ratio, despite a sharp fall in this ratio post the crisis and the prevailing high debt-to-income ratio.
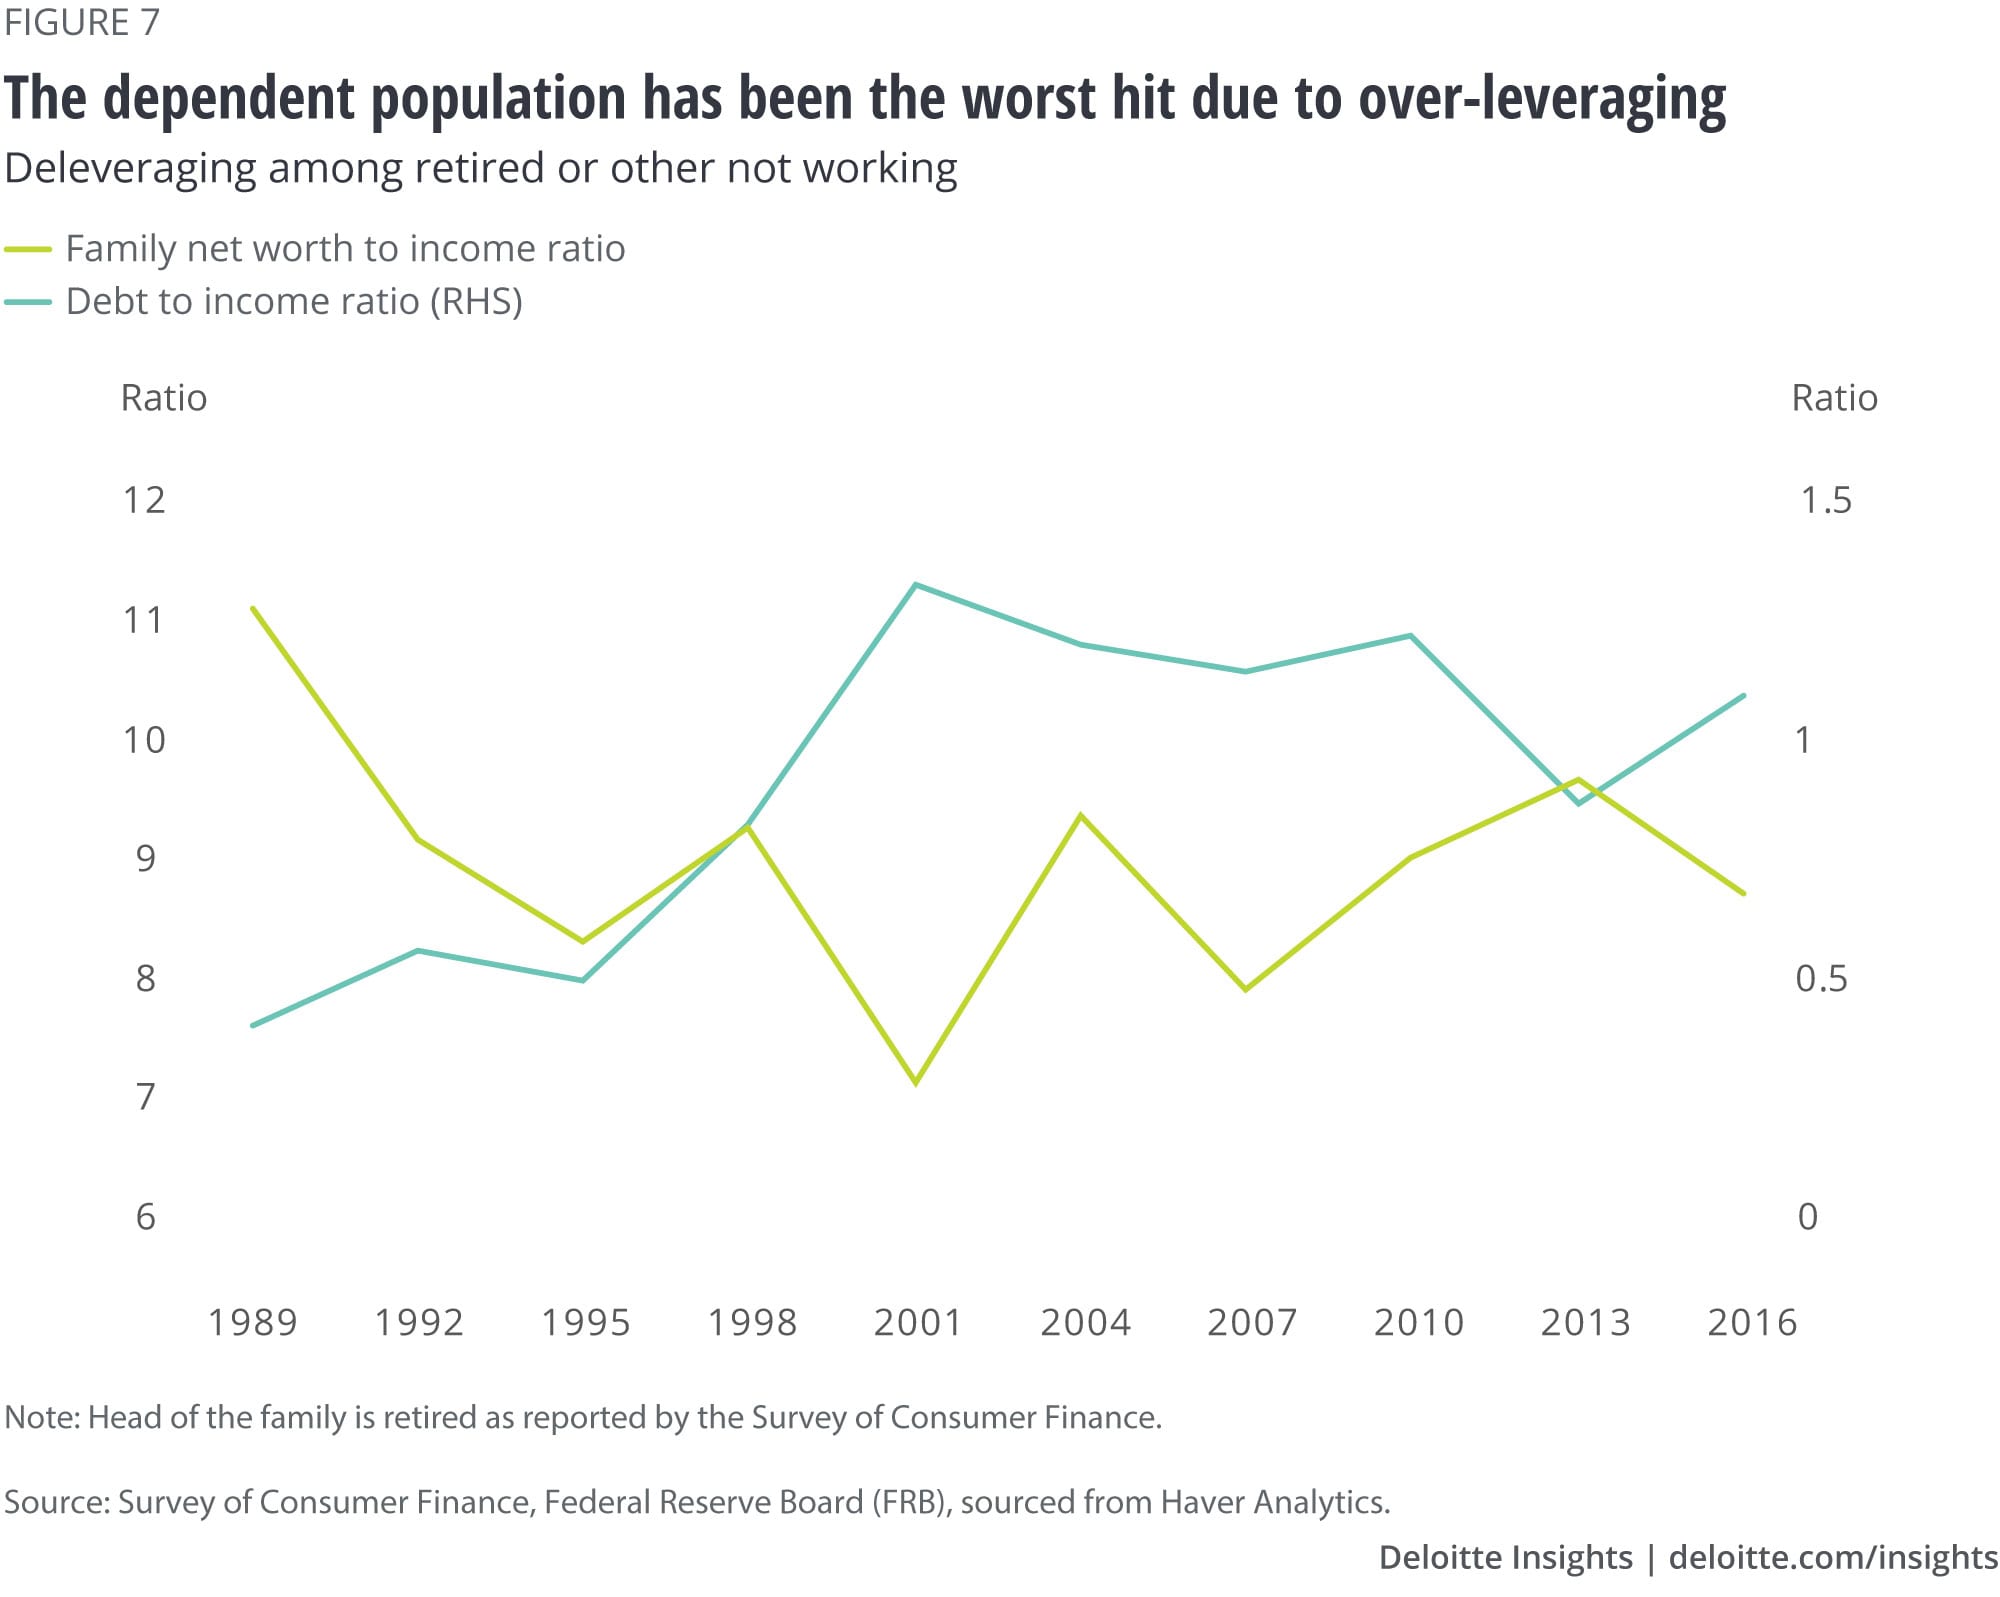
The dependent population, such as those who are retired, suffered heavily due to over-leveraging prior to the 2008 crisis (figure 7). The debt-to-income ratio shot up during the crisis, because of which these households had to deleverage quite sharply. Their net worth-to-income ratio also suffered and is yet to reach the pre-crisis levels.
Clearly, the household sector deleveraging is well advanced to the point where this process no longer poses a significant downside risk to growth. Consumers may be more willing to run their leverage ratios up to catch up on the expenses they have postponed so far. If they do so, consumer spending will likely continue to be an engine of growth in the next few quarters. However, with imminent uncertainties on the horizon owing to deteriorating economic conditions and rising costs due to changing trade policies, consumers may take an alternate route—that is, refrain from excessive spending as the painful experience of deleveraging still lingers fresh in their minds.7
© 2021. See Terms of Use for more information.


