


United States Economic Forecast has been saved

United States Economic Forecast 2nd Quarter 2017
13 June 2017
However much we’re urged these days to embrace unpredictability, every decision maker in business craves certainty. And lately, volatile headlines have made it difficult to plan ahead. But notwithstanding promised changes to taxes and more, the US economy will likely stay more or less on track.
Introduction: The shrinking policy space?
Every presidential election comes with a certain amount of uncertainty, since no one knows for sure how a new administration will be able to reconcile campaign pledges with legislative priorities. And the past few months have arguably been unusually fluid, with open questions remaining on major issues including tax cuts, health care, and infrastructure investment.
As anyone who skims a daily newspaper is all too aware, the policymaking process in Washington isn’t running especially smoothly lately. Narrow Republican majorities mean that the party’s ideologically diverse caucus must govern by consensus—a challenge even in the calmest of times. And even without the distractions of investigations and hearings, legislators’ decision to make tax cuts dependent on health care reform created a kind of policy traffic jam, narrowing the lanes for significant policy actions in 2017.1 (Note that as economists, we have no opinion about whether this was lawmakers’ optimal path.)
Of course, uncertainty is the bane of forecasters as well as of executives looking ahead to try to anticipate changes in regulations, taxes, trade, consumer demand, and more. So we’ve had to hedge our outlook a bit.
Our baseline forecast remains optimistic that some regulatory policy changes will lower business costs, and that an infrastructure spending plan will add about $125 billion to the economy in 2018 and ’19. We have removed the tax cut from our baseline (although it remains in the faster-growth scenario). This reflects the views of Deloitte’s tax policy practitioners, who are currently pessimistic about the possibility of significant tax reform in 2017. We continue to assume (in the baseline) that no significant changes occur in the international trade regime.
Economic policy shifts in limbo do not necessarily mean trouble for the economy. Current conditions are quite positive, and, in our baseline forecast, we assume substantial labor force growth as the labor market tightens, as well as a rebound in productivity growth to the 1 percent range. As long as policy does no damage—for example, through a government shutdown over the 2018 budget and/or the need to raise the debt ceiling—most Americans are likely to find economic conditions to be relatively good. The latest headline-grabbing developments in the nation’s capital seem unlikely to change that.
Scenarios
Our scenarios are designed to demonstrate the different paths down which the new administration’s policies might take the American economy. Foreign risks have not dissipated, and we’ve incorporated them into the scenarios. But for now, we view the greatest uncertainty in the US economy to be that generated within the nation’s borders.
The baseline (55 percent probability): Uncertainty restrains business investment in early 2017, but infrastructure spending pushes up GDP in 2018 and ’19. With the economy at full employment, the faster GDP growth creates some inflationary pressures. A small increase in trade restrictions adds to business costs, but this is offset by lower regulatory costs. Annual growth rises to 2.5 percent before falling off as the impact of the stimulus fades.

Recession (5 percent): Policy moves in the United States, Europe, and China trigger a global financial crisis. The crisis is exacerbated by a large rise in global supply chain cost structures from higher US trade barriers, as well as retaliation from other countries. The Fed and the European Central Bank act to ease financial conditions, and growth starts to pick up as businesses adapt to the new global costs and restructure their capital to reflect the new global cost structure. GDP falls in the last two quarters of 2017 and recovers after 2018.
Slower growth (30 percent): The infrastructure program and tax cuts stall in Congress even as the administration places significant restrictions on American imports, raising costs and disrupting supply chains. Businesses hold back on investments to restructure their supply chains because of uncertainty about future policy. GDP growth falls to 1 percent over the forecast period, and the unemployment rate rises.
Successful policy takeoff (10 percent): The administration takes only symbolic action on trade. With supply chain disruptions off the table, businesses focus on tax cuts that are designed to increase investment spending, and the opportunities available from the infrastructure plan. Growth remains above 2 percent for the next five years.
Sectors
Consumer spending
The household sector has been the bright spot of the American economy for the past year or two. Even while business investment was weak, exports faced substantial headwinds, and housing stalled, consumer spending grew steadily.2 But that’s not surprising, since job growth has been quite strong for the past few years. Even with relatively low wage growth, those jobs have put money in consumers’ pockets. That has allowed households to spend while keeping savings at a high (for the United States) level.
Consumer confidence has remained strong and even picked up after the election. And fundamentals such as job growth and inflation remain strong. Given recent economic data, there’s no reason to expect confidence to fall much, even if the news from Washington indicates mixed policymaking signals.
American households face fewer obstacles in their pursuit of the good life than just a few years ago. But there is the problem of growing income and wealth inequality. The possibility of higher inflation would be welcome for reducing the number of underwater households, since their borrowing is in nominal dollars. But it’s unclear whether—much less how—the new administration intends to address the lingering issue of inequality.3
Many US consumers spent the 1990s and ’00s trying to maintain spending even as incomes stagnated. After all, excitable pundits kept assuring them that the technology transforming their lives would soon—any day now—make them all wealthy. But now they are wiser (and older, which is another problem, as many Baby Boomers face imminent retirement with inadequate savings4). As long as a large share of the gains from technology and other economic improvements flow to a relatively small number of households, overall US consumer spending is likely to remain relatively restrained.

CONSUMER NEWS
Early 2017 saw a disconnect between what consumers said they believed, and what they did. Consumer confidence continued its post-election rise through March, although real consumer spending was down in January and February. Although spending recovered in March, the saving rate continued to rise, reaching 5.9 percent.
Headline retail sales followed a similar pattern, and were stronger in April. Sales at auto dealers, however, were down three of the four months ending in April. Light vehicle sales have, in fact, fallen from 18.4 million units (at an annual rate) in December to 16.9 million units in April.
Housing
Every year, thousands of young Americans abandon the nest, happy to leave home and start their own households. But more than usual stayed put during the recession: The number of households didn’t grow nearly enough to account for all the newly minted young adults. We expect those young adults would prefer to live on their own and create new households; as the economy continues to recover, they will likely do exactly that—as previous generations have.
This means some positive fundamentals for housing construction in the short run. Since 2008, the United States has been building fewer new housing units than the population would normally require; in fact, housing construction was hit so hard that the oversupply turned into an undersupply. But the hole is shallower than you might think. Several factors offset each other: If household size returns to mid-2000s levels, we would need an additional 3.2 million units; on the other hand, household vacancy rates are much higher than normal. Vacancy returning to normal would make available an additional 2.5 million units—which would fill three-quarters of the pent-up demand for housing units.

But are the existing vacant houses in the right place or condition, or are they the right type, for that pent-up demand? The future of housing may look very different than in the past. Growth in new housing construction has been concentrated in multifamily units. If that persists, we may conclude it is related to young buyers’ growing reluctance to settle in existing single-family units.
While economic growth and job creation may point to strong house sales, higher interest rates may moderate any potential housing boom. Higher inflation and a strong Fed response may drive up mortgage rates more quickly than businesses in the housing sector would like.
HOUSING NEWS
Housing permits were almost 6 percent above their year-ago level in April but down a bit from the January level. Both single and multifamily permits were down from the beginning of 2017. At about 1.2 million, permits are still below the level required to make up for the many years of low housing growth.
Contract interest rates rose about 35 basis points through February, then fell in March. The overall decline in long-term interest rates reflects bond traders’ views about the lower possibility of more expansionary policy, and resulting tighter interest rates, as the president and congressional leadership hit challenges in passing bills through Congress.
House prices continue to rise: In February, the Case-Shiller national index was 5.8 percent above the previous year’s level.
Business investment
Many may blame political uncertainty for lagging investment, but it’s easy to find more fundamental reasons for the weakness in this area over the past two years. The sudden decline of oil prices in late 2014 shut off domestic oil and gas exploration—a move that, it turned out, reduced use of capital goods. And the dollar’s appreciation in 2015 and 2016 made American companies less competitive. On top of that, China’s slowing growth is exposing global excess capacity in many industries.
Investment spending may slow somewhat as businesses wait to get clear direction about government policy. On the other hand, the strong economy is pushing businesses in the direction of growing capacity, lest they miss near-term opportunities.
The medium-term problem that CEOs face is deciding whether businesses need to rebuild their supply chains. Industries such as automobile production have developed intricate networks across North America and reaching into Asia and Europe, based on the longstanding assumption that materials and parts can be moved across borders with little cost or disruption. These capital-intensive industries are likely to want to postpone easily delayed investments in these networks until the administration’s trade policy becomes clearer.
Beyond the immediate impact of this policy uncertainty, the truth is that demand is the key to business investment. If businesses see higher demand for their products, they will grow capacity. In the baseline forecast, there is a modest boom in private investment that is induced by higher infrastructure spending.

BUSINESS INVESTMENT NEWS
Real business fixed investment rose a strong 10.4 percent in the first quarter (according to the second GDP release). That’s a large jump from the approximately 1 percent rates recorded in the previous three quarters. Structures investment rose 22 percent and is now up 7 percent over the previous year’s level. Equipment investment rose a substantial 9.1 percent. Intellectual property investment rose more slowly (2.0 percent) but is less volatile than other types of investment.
Nondefense capital goods shipments—an effective high-frequency measure of equipment spending—fell in April after two months of growth. Less aircraft, capital goods shipments looked even better in four of the last six months. The decline in April may indicate that investment spending will be slower in Q2 than it was in Q1.
Private nonresidential construction fell in March after growing for several months. Office and commercial construction were both down substantially in March, while manufacturing construction was up a bit.
Yields on corporate bonds began to creep up even before the election. In November and December, they jumped almost half a percentage point but have declined a bit since early in 2017. Stock indexes continued to make headlines by reaching new highs, as chances for significant tax reform and infrastructure spending seemed to fall.5 Corporate profits after taxes rose 9.5 percent at an annual rate in the fourth quarter and are up 16 percent over the previous year’s level. Profits remain at close to a record share of national income.
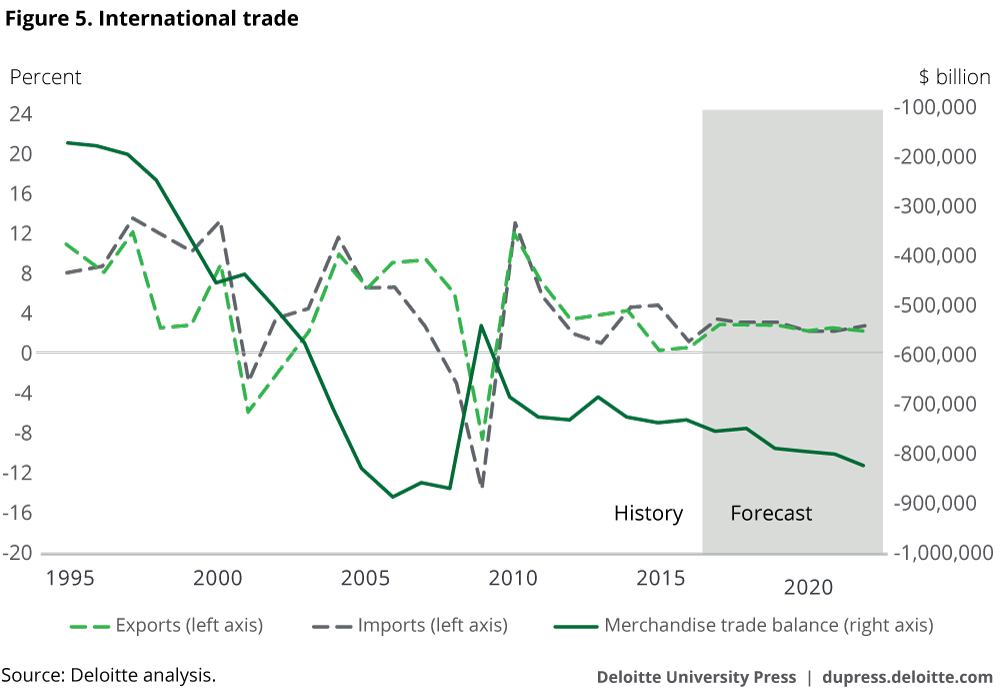
Foreign trade
Over the past few decades, business—especially manufacturing—has taken advantage of open borders and cheap transportation to cut costs and improve global efficiency. The result is a complex matrix of production that makes the traditional measures of imports and exports somewhat misleading. For example, in 2007, 37 percent of Mexico’s exports to the United States consisted of intermediate inputs purchased from . . . the United States.6
Recent events appear to be placing this global manufacturing system at risk. Brexit, which may affect the United Kingdom’s position in the European manufacturing ecosystem, along with the suggestion that the United States would cancel or renegotiate its position in NAFTA, may slow the growth of this system or even cause it to unwind. The impact could be felt in several ways:
- In the short run, uncertainty about border-crossing costs may reduce investment spending. Businesses may be reluctant to put capital in place when facing the possibility of a sudden shift in costs.
- A significant change in border-crossing costs—as would occur if the United States withdrew from NAFTA—would likely reduce the value of capital investment put in place to take advantage of global goods flows. Essentially, the global capital stock would depreciate more quickly than our normal measures would suggest. In practical terms, some US plants and equipment would go idle without the ability to access foreign intermediate products.
- With this loss of productive capacity would come the need to replace it with plants and equipment that would be profitable at the higher border cost. We might expect gross investment to increase.
The baseline forecast assumes some retaliatory measures that reduce US exports—but not an all-out trade war.
The current account is determined by global financial flows, not trade costs. Any potential reduction in the current account deficit is likely to be largely offset by a reduction in American competitiveness through higher costs in the United States, lower costs abroad, and a higher dollar. The forecast assumes that the direct impact of trade policy on the current account deficit is nil.
FOREIGN TRADE NEWS
US goods exports fell 1.0 percent in March after rising in the previous three months, but imports were down in February and March, reducing the trade deficit from $69 billion in January to $65 billion in March.
The dollar has been depreciating in 2017. A slight appreciation against the Canadian dollar was offset by small depreciations against the euro and yen and a substantial rise in the peso (from 21.4 in January to 18.8 in March).
The Chinese economy is recording satisfactory growth, though many observers remain concerned about the country’s financial system and continuing infrastructure investment. Some analysts focus on signs of strength in China’s consumer and service sectors, suggesting a long-awaited shift to becoming a consumer-driven economy. Others point to indications that official Chinese figures may be implausibly high.7 The country’s future remains a large risk for the global economy.
Europe has shown some signs of growth. Euro-area GDP grew 0.5 percent in the fourth quarter of 2016 and first quarter of 2017. However, negotiations over the continuation of aid to Greece remain a potential source of uncertainty for the Eurozone.
Government
The US government budget is now a source of substantial uncertainty. The administration’s proposed budget, presented on May 23, argued for considerable expenditure reductions.8 Members of Congress, even leaders from the president’s own party, indicated that such cuts were unlikely, and that little would survive from the budget proposal.9 We expect the most likely outcome, embedded in the baseline scenario, to be a continuation of current policy with a modest infrastructure spending program.
The baseline no longer includes an assumption that taxes will be cut, or that significant tax reform will occur. The logjam of legislation suggests that tax policy will likely see only minor changes. The successful policy takeoff scenario assumes a substantial ($250 billion) tax cut.
After years of belt-tightening, most state and local governments are no longer actively cutting spending. A portion of the infrastructure program is likely to take the form of transfers to state and local governments (most infrastructure investment in the United States takes place at the state and local level).

GOVERNMENT NEWS
By April, the federal deficit was slightly smaller than last year’s level. Outlays were up 0.2 percent for the fiscal year, and receipts 0.7 percent.
As of April, federal employment has fallen for four months in a row. State and local employment rose slightly, mainly because of a rise in employment in education.
Labor markets
If the American economy is to produce more goods and services, it will likely need more workers, and many potential employees remain out of the labor force: They left in 2009, when the labor market was terrible. The stability of the participation rate in 2016 and 2017, even as the labor force ages, is an encouraging sign. Accelerating production will carry with it an eventual acceleration in demand for labor, along with a welcome mild rise in wages. That should help to bring people back into the labor force.
But a great many people have been out of work for a long time—long enough that their basic work skills may be eroding. When the labor market tightens, will those people be employable? Deloitte’s forecast team remains optimistic that improvements in the labor market will eventually prove attractive to potential workers, with labor force participation picking up accordingly.
Significant immigration restrictions and/or deportation might have a marginal impact on the labor force. According to the Pew Research Center, undocumented immigrants make up about 5 percent of the total American labor force.10 Removal of all such workers would clearly have a significant impact—but that is unlikely to happen, for a variety of reasons. A more realistic assumption might be the deportation of about half a million undocumented workers annually.11 That would create labor shortages in certain industries (such as agriculture, in which 17 percent of workers are unauthorized, and construction, in which 13 percent of workers are unauthorized)12 but would likely have little significant impact at the aggregate level.

LABOR MARKET NEWS
Initial claims for unemployment insurance have fallen from the 260,000 monthly range last summer to the 240,000 range (and below) in April. That’s very low, especially considering that the labor force and total employment continue to grow over time. Job openings have risen a bit, to about 5.7 million. This is just under the highest level recorded (since 2002). Quits (voluntary separations) have also risen slightly, to 3.1 million. The large number of voluntary quits suggests that labor demand remains strong.
Payroll employment rose at an average rate of 174,000 per month during February–April. That’s almost twice as much as would be required by the growth of the labor force, although slower than the rate recorded during 2014–15.
Financial markets
Interest rates are among the most difficult economic variables to forecast because movements depend on news—and if we knew it ahead of time, it wouldn’t be news. The Deloitte interest rate forecast is designed to show a path for interest rates consistent with the forecast for the real economy. But the potential risk for different interest rate movements is higher here than in other parts of our forecast.
Global financial markets are now in a highly unusual state. About $10 trillion in sovereign debt is now trading at negative interest rates (meaning borrowers are paying for the privilege of loaning money to these countries). The existence of negative interest rates is unprecedented, and the fact that even large countries (such as Germany) are borrowing on these terms indicates that global financial markets have not fully recovered from the problems of the previous decade.

Despite this, the forecast sees both long- and short-term interest rates headed up—maybe not this week, or this month, but sometime in the future. The Fed currently is assuming that the economy is near full employment and would therefore likely react to the additional infrastructure stimulus assumed in the baseline. For that reason, the current baseline assumes an aggressive Fed reaction, with the Fed raising rates at every other FOMC meeting for the next few years. However, we have lowered our baseline long-term view of the stable Fed funds rate to be consistent with our assumption of a smaller demand-side policy impact. Long-term interest rates move up as the economy returns to full employment and some inflationary pressures appear.
FINANCIAL MARKET NEWS
Speculation about the future of the Fed will likely continue to grow over the next year. The new administration has an immediate chance to make an impression on the central bank by filling at least three open slots on the Board of Governors and appointing a new chairman in February 2018. (Janet Yellen, the current chair, could retain her board seat even after her term ends.)
Long-term bonds fell in April as traders began to price in the possibility of only modest policy changes. AAA corporate bonds maintained a spread of 80 to 90 basis points over Treasuries, while the junk-bond spread remained about 2.1 points over AAA bonds.
Stock prices rose through March but fell back a bit in April. There is considerable debate about whether stocks are overpriced, since P/E ratios are high and investors are evidently very optimistic about future federal government fiscal policy.13
Prices
It’s been a long time since inflation has posed a problem for American policymakers. The US economy has functioned below potential since 2008, and even before then there were few signs of significant inflation. With so much slack, neither workers nor businesses had the ability to raise prices.
Some observers believe that the economy is approaching full employment14 (although the Deloitte forecast projects some additional contribution from workers returning to the labor force as the economy continues to improve). Thus, the fiscal stimulus of infrastructure spending might create some shortages in both labor and product markets, and, as a result, some inflation. A return to 1970s-style inflation is unlikely, but it would not be surprising in those circumstances to see the core CPI running as high as 3.0 percent—or perhaps even a little higher. The forecast expects timely Fed action to prevent inflation from rising too much, but the price (of course) is higher interest rates.
PRICE NEWS
The overall CPI is running above 2.0 percent, although some of that reflects energy prices. Core CPI was up 1.9 percent in April. Inflationary pressures in the pipeline remain mild, but deflation no longer appears to be a realistic possibility—and there is some risk that inflation could break out of the healthy 2.0 percent range.
Final demand PPI was up 2.5 percent in the year ending in April. That is higher than a few months ago, reflecting higher energy prices. However, it is clear that producers’ prices are beginning to firm.
The hourly wage grew just 2.3 percent in the year to April, lower than the average growth recorded in the previous recovery. Some measures of pay, such as the employment cost index, are beginning to show signs of acceleration. If that continues, it will indicate that the economy is nearing full employment, and that policymakers may need to begin to lean against economic growth.

Appendix


© 2021. See Terms of Use for more information.
