The US labor market continues to defy worries
The May 2024 Economics Insider examines the outlook for the US labor market, which has shown resilience even amid high inflation and recent layoffs
Ever since the Federal Reserve (Fed) started tightening monetary policy, all eyes have been on the labor market. And that’s because, without some labor market softening, economists and Fed officials felt that inflation would remain elevated.1 However, inflation has eased from its peak of mid-2022, although it is still some way off from the Fed’s 2% target. But the labor market has remained resilient. Even with the slower rise in nonfarm payrolls in April, average job growth in the first four months of this year is 246,000, unemployment is low at 3.9%, and wages are still rising at a pace faster than pre-pandemic times.2
Should we then expect a sharp downturn in the labor market, especially given the news about layoffs in large companies in the past few months?3 That’s unlikely to happen. While layoffs may grab headlines, the underlying truth is that the labor market is always in churn. Jobs lost in some businesses and sectors are often offset by rises in others during an economic recovery. That’s exactly what’s been happening. Job openings, for example, are still higher than pre-pandemic levels, while layoff rates are lower.4 Nevertheless, we expect the pace of job growth to slow from 2024 to 2028 as GDP growth dips toward its potential rate and labor supply faces headwinds from slow population growth and elevated labor force participation.
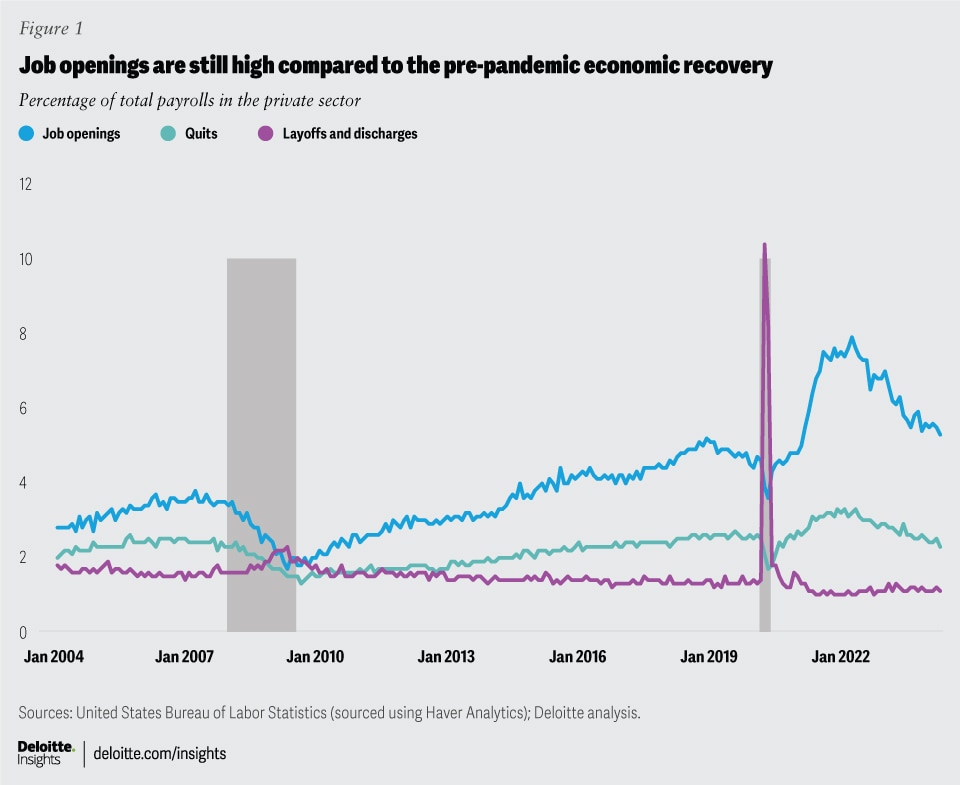
Job openings have declined but are still higher than pre-pandemic levels
During a recession, job openings decline and businesses shed jobs as economic activity contracts. As the subsequent recovery takes shape, demand and sentiment improve, thereby prompting businesses to expand their operations and hire more employees. During a recovery, quits also rise as people search for better roles or higher-paying jobs. The reverse is true during a recession.
The Job Openings and Labor Turnover Survey data from the Bureau of Labor Statistics shows that although the rate5 of job openings has declined from the very high rates seen early in the current economic recovery, it is still above pre-pandemic levels (figure 1).6 Quit rates, which increased in 2021 and 2022, are now close to what it was before the COVID-19 recession in 2020. And despite all the news about job cuts, the overall rate of layoffs and discharges in the economy has been low and flat over the past year and close to what it was right before the pandemic.
The Job Openings and Labor Turnover Survey data also reveals that, overall, businesses in the economy are still hiring at a healthy pace. At 3.8% in March 2024, the hiring rate is a tad lower than the first two years of the current recovery, but is still comparable to pre-pandemic rates. Overall, these trends show that the labor market is still strong with a healthy mix of job openings, hires, quits, and layoffs, which don’t indicate any impending trouble.
Trends in big businesses may cloud the “bigger” picture
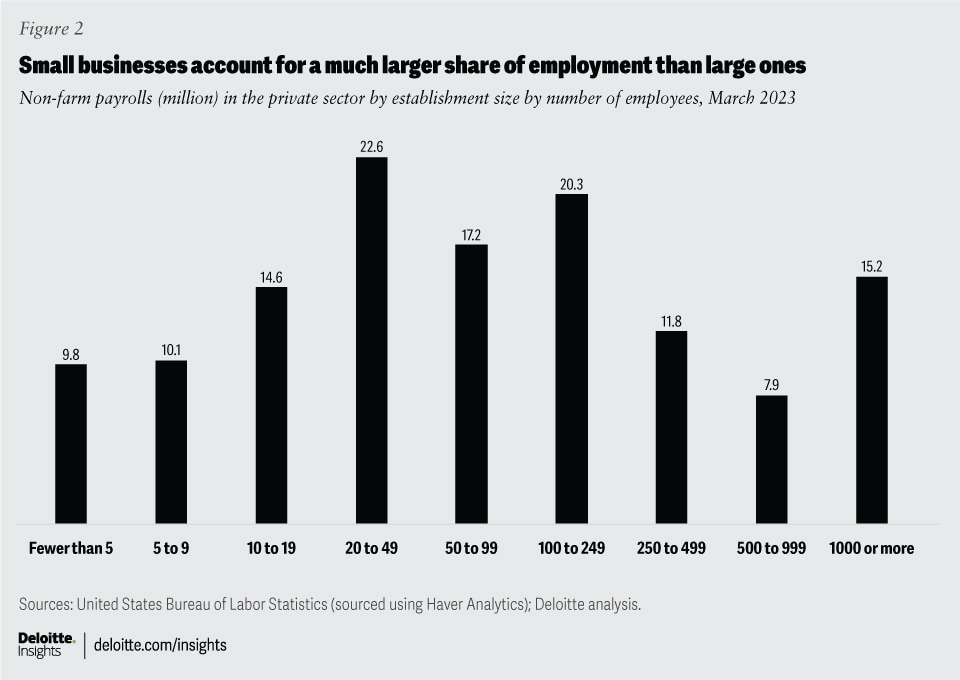
The view that the labor market is still healthy can be puzzling for some as news about layoffs in big, reputed companies often dominate headlines. However, these headlines can be misleading as trends for large companies are not an overall indicator of the labor market. Employment levels, job openings, quits, and layoffs are typically higher for small businesses than for larger ones.
Let’s consider employment levels first. Data on employment levels by firms shows that businesses with fewer than 250 employees accounted for 73% of total private sector nonfarm payrolls by the end of the first quarter of 2023, more than six times the share for businesses with 1,000 or more employees (figure 2).7 Similarly, a recent study by the Bureau of Labor Statistics shows that businesses with fewer than 250 employees accounted for 55% of net job creation in the economy between 2013 and 2023.8 Hiring by these businesses was about 4.1 million in March this year, more than 10 times the figure for businesses with 1,000 employees or more. The trend is the same for the level of job openings.
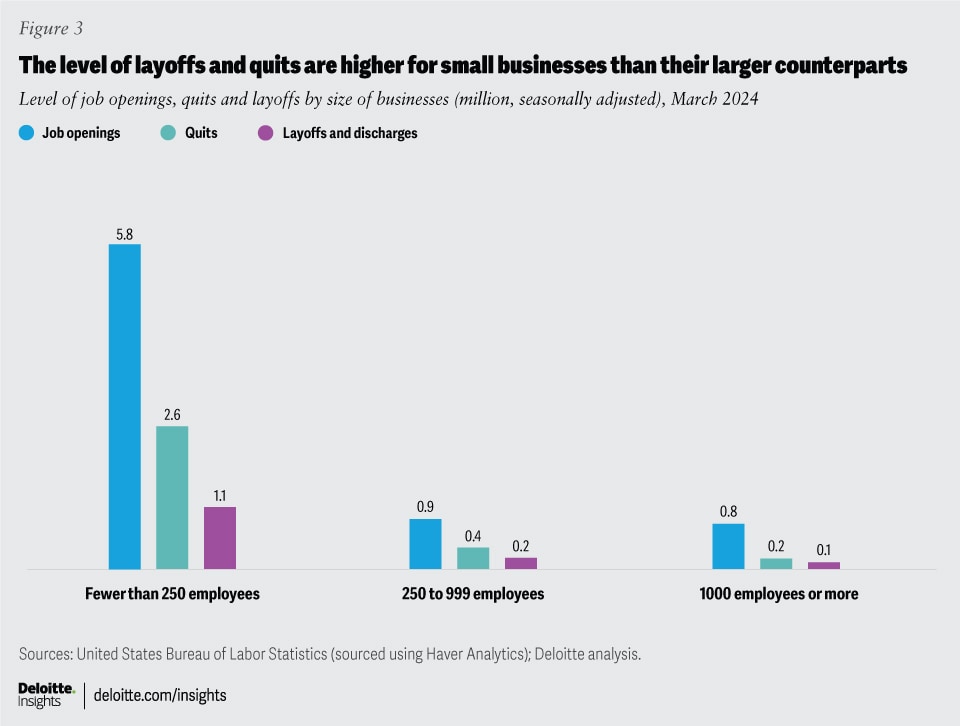
What about layoffs and quits? Figure 3 shows levels of layoffs and quits (along with job openings) in March 2024 for three classes of establishments—fewer than 250 employees, 250 to 999 employees, and 1,000 employees or more.9 Just like job openings, the levels of layoffs and quits are much higher for small businesses than for larger ones. For example, layoffs and discharges at businesses with fewer than 250 employees were nearly nine times the figures for businesses with 1,000 employees or more in March. The trend is broadly similar for quit levels as well.
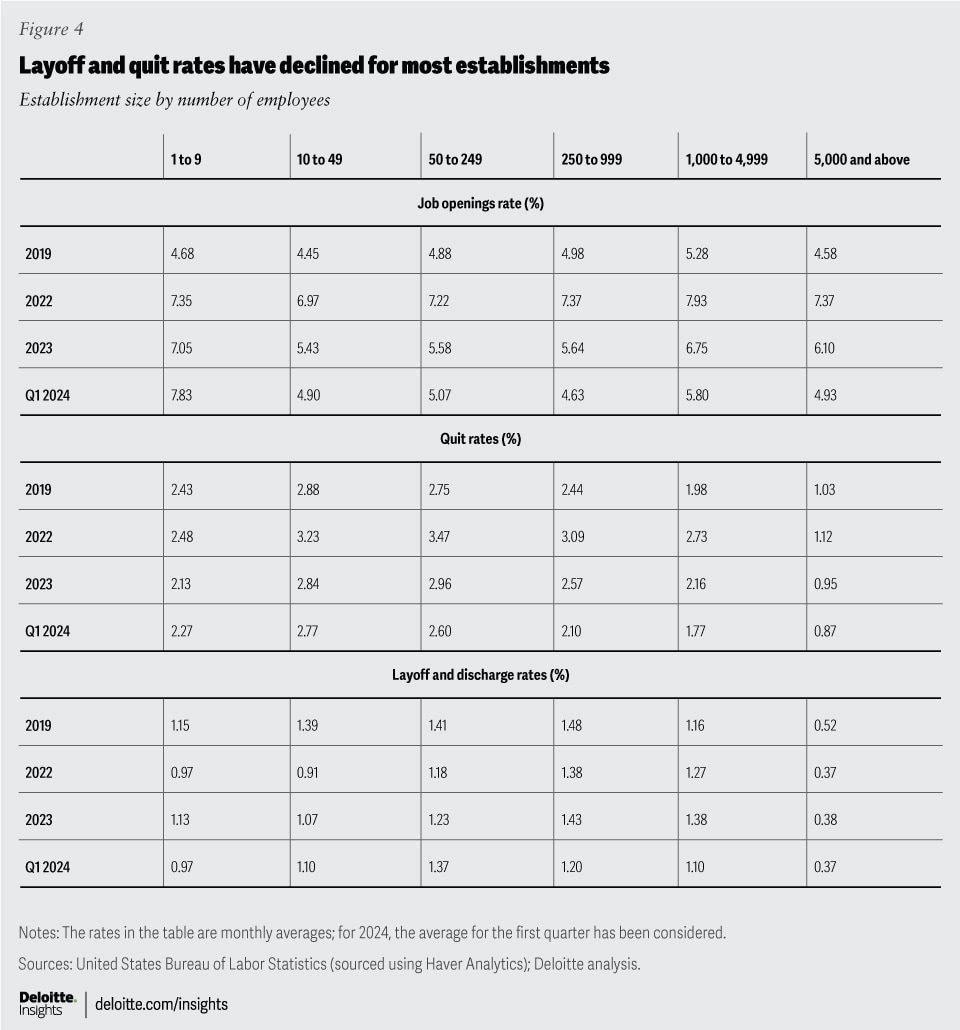
Taking note of these differences between small and large businesses, we can now analyze whether trends in job openings and layoffs over the past year hint at any sharp reversal in fortunes for the labor market. Figure 4 shows rates of job openings, quits, and layoffs for businesses in the private sector by establishment size.10 The data reveals that the average monthly rate of job openings so far this year is still higher for most types of establishments than during pre-pandemic times or at comparable levels. Rates have, however, declined since 2023 for most establishments. Layoff and discharge rates too have mostly declined this year from the previous one and are in line with figures before the pandemic. Overall, figure 4 indicates that job openings, layoffs, and quits across businesses (by size) are relatively stable and do not indicate any near-term slump.
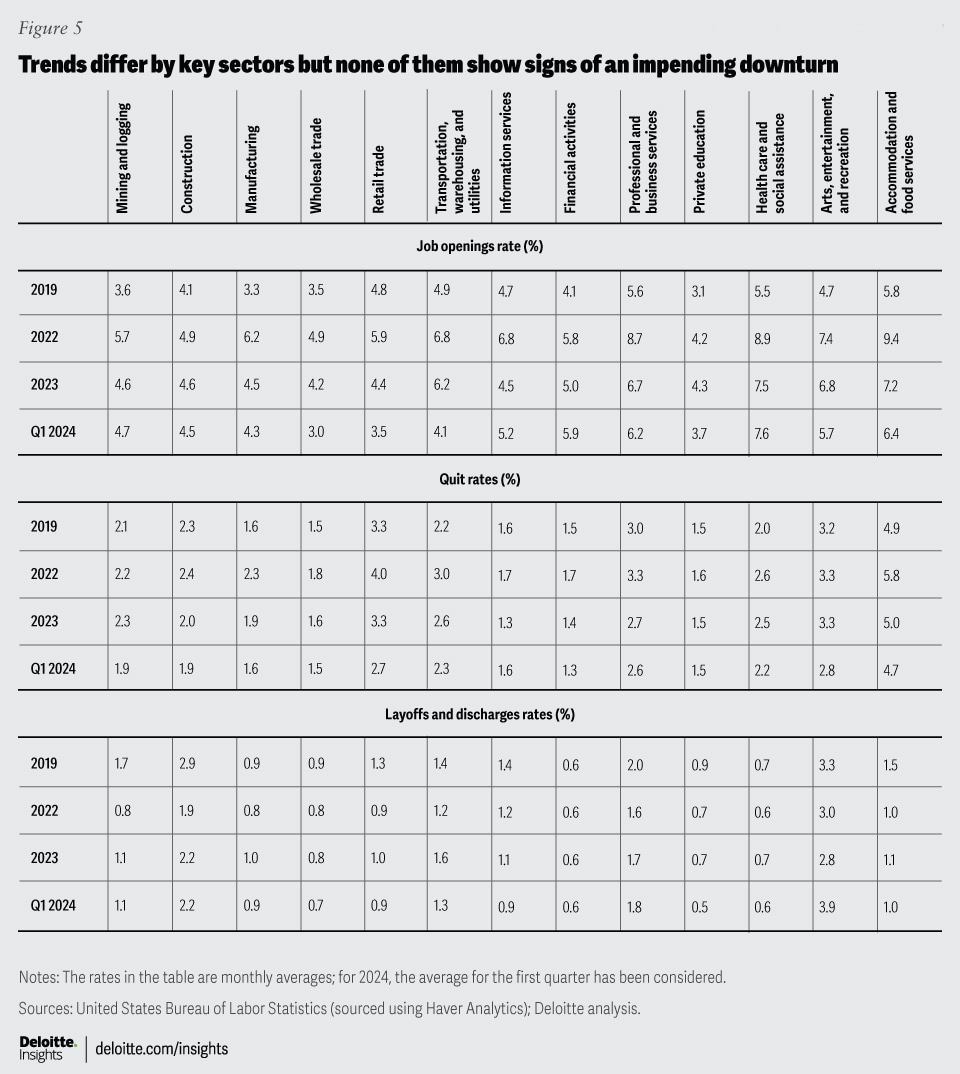
Sector trends vary, but none suggest a sharp near-term dip
Trends differ not just by type of establishment, but also across sectors. Figure 5 shows the rate of job openings, hires, quits, and layoffs for key sectors across the economy. Other than wholesale trade; retail trade; and transportation, warehousing, and utilities, job opening rates are still higher compared to pre-pandemic levels. While rates have declined for certain sectors over the past year, they have gone up for others like financial activities, information services, and health care and social assistance. Similarly, layoff rates have declined for most sectors. Overall, these figures indicate that the labor market, viewed as a whole, is still strong, albeit with differences across sectors.
It’s also important to note that the pace of job growth slows over the period of an economic recovery. This is especially true given the nature of the most recent recession. Unlike the downturn of 2007 to 2009, the recession of early 2020 was caused by a virus and a worldwide health emergency. Due to lockdowns and social distancing measures, the dip in monthly employment in March and April 2020 was much more than in the recession before that. Nonfarm payrolls in the private sector fell by about 10.5 million per month (on average) in March and April 2020, much less than the 422,000 jobs lost per month in the 2007 to 2009 recession.11 Hence, the rate of increase in employment after the worst of the pandemic, especially in 2021 and 2022, was high, as the recovery was from a low base.
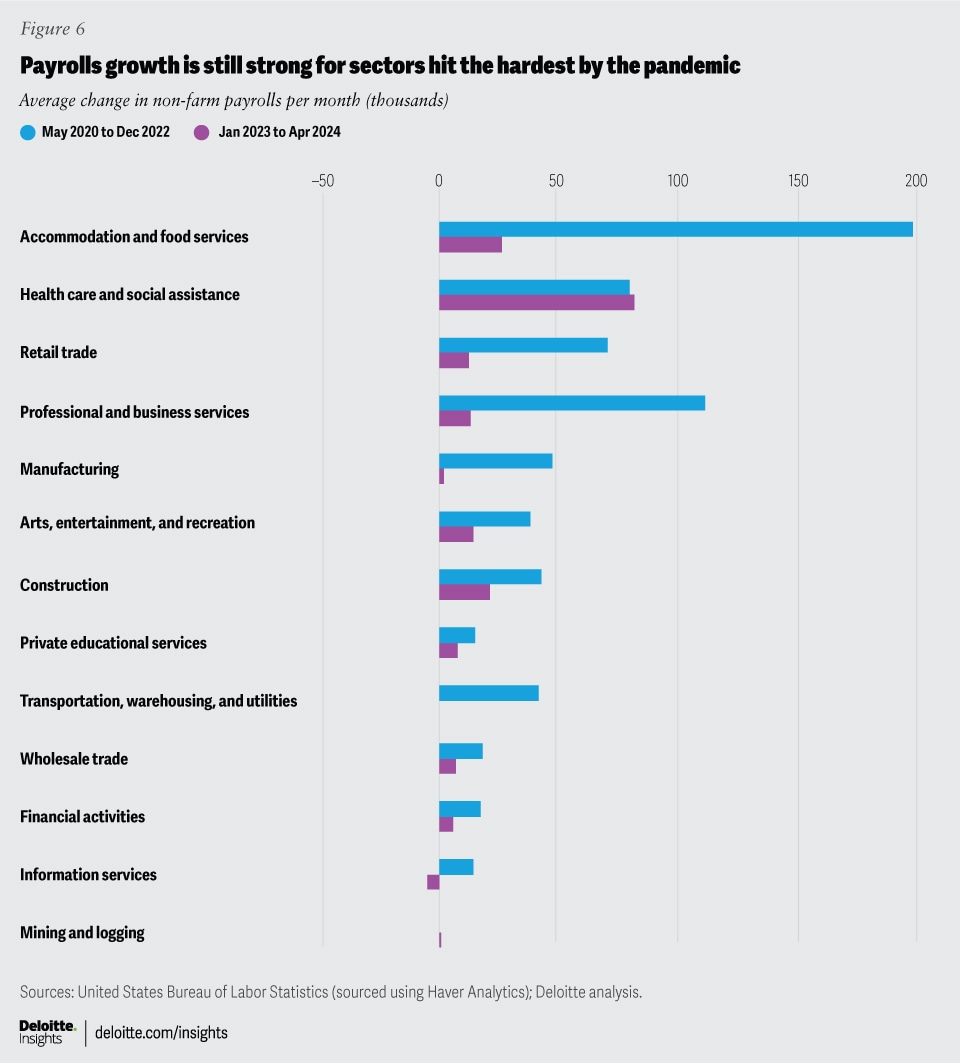
Also, given the nature of COVID-19, the decline in employment in certain sectors like financial activities, which could take advantage of technology and shift to remote work, was smaller than those like accommodation and food services. Similarly, the recovery came sooner for financial activities. Consequently, payrolls in the sector are up 4.1% from February 2020—right before the pandemic—while payrolls are still 1.1% lower for accommodation and food services. But as consumers and businesses ratchet up spending on travel, eating out, and entertainment, growth in employment in accommodation and food services may outpace sectors that have already recovered strongly (figure 6).
Job growth will slow over the next five years
While the labor market is expected to remain strong, the pace of job growth will likely slow for two reasons: First, economic growth will likely edge lower toward its long-term potential of about 1.5% over the next five years.12 Hence, demand growth for jobs is expected to decline. Second, labor supply constraints will weigh on job growth. Population growth has fallen in the United States over the past two decades, while the median age has gone up. In contrast to the sharp dip in the first half of 2020 due to the pandemic, labor force participation rates have gone up and are now edging close to the pre-pandemic levels. Due to these structural constraints and in the absence of deep unexpected shocks to the economy, we believe that average employment growth will likely slow over 2024 to 2028, while unemployment will remain low.