
Article
Quality Dashboard
Digitize Quality: How to leverage digitalization to transform Quality Management
Most organizations lose several months to identify and react to Q-issues and spend millions on warranty – underlying reasons are usually a lack of transparency and decision speed, outdated reporting systems and rising complexity to steer quality in a digital and competitive environment.
Inhaltsübersicht
- Quality Dashboard as Solution
- Show Case Q-Dashboard Automotive Industry
- "Single Source of Truth” for quality data
Not only do customer expectation of quality rise constantly, the visibility of an organization towards its customers is too. We have various options to inform ourselves and inform others about our product or service experience. That means increasing pressure to deliver excellent quality and requires organizations to gather and deal with a growing amount of data from various channels.
Despite major digitalization initiatives, organizations continue to rely heavily on Excel/Access solutions to create transparency in crucial areas such as quality management. Employees waste up to 30% of their time gathering, evaluating and “polishing” data for reports and presentations instead of doing valuable quality work. Such reporting structures are error prone, lack flexibility and speed, making well-informed and fast decisions difficult.
However, organizations are reluctant to invest into modern data management and visualization solutions. Such solutions are considered costly and time-consuming and internal (IT) resources are usually scarce. The results are often "interim solutions" that do not meet all requirements or technical standards.
Quality Dashboard as Solution
An intuitive Quality management can replace outdated reporting structures and consolidate large amounts of data into one holistic platform without lengthy IT-development cycles. Thus, it supports organizations to quickly unlock true data insights, reduce quality costs and improve customer satisfaction.
Advantages Quality Dashboard
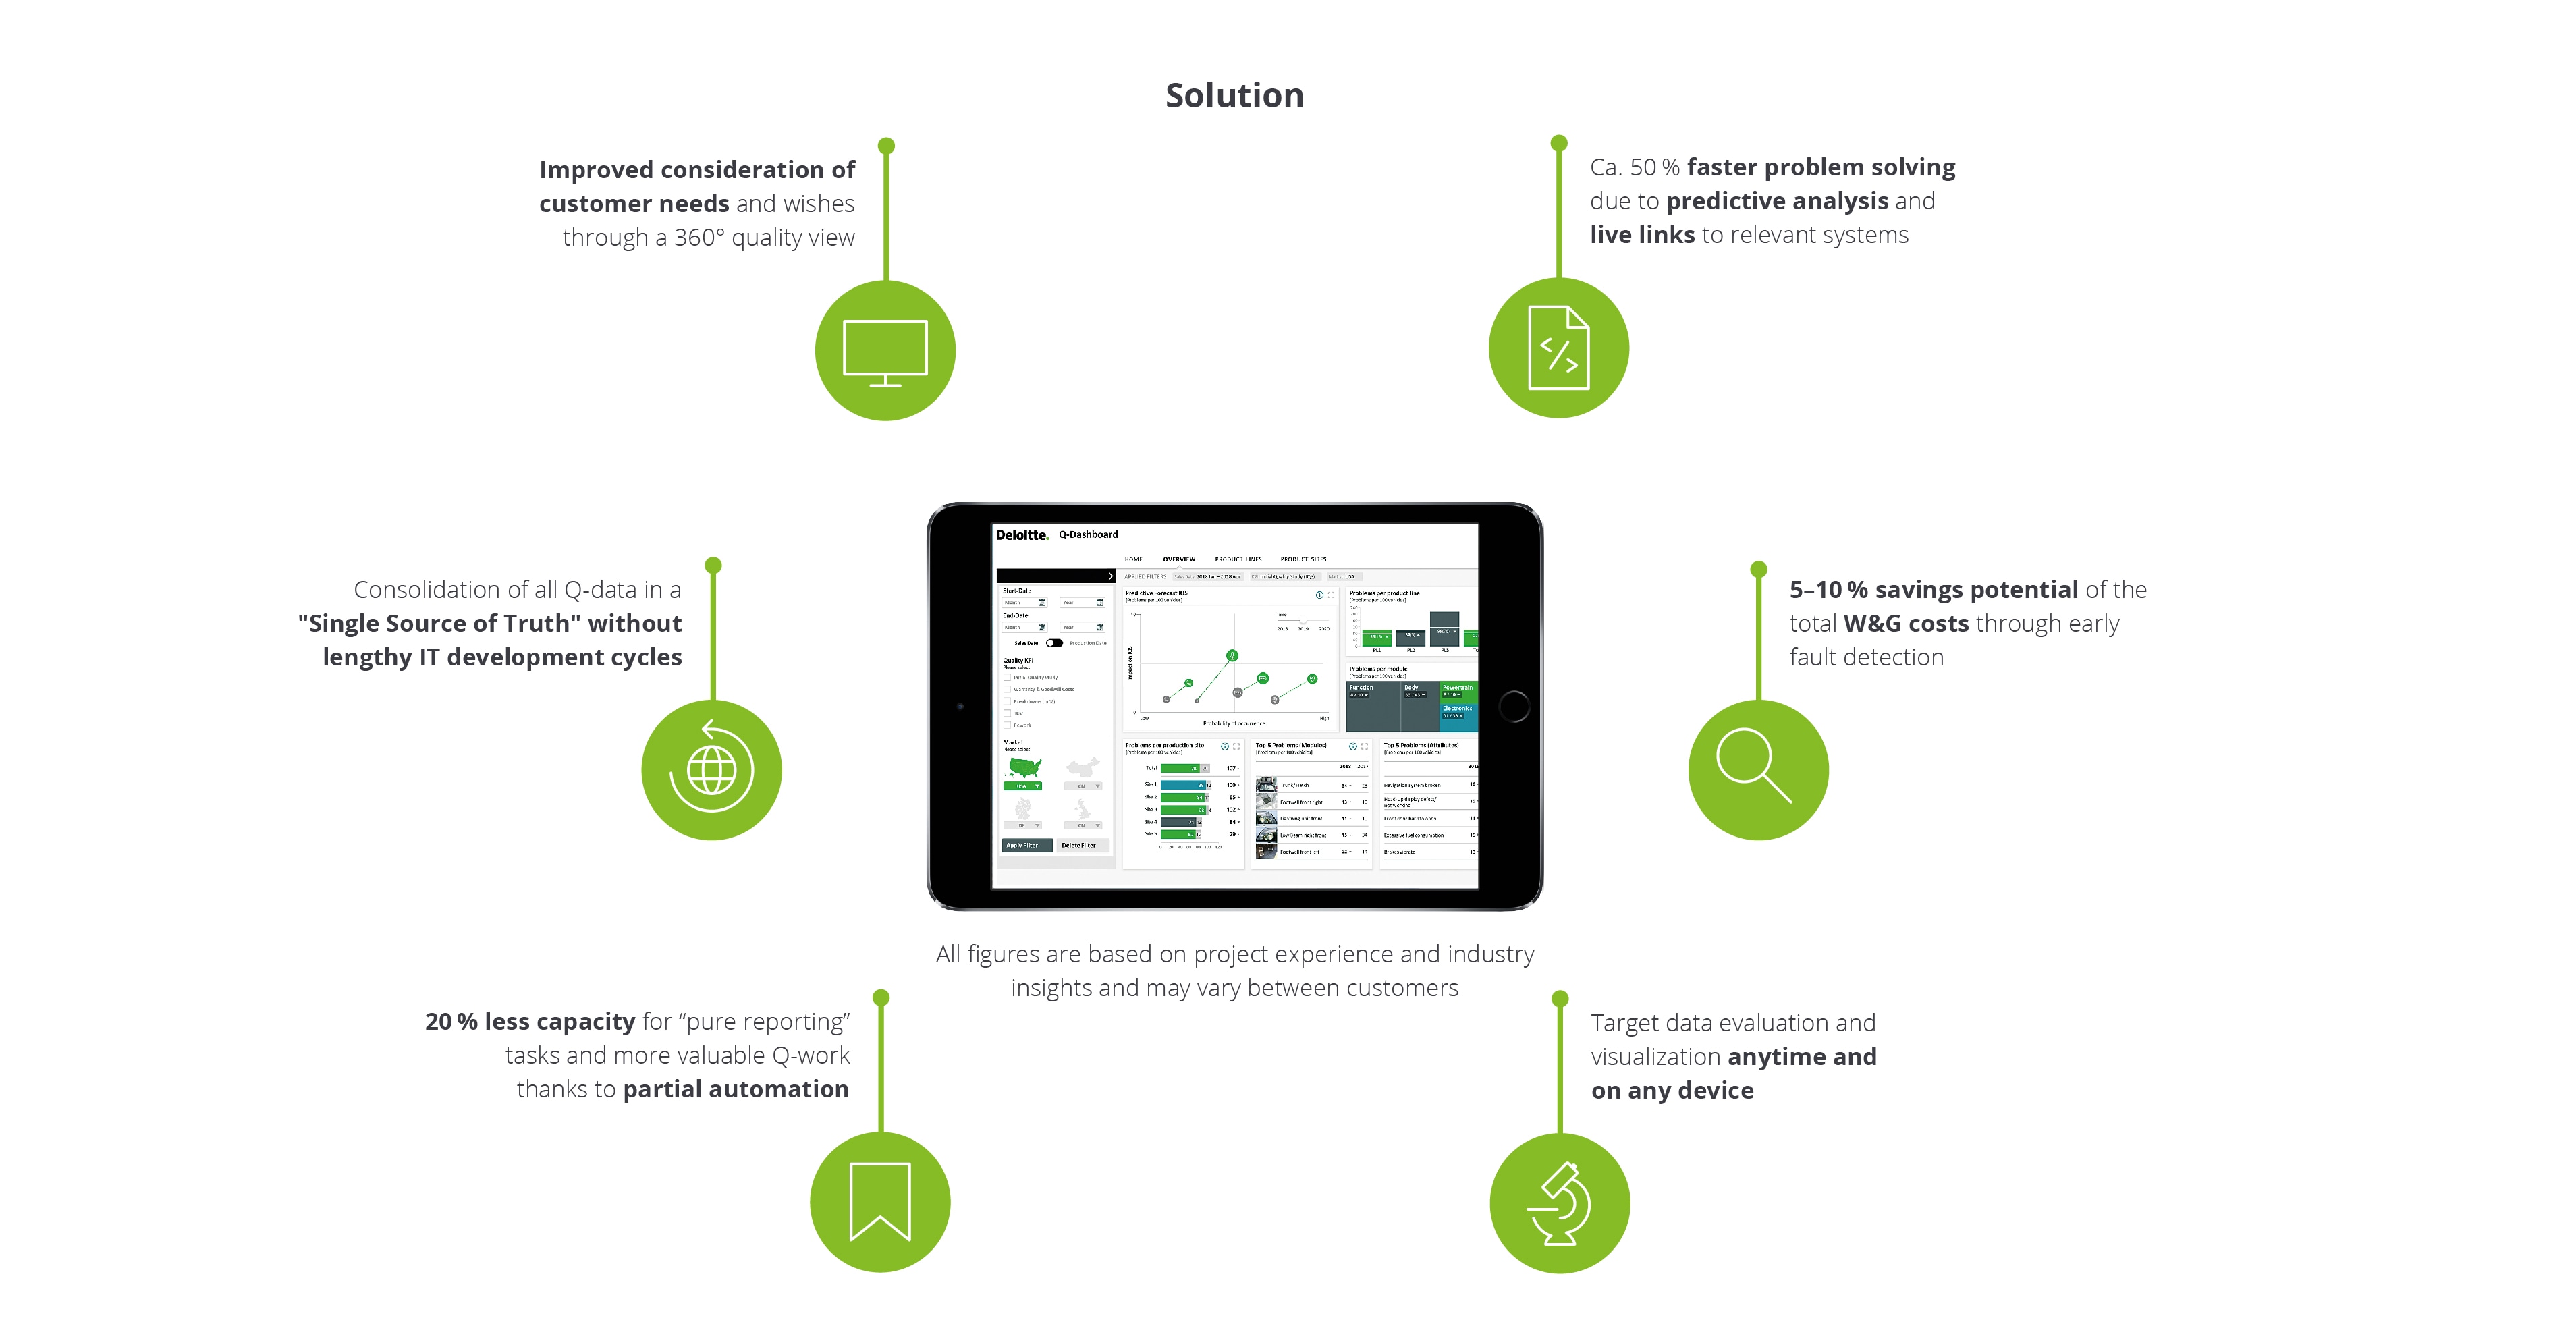
Show Case Quality Dashboard Automotive Industry
If the Dashboard really adds value for an organization and its users depends on three make or break aspects: content, user friendliness and IT-backbone.
Content
The fundamental goal of any business report is to create transparency of complex situations. This is especially true with regard to quality management. Information about an organization’s quality performance comes from various source (customer call center, warranty data, production data, telematics, etc.) at different times and usually in various formats. Although most companies do a good job in monitoring basic quality KPIs, an underlying strategy is often missing. At best, these organizations do not steer quality as effectively as they could. At worst, conflicting targets, wrong, outdated or too many KPIs paralyze organizations and leave them unable to respond to changing conditions. The first step is therefore always to determine the scope and content of the Q-Dashboard.
User-Friendliness
The next consideration, before thinking about chart types and font style, should be the target group. Who are potential users of a Q-Dashboard? What information do they need? Using Personas and Wireframes the “story” and initial design of the dashboard is created within just a few days and can then be tested with selected users. The resulting red thread creates confidence in the dashboard and usually enables a faster decision-making process.
IT-structure
Even the most well designed dashboard is not helpful if the related data is gathered manually from various data sources. The ground layer of each dashboard is therefore a strong IT-architecture. A 3-tier infrastructure composing of a database, an application and a user interface has proven most effective and flexible for the development of a dashboard application development of a dashboard application (see figure 3). The most important aspects in this context are data type and access, existing IT strategies (e.g. company-wide software defaults), scope (e.g. stand-alone solution vs. integration into existing IT-landscape) and responsive design (e.g. access on mobile device).
One of the key benefits of such an IT-structure is that it creates a “Single Source of Truth” for all relevant quality data and information. This enables organization to leverage the full potential of their data.
By applying different analytics methods and techniques, complex correlations between KPIs, historical patterns or anomalies can be identified and predictions, e.g. about potential Q-issues, can be made. In addition, traditional data sources are enriched by voice of customer information e.g. from social media. Project examples in the automotive industry show that predictive models can detect potential quality and safety issues up to 4 months in advance. Thus, quality issues are tackled proactively, customer satisfaction is increase and long-term W&G cost are saved.
“Single Source of Truth” for quality data

Ihre Autoren
Julienne Mittag
Senior Consultant
jmittag@deloitte.de
Simone Siemes
Director Consulting
ssiemes@deloitte.de
Ansprechpartner

