Consumer spending: Understanding what it is and how it is evolving Economics Spotlight, November 2018
27 November 2018
Consumers are spending more, but their allocation patterns have changed and the degree to which they spend on various categories differs across income levels.
Consumers are spending less of their incomes than ever before on traditional retail items such as apparel and groceries. Just how have consumer spending patterns changed? What are Americans doing with their growing incomes? And is there a difference between how the poor and the rich spend their incomes? Many economists have some ideas about these trends, and it turns out that we can see those ideas translated into numbers in the US consumer spending data, especially the data from the Bureau of Labor Statistics’ Consumer Expenditure Survey (CES).1
To start with, the CES data shows that average consumer expenditure grew at an average annual rate of 3.0 percent during 1987–2017, a little slower than the corresponding rise in average income before taxes (3.4 percent).2 Expenditure, however, outpaced income during 2007–2017. A deeper data-dive brings out even more interesting insights: The shares of housing, health care, and insurance and pensions have gone up at the expense of food and apparel. And the degree of such changes differs across consumers’ income levels.
Steady growth in average consumer spending since 2014
In 2017, average consumer expenditure grew by 4.8 percent to US$60,060, continuing the growth momentum since the volatile years of 2007–2013. Interestingly, the rise in spending last year came about despite a 1.5 percent decline in average income before taxes. And it was consumers in the second and middle quintile of the income distribution that drove spending growth in 2017; growth was more muted for the bottom quintile of income earners.3 Not surprisingly, there is also a wide gap in average spending across income levels: In 2017, average spending was US$116,988 for the top quintile, 4.5 times the corresponding figure for the bottom quintile.
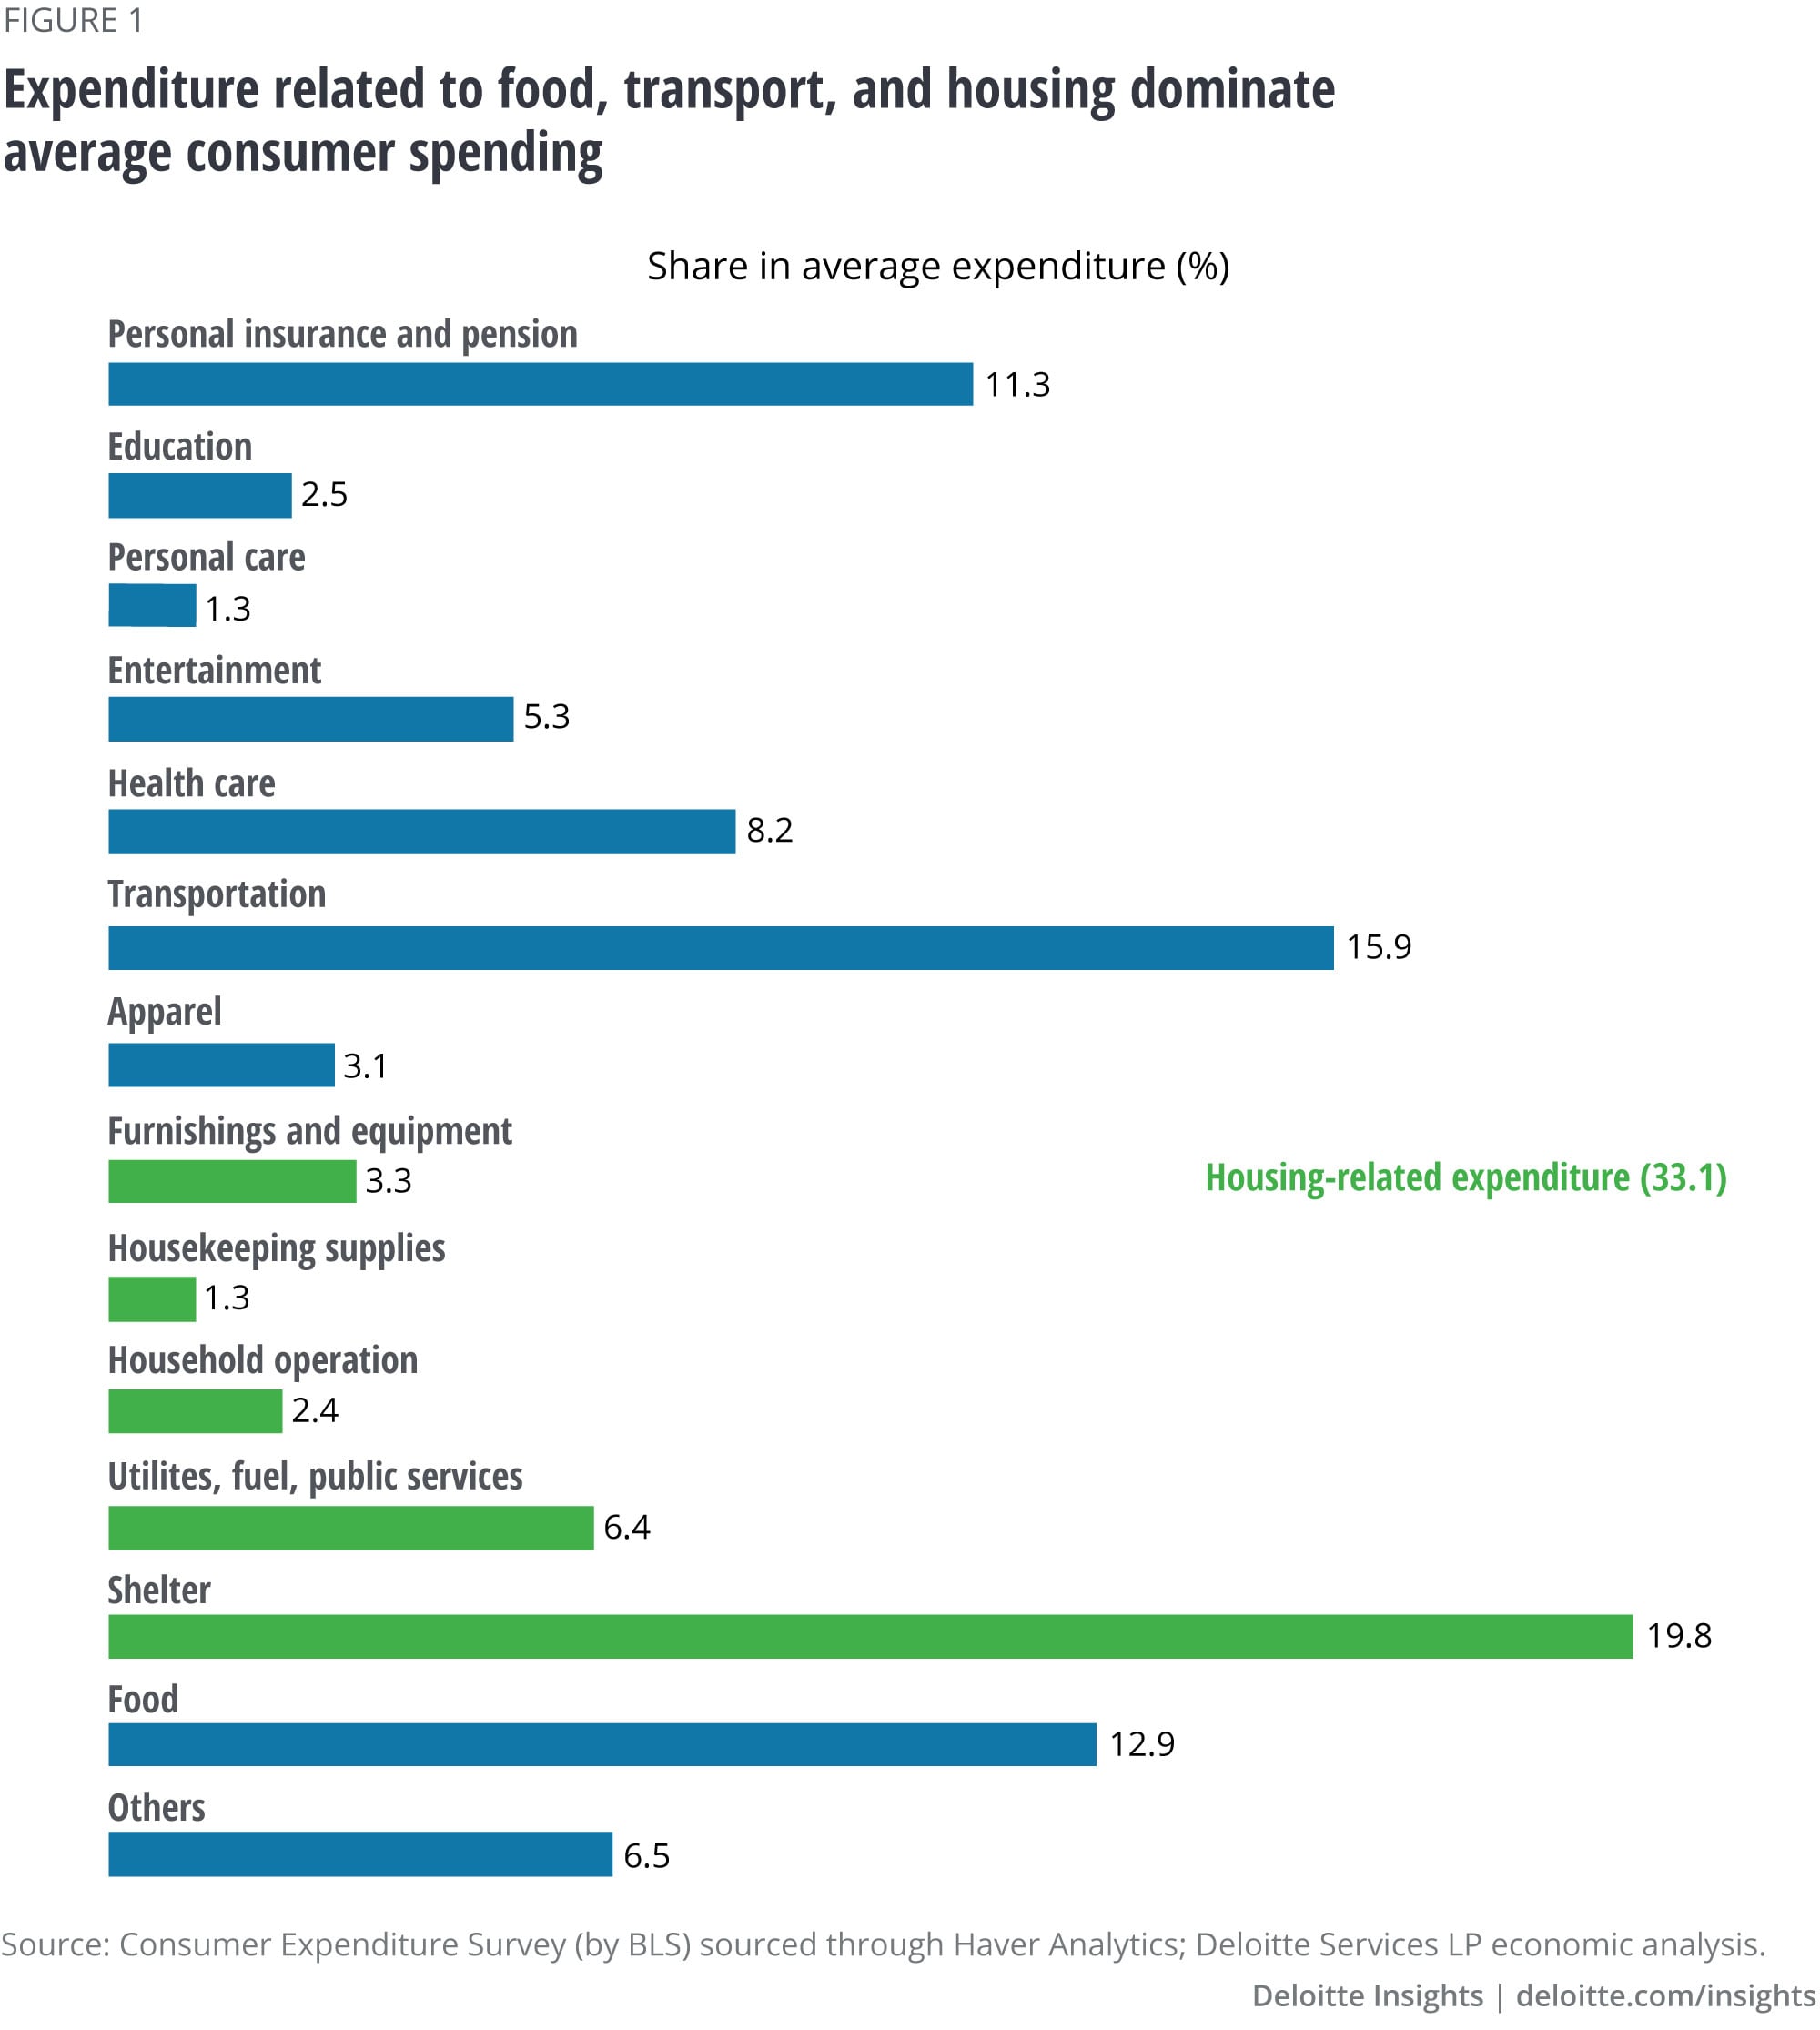
So, what are consumers spending on? About a third of a consumer’s expenditure, on average, in 2017 was housing-related—shelter, utilities, household operations, supplies, and furnishing. Transportation and food were the other big avenues of consumer spending, followed by personal insurance and pensions, and health care (figure 1).

More of food and housing for low-income earners, less of insurance and pensions
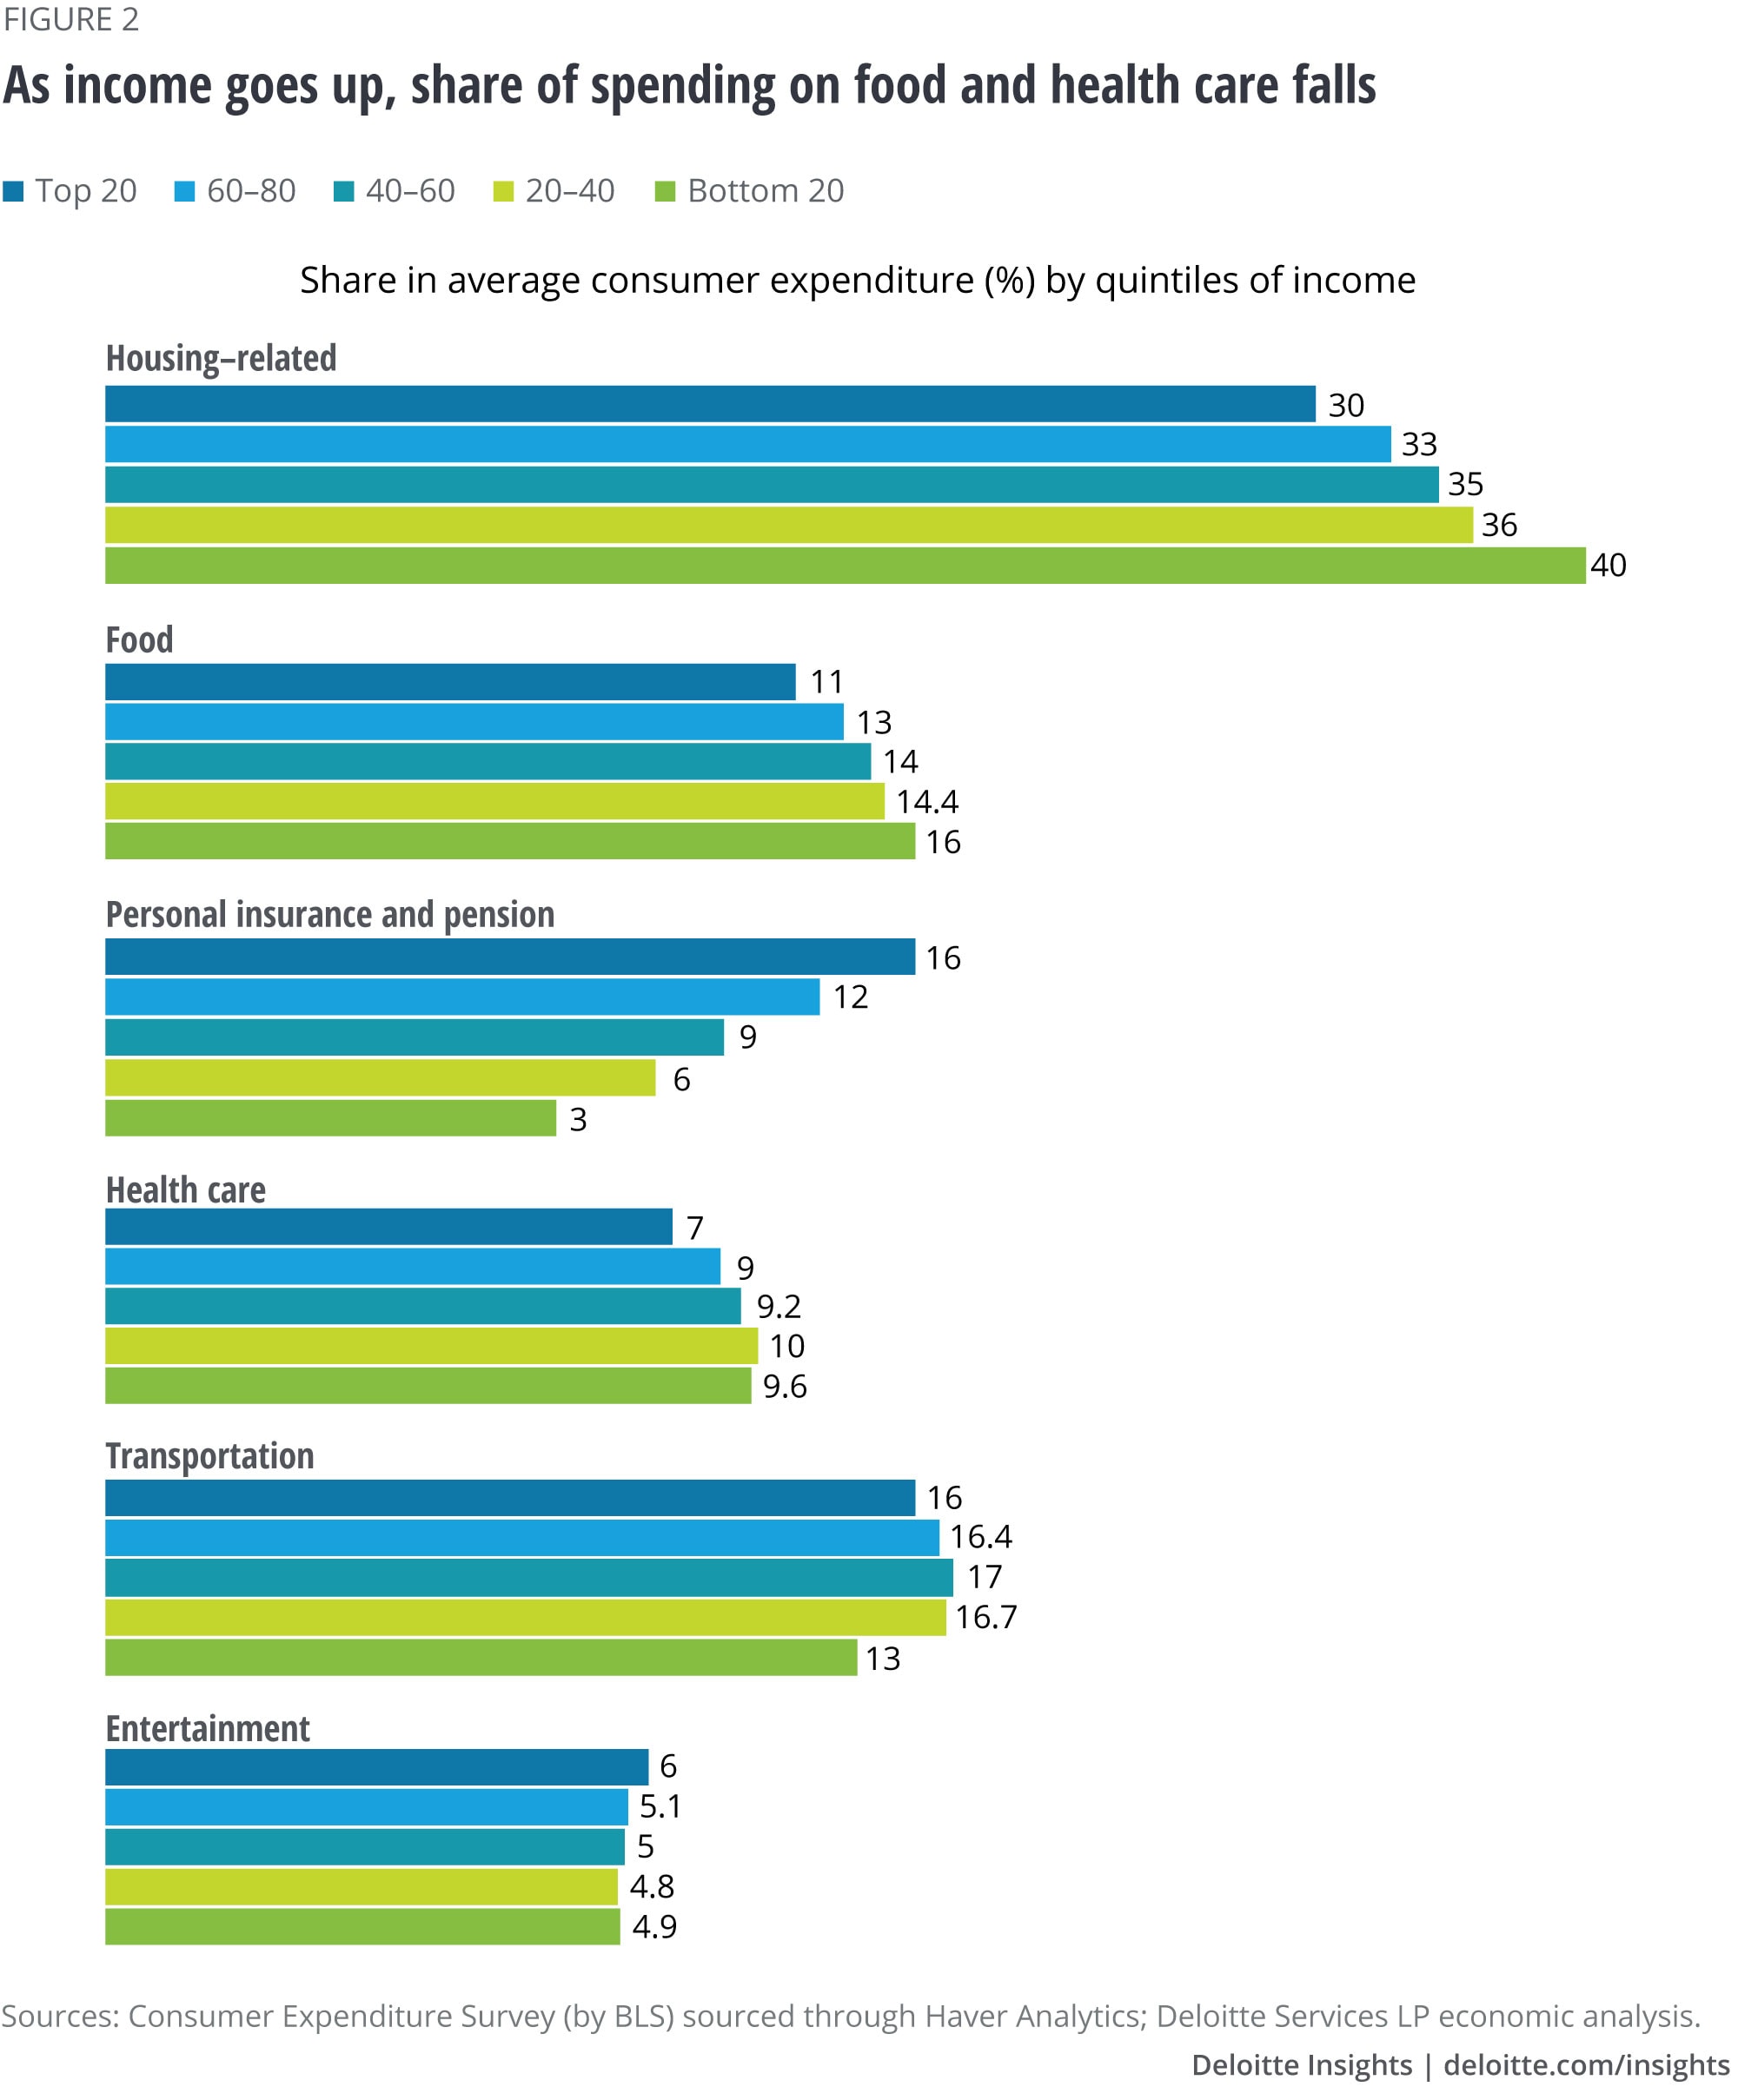
Consumers across income levels differ in their allocation of spending. Shares of food- and housing-related expenditures, for example, are highest for those in the bottom quintile. In 2017, the average consumer in the bottom quintile spent 16 percent of expenditure on food, while 40 percent was allocated toward housing-related expenses. In contrast, someone in the top quintile, on average, allocated 11 percent of his or her expenditure on food and 30 percent on housing that year. The share of health care in total expenditure also appears to decrease as incomes rise (figure 2), and so does the share of entertainment, albeit moderately. High-income earners spend relatively more on insurance and pensions—16 percent of the total expenditure for the top quintile of income earners was on personal insurance and pensions in 2017, compared to just 2.5 percent for the bottom quintile.

Gains for health care over the years, but not so for apparel
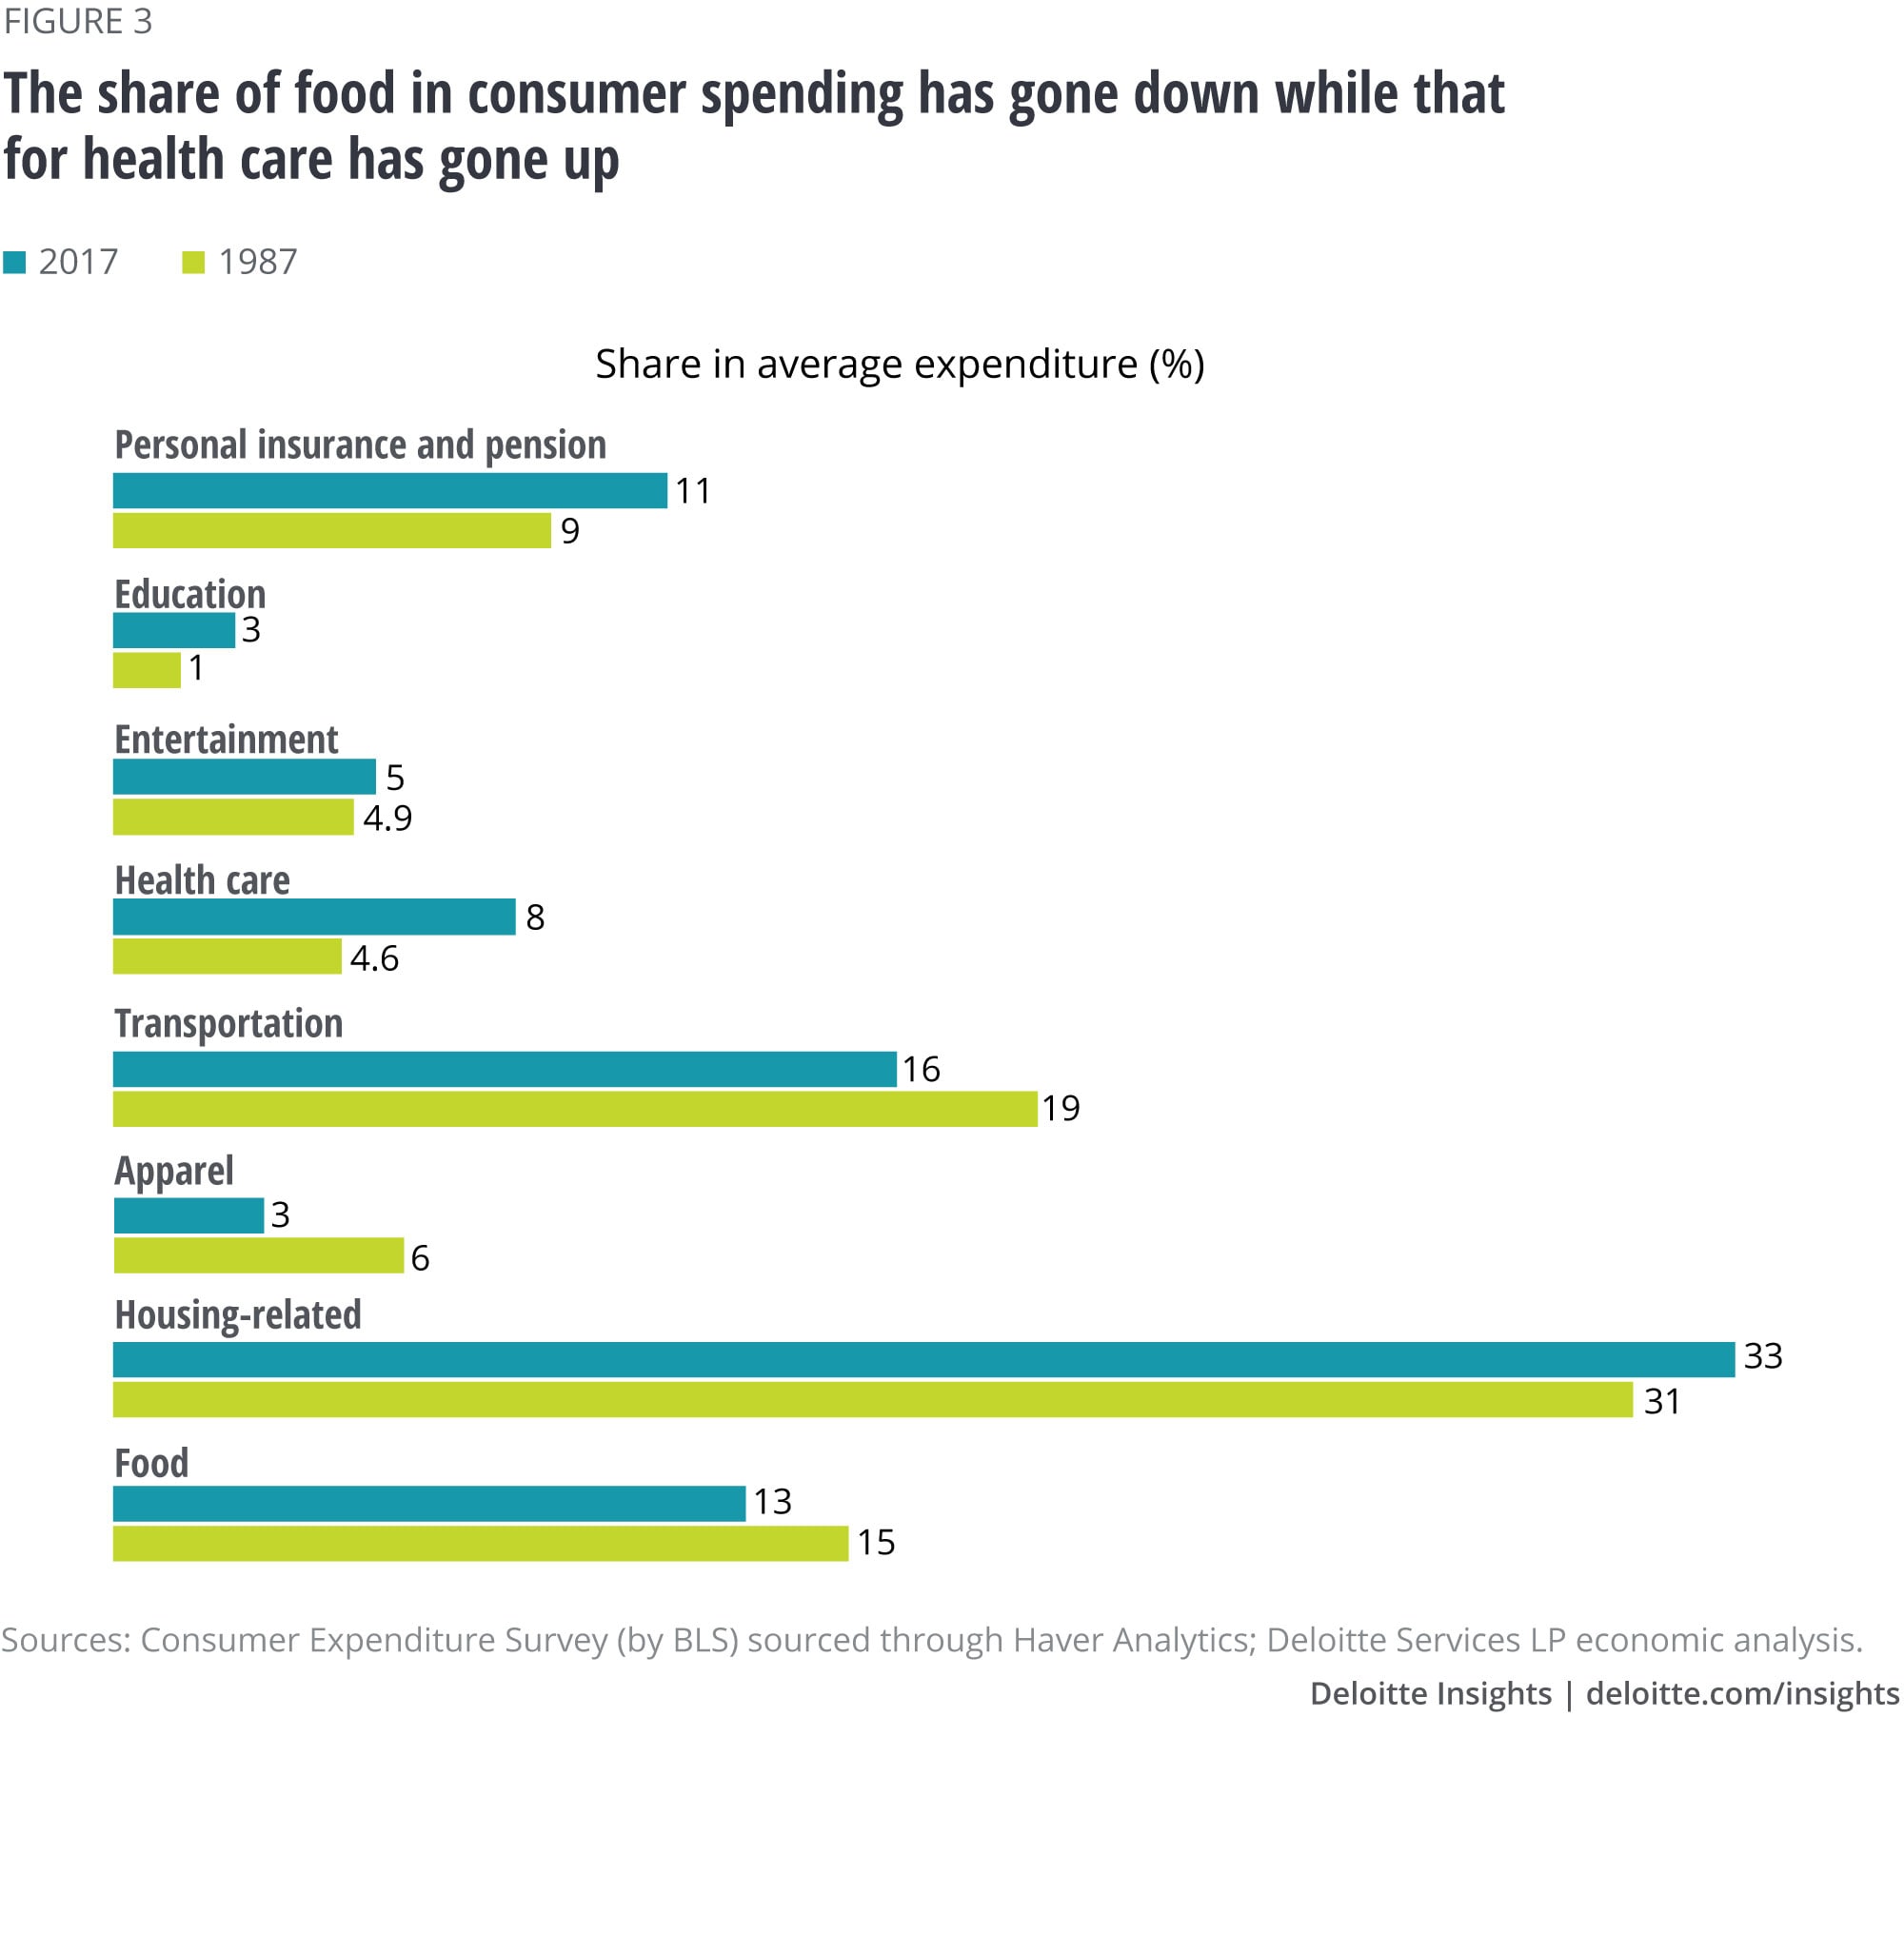
Over the years, the shares of some products and services in consumer expenditure have changed. For example, the share of food in average expenditure has gone down between 1987 and 2017 (figure 3). And within food expenditure, the share of food spending at home has been edging lower since 1995. The share of apparel spending in average expenditure is also falling. In 1987, an average consumer allocated 5.9 percent of his or her expenditure to apparel and services; by 2017, that share had fallen to 3.1 percent. The trend is similar for transportation, although the degree of decline is less. In contrast, consumers are spending relatively more on dwellings and household operations—both have, in turn, propped up the share of household-related expenditure. They are also spending more on health care, and on personal insurance and pensions than in the past.

Here are some other highlights from the CES data:
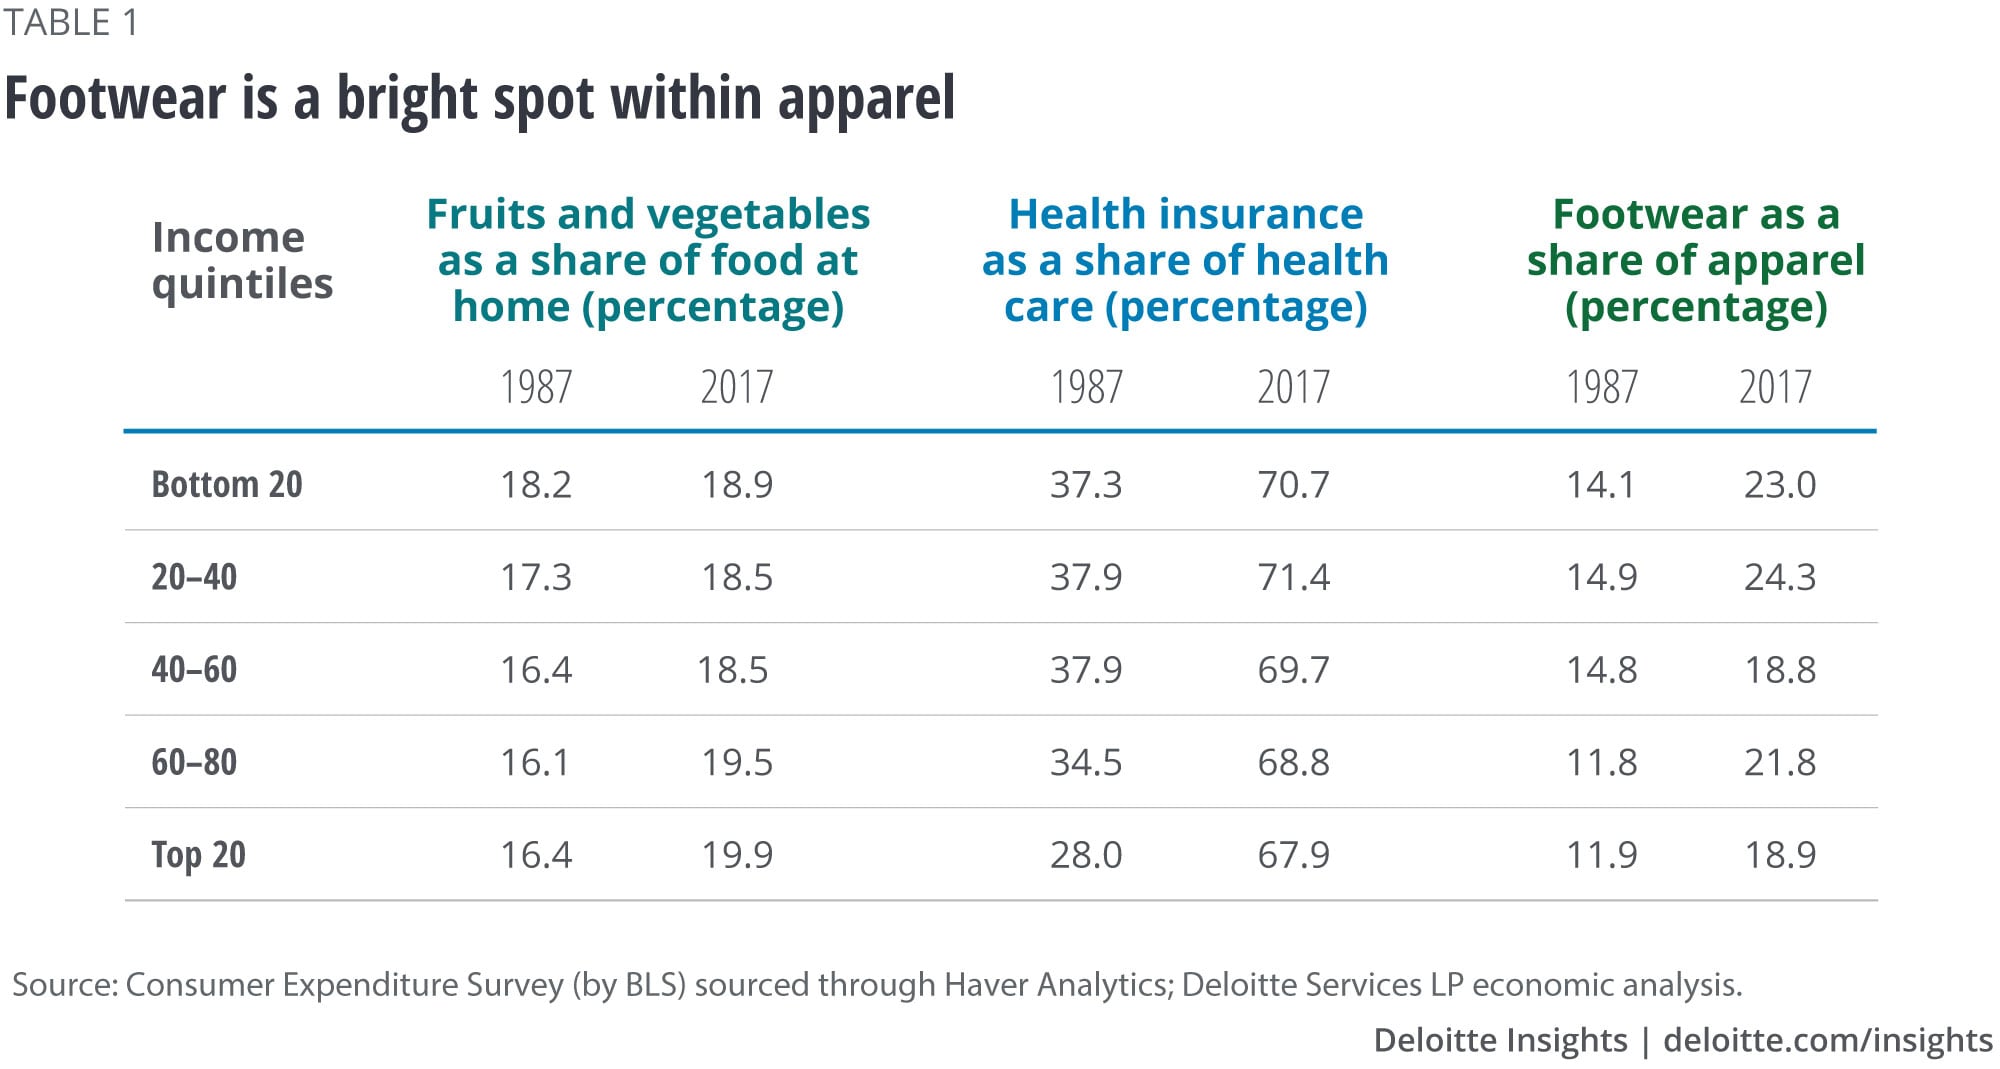
- Within food spending at home, the share of the component comprising sugar and other sweets, fats and oils, and nonalcoholic beverages has gone up over the years. And so has the share of fruits and vegetables, especially for higher-income groups (table 1).
- The share of spending on women and girls’ apparel in average apparel spending has declined, more so for lower-income individuals. The only bright spot in apparel appears to be footwear, whose share in apparel expenditure has gone up across income levels.
- Within health care spending, the share of health insurance has gone up at the expense of medical supplies, medical drugs, and medical services. This is true for all income quintiles.

Of changing economic conditions and tastes
The changing patterns of consumption over the years bring to the fore the impact of influences such as changes in income, price, and tastes and preferences. For example, what explains the declining share of food in average consumer expenditure? According to economic theory and empirical evidence, as income increases, expenditure on food increases less than proportionately.4 The need for healthier diets5 may be the reason behind the rising shares of fruits and vegetables in spending on food at home, with higher-income groups shelling out more on these items due to better spending ability and accessibility to healthier food.6 Rising health care costs7 may help explain the allocation of more consumer funds to health insurance, thereby driving up the share of health care in consumer expenditure. And a confluence of similar factors may explain the falling share of apparel—for instance, one may prefer to spend on the latest smartphone rather than a jazzy dress.
Such changes over time not only matter to businesses—to cater to changing tastes and demand—but also to policymakers as they aim to address issues such as housing and health care. Add to it the impact of demographic changes and technology, and businesses and policymakers will have their hands full in not only enabling access to a wide range of private and public goods and services, but also in making such access easier and more sustainable.
© 2021. See Terms of Use for more information.


