

The award for stable box office revenues in the face of digital media goes to… has been saved

Predictions
The award for stable box office revenues in the face of digital media goes to…
TMT Predictions 2016
Executive summary
Deloitte Global predicts that the value of movie theater admissions in the US and Canada will fall by about three percent in 2016, to about $10.6 billion, with about 1.3 billion tickets sold. It is impossible to forecast beyond that with any precision: box office is so dependent on the slate of movies released. Since 2007, the trend has been for the five highest-grossing five films to generate over 40 percent of the box office, which accounts for most of the year-on-year volatility.
Between 1996 and 2015, the annual box office revenue change is nearly random, although it has never gone up by more than 10 percent or fallen by more than six percent and the number of tickets sold has never gone up by more than 12 percent or fallen by more than six percent. Given that, we expect average annual revenue growth on the near term to be about one percent, but within a range of plus or minus 10 percent, and the number of tickets sold to decline about one percent per year. Box office dollars are likely to grow, but at a minimal pace, and are actually likely to decline (also at a minimal pace) if inflation is taken into account. However, compared to what has happened to the DVD business, the DVD rental business, and other traditional media, cinema is doing better than most.
It seems likely that the greater ease and accessibility of legal and illegal movie streaming or downloading has had an effect on movie box offices. One estimate of the cost of piracy to the US studios was $6.1 billion a year. And although the dollar value of admissions has been relatively stable, the decline in the number of tickets sold annually in US and Canada since 2002 is down from 1.58 billion to about 1.33 billion in 2015. That 18 percent fall is actually not bad compared to other traditional media in the same time period. Also, it is not as serious as the previous decline in the movie business caused by the rise of TV, which saw US ticket sales fall from 4.7 billion in 1947 to one billion in 1964 – a 78 percent collapse over only 17 years.
What’s more, the focus on domestic box office performance is not even close to the full picture for the movie industry. At one time, international box office was almost an afterthought, but these days US studios assume that international will be 60 percent of total box office for any given film, with some films seeing 75 percent of cumulative box office coming from outside North America. Further, even global box office ticket sales are only about half the story. In 2012, nearly half (48 percent) of total revenues for the average film came from ancillary revenues: home video sales, pay-per-view and TV/over the top (OTT) licensing, syndication fees and merchandising.
The North American market is the world’s biggest box office at about $11 billion annually, but global box office revenues were approximately $40 billion in 2015. Between 2009 and 2013, the North American box office was up about three percent in nominal dollars, but the international markets grew by $6.5 billion or 22 percent in the same time frame, representing 70 percent of all ticket sales by 2013. Certain markets are growing even more strongly than the overall international market: as of December 2015, box office in China was up 49 percent year over year, to $6.78 billion. China is expected to surpass the North American market by 2017 or 2018. In terms of number of tickets sold, India is on top with 2.7 billion admissions in 2013. The rest of the global market is relatively stable: in 2014 Latin America rose two percent, while EMEA fell three percent.
Spending on making movies should assume flat-to-down theatrical revenues, but with an ever-increasing focus on franchises and sequels. Seven of the top 10 movies in 2015 were in this category, and the expected outlook for 2016 is for continued dominance. Sequels and franchises tend to be lower risk, and also enjoy better international success than standalone films. As of late 2015, Hollywood had 157 movie sequels in the works.
The award for stable box office revenues in the face of digital media goes to…
1 For a complete list of references and footnotes, please download the full PDF version of the TMT Predictions 2016 report.
Deloitte Global predicts that the value of movie theater admissions in the US and Canada will fall by about three percent in 2016, to about $10.6 billion, with about 1.3 billion tickets sold. It is impossible to forecast beyond that with any precision: box office is so dependent on the slate of movies released. Between 1996 and 2015, the annual box office revenue change is nearly random, although it has never gone up by more than 10 percent or fallen by more than six percent and the number of tickets sold has never gone up by more than 12 percent or fallen by more than six percent. Given that, we expect average annual revenue growth in the near-term to be about one percent, but within a range of plus or minus 10 percent, and the number of tickets sold to decline about one percent per year. Box office dollars are likely to grow, but at a minimal pace, and are actually likely to decline (also at a minimal pace) if inflation is taken into account.
The annual movie box office is driven heavily by the fortunes of the top five blockbusters. The popularity of these films accounts for most of the year-on-year volatility. Since 2007, the trend has been for the five highest-grossing films to generate over 40 percent of the box office (see Figure 1). In 2014 the top five fared poorly and the box office fell five percent. Last year was better, up a forecast eight percent. 2016 may surprise, but at time of writing one industry forecast is for a slightly weaker slate of blockbusters, and therefore a decline, although not as bad as 2014.
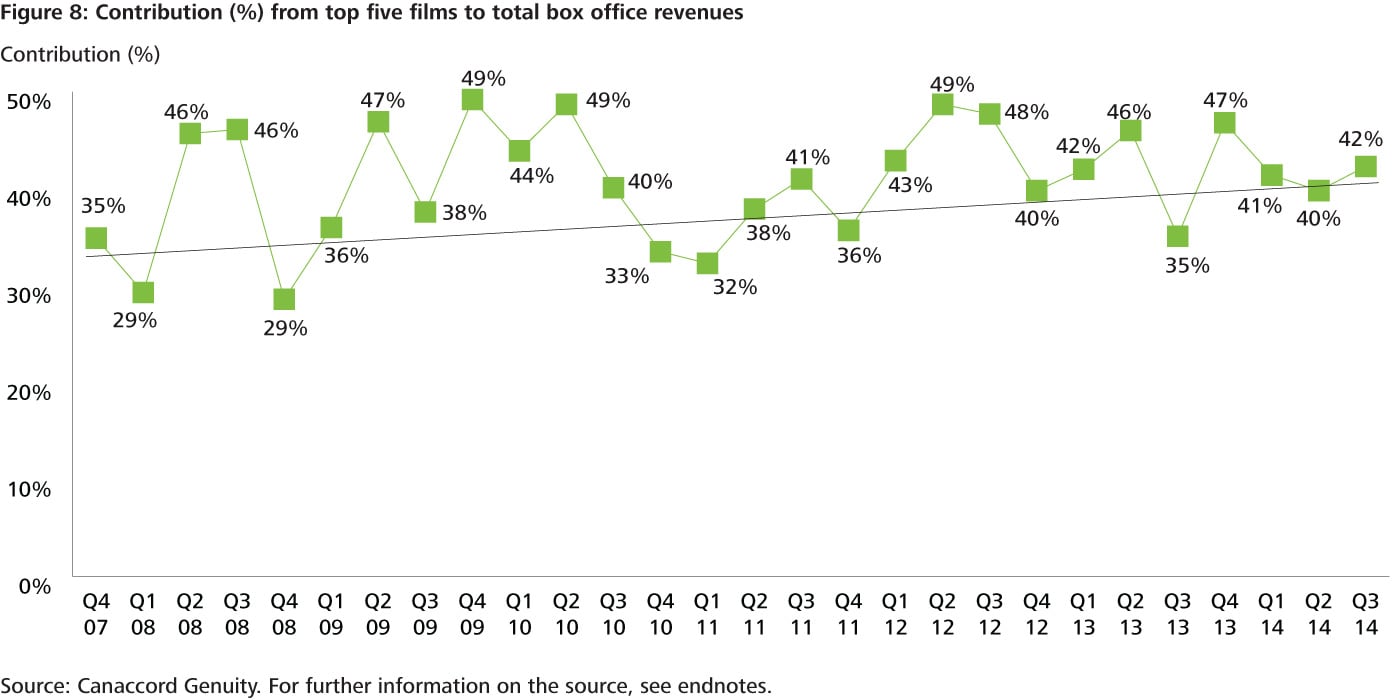
Source: Canaccord Genuity. For further information on the source, see end notes.
As stated previously, between 1995 and 2015 annual revenues for the US and Canadian box office (called the North American box office by the movie industry, although it does not include Mexico) fluctuated in a relatively narrow range of up 10 percent and down 6 percent. Although the effects of inflation have been small in any given year, the cumulative effect over 20 years is that a box office dollar in 1995 is worth $1.57 in 2015. A chart of box office revenues in constant dollars and also the number of tickets sold shows a clear picture: both admissions and constant dollar revenues grew from 1995 to 2002, and since then both inflation-adjusted revenues and admissions have fluctuated, but are in slow decline. From 2002 to 2015, admissions have fallen from 1.55 billion to 1.33 billion, or an annual compounded rate of 1.17 percent, while revenues declined at a 0.79 percent compound rate in constant 2014 dollars, from $12.03 billion to $10.85 billion, see Figure 2.

Sources: Statista, MPAA, Deloitte Canada estimate. For further information on the sources, see end notes.
A sub-one percent average annual decline in admission revenues is not indicative of a growth industry, especially considering population growth of 1-2 percent. In fact, Figure 3 shows that per capita admissions in the US and Canada have been declining at a fairly consistent rate since 2005, from 4.4 visits per year to 3.9: an 11 percent decline in total, or a 1.2 percent annual compounded decline.
The revenue impact has been mitigated, even in constant dollar terms, as US movie ticket prices have risen slightly faster than inflation, in part due to a mix with more expensive 3D and large format movies (such as IMAX). The average ticket in 1995 was $4.59 in 1995, and $8.17 in 2014, but in constant 1995 dollars the 2014 number is $5.27, which is annual price growth of almost exactly one percent above inflation.
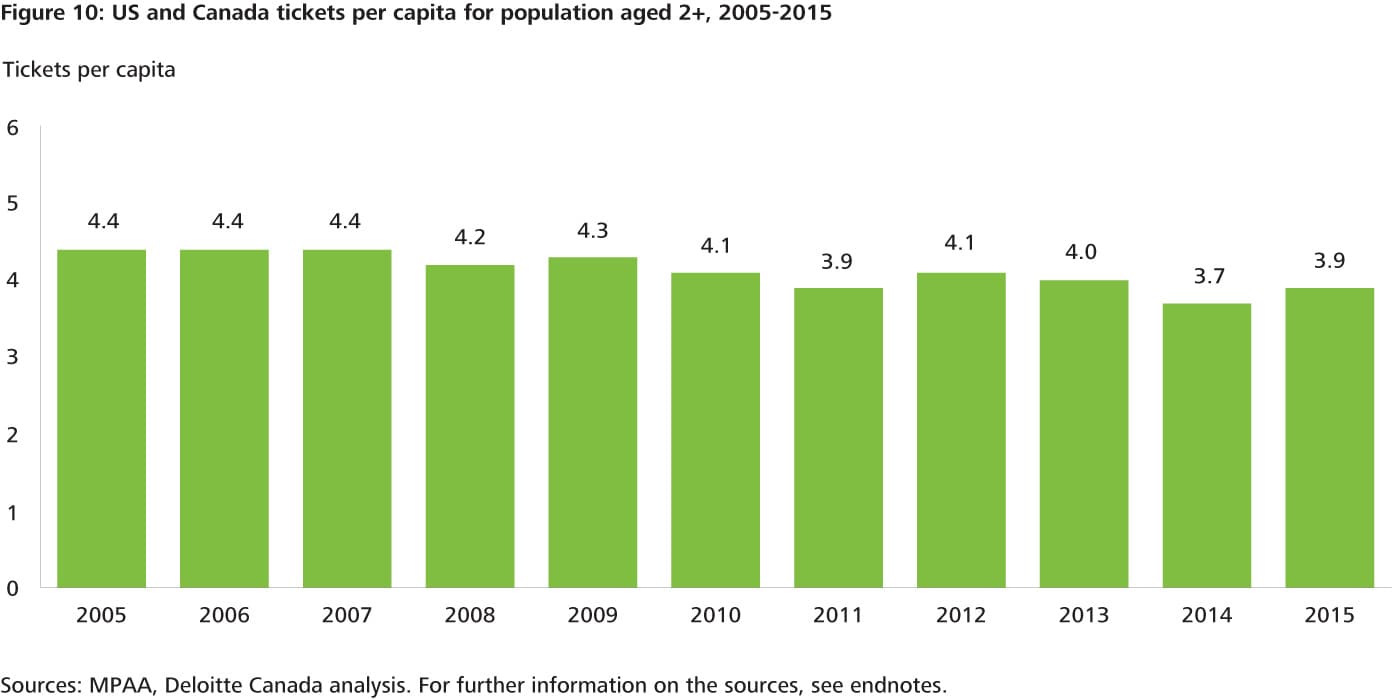
Sources: MPAA, Deloitte Canada estimate. For further information on the sources, see end notes.
But compared to what has happened to the DVD business, the DVD rental business, and other traditional media, cinema is doing better than most.
Charging for feature films has been an industry for over 100 years. Globally the industry is about $40 billion per year, and although it is declining in some markets, it is doing so at a very moderate pace compared to other industries that face threats from digital and the Internet.
It seems likely that the greater ease and accessibility of legal and illegal movie streaming or downloading has had an effect on movie box offices. One estimate of the cost of piracy to the US studios was $6.1 billion a year. What was a growth industry to 2002 is now marked by annual fluctuations around a slow decline. And although the dollar value of admissions has been relatively stable, the decline in terms of tickets is steeper: compared to a 0.8 percent decline in constant dollars for 2002-2015, the number of tickets sold has declined about twice as quickly at 1.5 percent annually.
That is still not the kind of erosion seen in many other traditional media, but given that movie theater owners make money from both admissions and concessions, the number of tickets matters a lot. Concession revenues are about 45 percent as the amount of the money from admissions, but they are an even larger source of profits, with margins of about 85 percent.
It is also worth noting that the number of tickets sold annually in US and Canada since 2002 is down from 1.58 billion to about 1.3 billion in 2015. That 18 percent fall is not bad compared to other traditional media in the same time period, but is also not as serious as the previous decline in the movie business caused by a new technology. In 1947 US box office reached a peak of 4.7 billion tickets sold, but the rise of TV saw ticket sales fall to a billion by 1964 – a 78 percent collapse over only 17 years.
Importantly, the stability of movie admissions is not being driven by older audiences, in the way that TV viewing is, where younger viewers watch about half as many hours per day as people aged 65 or over. The average North American aged 2 or over attended just under four movies per year in 2015, while the average 12-24 year old went to 6.3 movies. Yes, they are consuming movies on YouTube, iTunes application program, Netflix and illegal streaming/download sites, but they continue to over-index on cinema-going as well, citing the ability to socialize with friends and the big screen experience.
Bottom line
Spending on making movies should assume flat-to-down theatrical revenues, but with an ever-increasing focus on franchises and sequels. Seven of the top 10 movies in 2015 were in this category, and the expected outlook for 2016 is for continued dominance. Sequels and franchises tend to be lower risk, and also enjoy better international success than standalone films. As of late 2015, Hollywood had 157 movie sequels in the works.
This prediction focuses on domestic box office: the data shows that the number of tickets and dollars from theatrical admissions is more resilient than many think. But the focus on domestic box office is not even close to the full picture for the movie industry. At one time, international box office was almost an afterthought, but these days US studios assume that international will be 60 percent of total box office for any given film, with some films seeing 75 percent of cumulative box office coming from outside North America. Further, even global box office ticket sales are only about half the story. In 2012, nearly half (48 percent) of total revenues for the average film came from ancillary revenues: home video sales, pay-per-view and TV/OTT licensing, syndication fees and merchandising.
The US and Canada market is the world’s biggest box office at about $11 billion annually, but global box office revenues were about $40 billion in 2015. As of 2013, the five biggest international box office markets after North America were China ($3.6 billion), Japan ($2.4 billion), UK ($1.7 billion) France ($1.6 billion) and India ($1.5 billion). Between 2009 and 2013, the North American box office was up about three percent in nominal dollars, but the international markets grew by $6.5 billion or 22 percent in the same time frame, representing 70 percent of all ticket sales by 2013.
Certain markets are growing even more strongly than the overall international market: as of December 2015, box office in China was up 48 percent year over year, to $6.3 billion. China is expected to surpass the North American market by 2017 or 2018. The growth in China’s box office is being driven in part by expansion in the number of screens: 25,000 additional screens are expected to be added in the next five years, which is more than the total number of screens in the country at the end of 2014. This will take China well past the North American market, with its 40,000 screens as of 2014. The number of admissions in 2014 was 830 million, and assuming that growth in attendance is in line with the revenue increase at the box office, admissions should be around 1.2 billion for the full year 2015, virtually tied with the 1.3 billion in the North American market.
Although the Chinese and North American market are jockeying for leadership in terms of annual box office revenues, in the number of tickets sold, both are well behind India, which had 2.7 billion admissions in 2013. The rest of the global market is relatively stable: in 2014 Latin America rose two percent, while EMEA fell three percent.
The North American market is likely to be typical, at least for English-speaking markets. Admissions and revenues for the UK and Australian markets are roughly in line with US trends across multiple periods, as can be seen in Figure 4, although the revenue measurements are in nominal dollars rather than constant dollars.
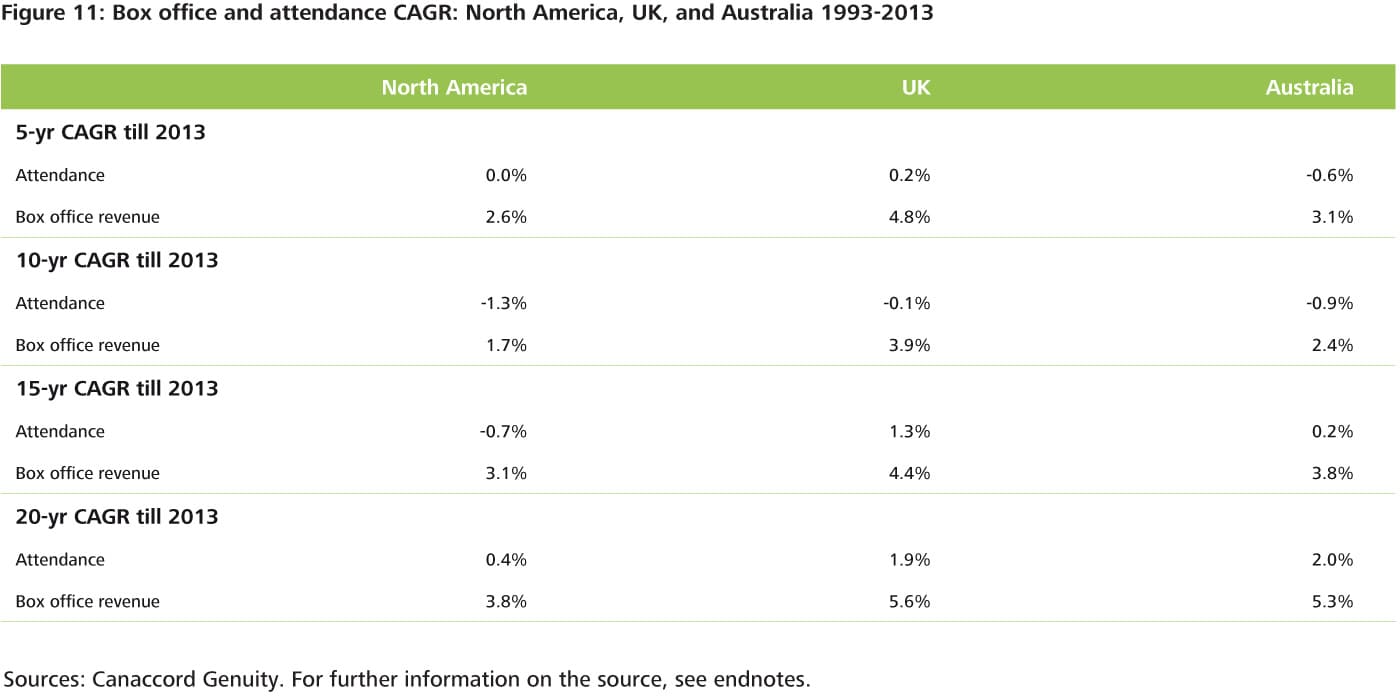
Source: Canaccord Genuity. For further information on the source, see end notes.
Since movie theaters share ticket revenues with the movie distributors, but keep all of the concession profits for themselves, we expect to see the price of popcorn and other treats continue rising faster than the rate of inflation or ticket prices.
Exhibitors can continue to promote premium movie experiences such as 3D and IMAX, although at the risk of pushing some people away due to high prices. The annual growth in ticket prices is only about one percent in real terms, and the industry may want to highlight this fact, since the perception is that ticket prices have grown much faster.
Also exhibitors can drive better use of under-utilized exhibition space, such as by showing live operas, renting out meeting rooms to businesses, or as eSports venues.
@DeloitteTMT