What’s keeping inflation up … and the Fed
The July 2024 Economics Insider explores how services prices have kept inflation above the Fed’s target, making its future monetary policy decision-making more measured

In the last quarter of 2023, as inflation edged downward, all eyes turned toward the Federal Reserve (Fed). After all, many economists and financial markets seemed convinced that it was just a matter of time before the Fed started cutting the federal funds rate. In CNBC’s Fed survey of economists, strategists, and analysts in December 2023, the average expectation was of 85 basis points of rate cuts in 2024.1 That was not very far from the Federal Open Market Committee’s (FOMC) own median view at that time—75 basis points of cuts over this year.2 Yet, inflation hasn’t played out exactly as people had hoped last year—it is still higher than the Fed’s target. Hence, the FOMC’s projections have changed—the median view now is of just one rate cut in 2024.3
So, why has inflation4 remained stubborn? After all, durable goods inflation—which surged in 2021 and early 2022 due to global supply chain constraints—has come down to pre-pandemic levels. Energy and food prices have also fallen from their peaks. The answer lies in services. While services inflation has eased since early 2023, it is still above pre-pandemic levels. Within services, it is housing that is currently keeping price pressures elevated. Housing-related inflation is unlikely to fall sharply in the near term due to demand-supply mismatch and because of the way it is calculated in the indices of consumer inflation.5
The Fed’s preferred inflation gauge isn’t the consumer price index
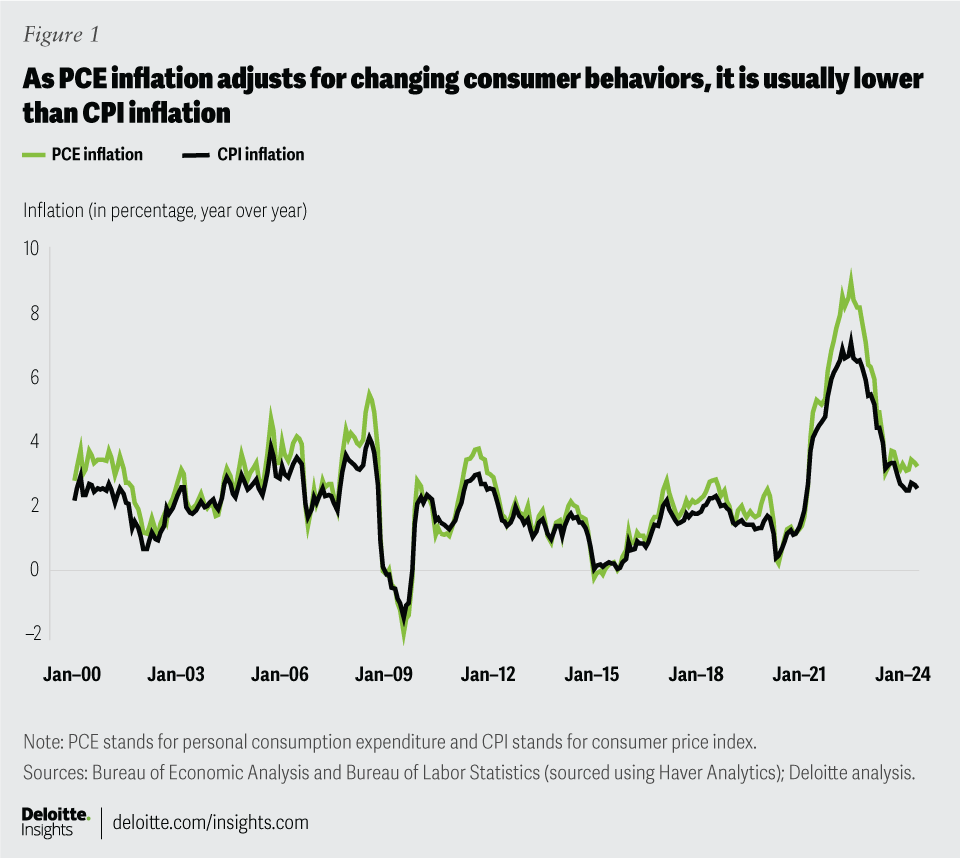
Since 2000, the Fed’s preferred inflation gauge has been the personal consumption expenditure (PCE) price index from the Bureau of Economic Analysis.6 This measure is different from the more popular consumer price index (CPI) from the Bureau of Labor Statistics.7 Within the PCE price index, the Fed focuses on core inflation, which excludes food and energy, as monetary policy hardly has any impact on their prices.
There are three reasons why the Fed prefers to track PCE inflation.8 First, the PCE index includes a wider array of goods and services than the CPI, which only accounts for consumers’ out-of-pocket spending. Second, the PCE basket accounts for changing consumer behavior in response to relative price movements and changes in the quality of goods and services; while revisions do happen for the CPI basket, they are not frequent.9 That is a key reason why PCE inflation tends to be lower than CPI inflation at times of high price growth (figure 1). Finally, the PCE index can be revised to adjust for new information or changes in measurement techniques. Both indices, however, are solid indicators of inflation, and the Fed usually keeps an eye on both.

Transition from goods to services: A journey of post-pandemic inflation
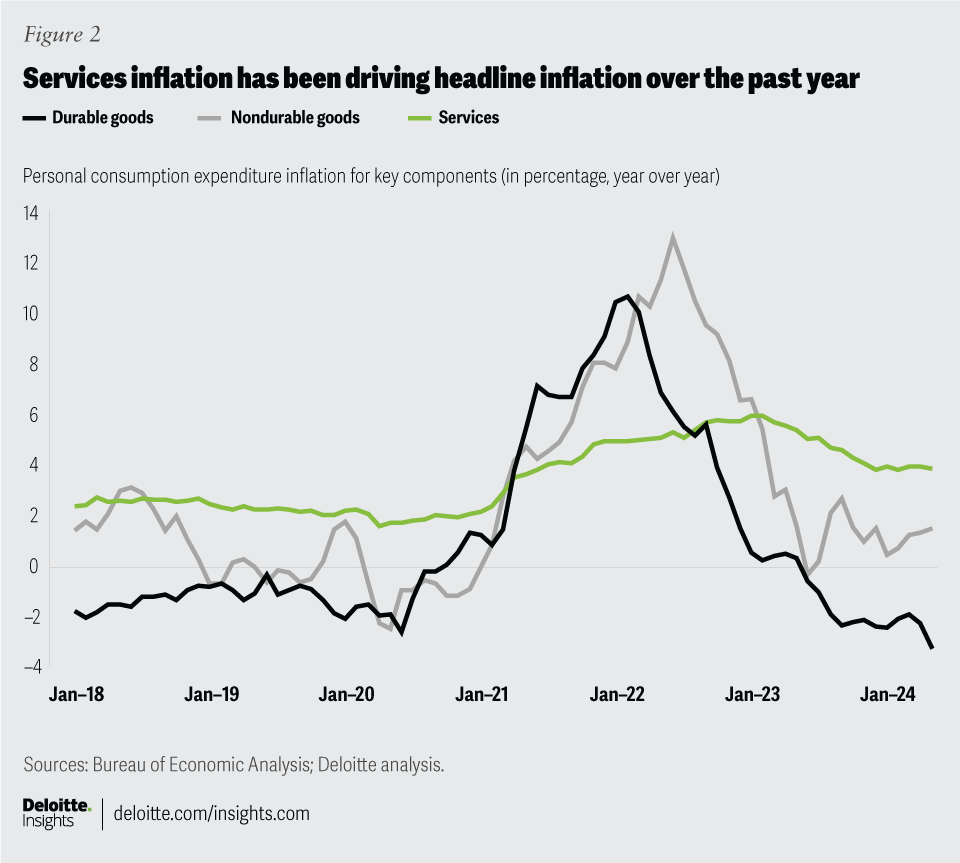
The first phase of inflation after the pandemic started in 2021, when prices of durable goods started going up sharply. Real consumer spending10 on durable goods rose by a staggering 16.7% in 2021, and most of that increase took place during the first quarter of that year. Global supply chains, however, couldn’t manage this surge, handicapped as they were by COVID-19–induced restrictions. Supply chain pressures, as measured by the Federal Reserve Bank of New York, surged to their peak by December 2021.11 Supply chains, however, started easing in 2022 as global economies reopened after widespread vaccinations; by that time, consumer demand also started shifting to services. So, from a peak of 10.7% in February 2022, durable goods inflation has steadily declined and is now back to its pre-pandemic trend (figure 2).
While durable goods inflation was rising in 2021, energy prices also went up and peaked in mid-2022 due to the Ukraine-Russia war, a war that also disrupted global food markets. That, along with the rising cost of production (due to high energy prices) and a serious outbreak of avian flu in the United States, drove food prices up as much as 12.2% by August 2022.12 The surge in prices of these two key nondurable goods constituted the second phase of post-pandemic inflation. Thankfully, food and energy prices have eased since 2022. Consequently, nondurable goods inflation is now below 2%.

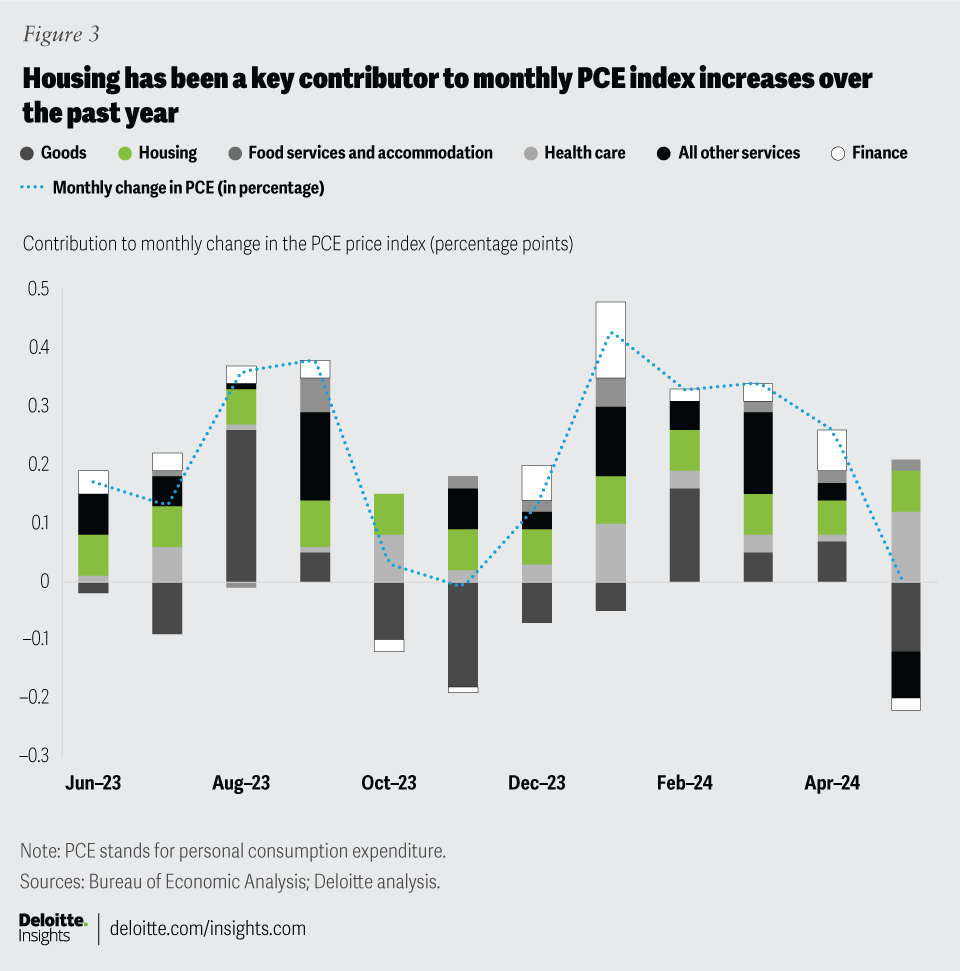
As figure 2 shows, it is services inflation that has taken over from goods since early 2023. Figure 3 highlights percentage contributions of key components to monthly change in the PCE price index over the last year. What is evident from this data is that while contributions from goods and certain services have fluctuated, two key components have been contributing steadily to monthly price increases for these 12 months, namely housing services and, to a lesser extent, health care services.13
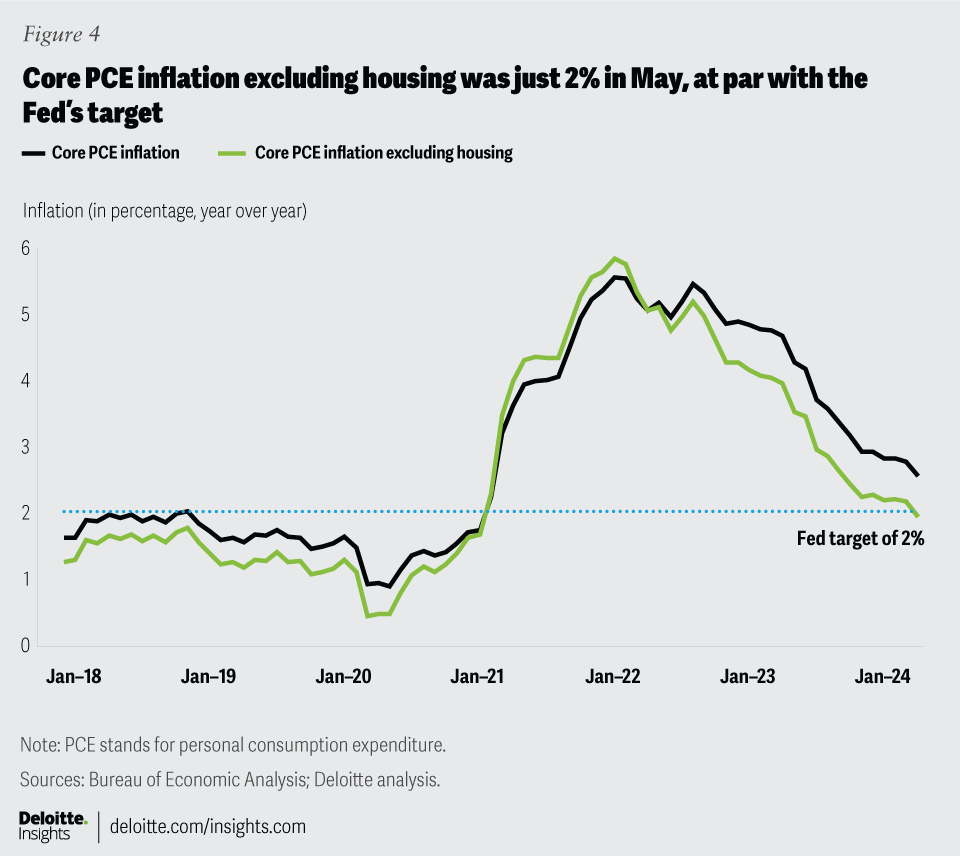
Health care inflation has been relatively stable, fluctuating within a range of 2% to 3.1% since January 2023. Housing inflation, on the other hand, has been subject to wider swings.14 It reached a peak of 8.6% in February 2023, and although it has eased since then, it remains elevated, standing at 5.4% in May 2024. In fact, core PCE inflation excluding housing was just 2% in May, hitting the Fed’s target (figure 4).


What’s driving housing inflation?
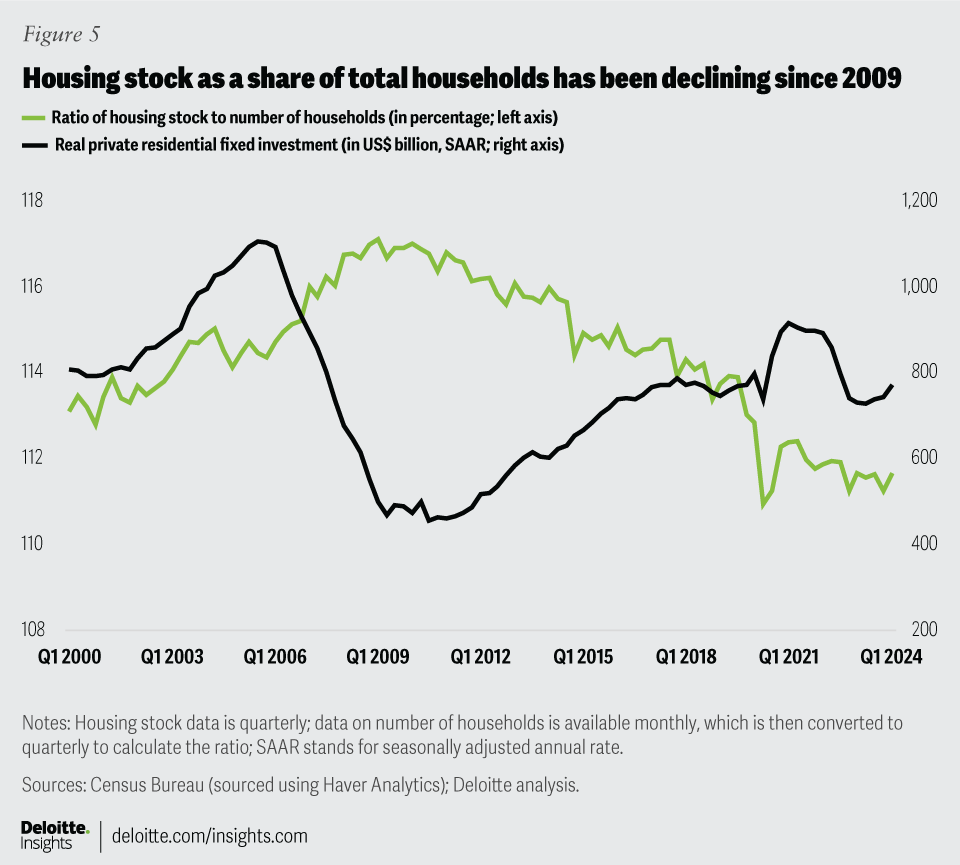
There are many interconnected factors keeping housing inflation elevated. The economy’s current housing stock hasn’t kept pace with the country’s population growth.15 Total housing stock as a percentage of the total number of households has been declining steadily since the end of the global financial crisis (figure 5).16 New construction has declined as well. Real investment in private housing, for example, is down 15.6% since the first quarter of 2021 and is now back to levels seen right before the pandemic.17 Housing starts and building permits—an indicator of future starts—have gone down steadily over the past two years.18

An overwhelming majority of US mortgages are fixed-rate ones.19 And for a large share of homeowners with such mortgages, the rates are likely much lower than current rates. For example, the 30-year fixed mortgage rate was 7.4% by the end of June 2024—more than twice the figure seen three years back. High rates, therefore, have prompted families with fixed-rate mortgages to avoid selling their current homes as they wait for rates to come down. Researchers at the Federal Housing Finance Agency estimate that this mortgage-rate “lock-in” lowered home sales by as much as 1.3 million between the second quarter of 2022 and the last quarter of 2023.20 Indeed, existing home sales are down 36.1% since its most recent peak of January 2022.21
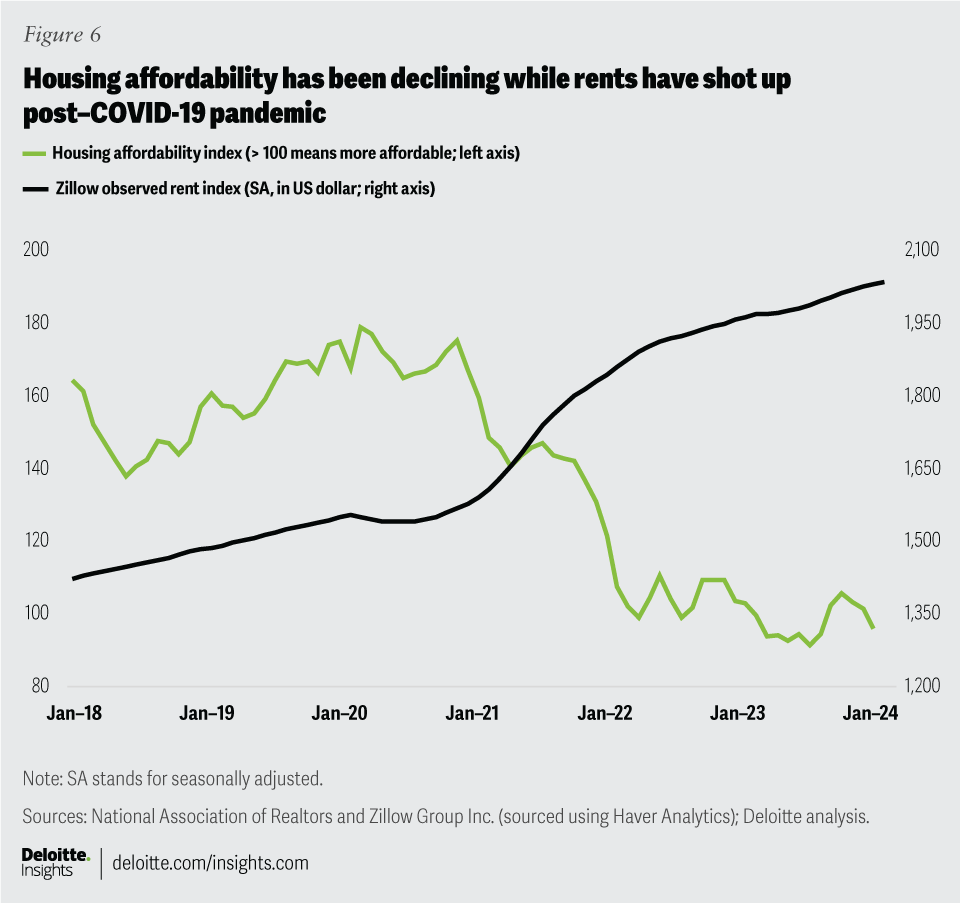
While existing home sales have declined, home prices have gone up. The median sales price of existing homes is now at its highest level since records started.22 Consequently, housing affordability has declined and is now one of the lowest since the 1980s (figure 6).23 With homeownership being out of reach for many—especially for first-time homebuyers—demand for rental accommodation has gone up. This in turn has pushed up rents—Zillow’s rent index is now 30.7% higher than year-end 2020.

Housing inflation should ease, but it may be a slow process
High home prices along with low housing stock are expected to spur new construction. Deloitte economists forecast real investment in private housing to rise 5% in 2024 after contracting by 10.6% last year.24 This is likely to ease the pace of home price growth, and hence aid affordability. The impact on affordability will be higher if the share of “starter homes” rises, and new supply is in areas of the country where demand growth has surged the most.
The availability of existing homes for sale will, however, take time to increase. The differential between current fixed mortgage rates and what homeowners may have locked in till 2021 is still very high. And even if this differential goes down, research by the Federal Reserve Bank of New York shows that actual sales may be impacted more by homeowners’ perceptions about the rate they will receive on a new mortgage rather than the actual rate itself.25
As homebuying increases, demand for rental accommodation will slow. This will bring down the pace of rent growth. Already, rents have eased with the year-over-year rise in Zillow’s rent index, which now stands at 3.4%—slightly lower than the average increase in 2019. Any decline in rent growth, however, will percolate down to housing inflation slowly. That’s because of the way consumer price indices calculate housing inflation. While the Zillow rent index tracks the asking rent for prospective clients, PCE and CPI consider the rent agreed on current leases—some of these may have been signed months back. So, as official measures of consumer prices catch up to current trends in rents, housing inflation will decline, although slowly.26
Productivity gains have softened the impact of rising wages on inflation … for now
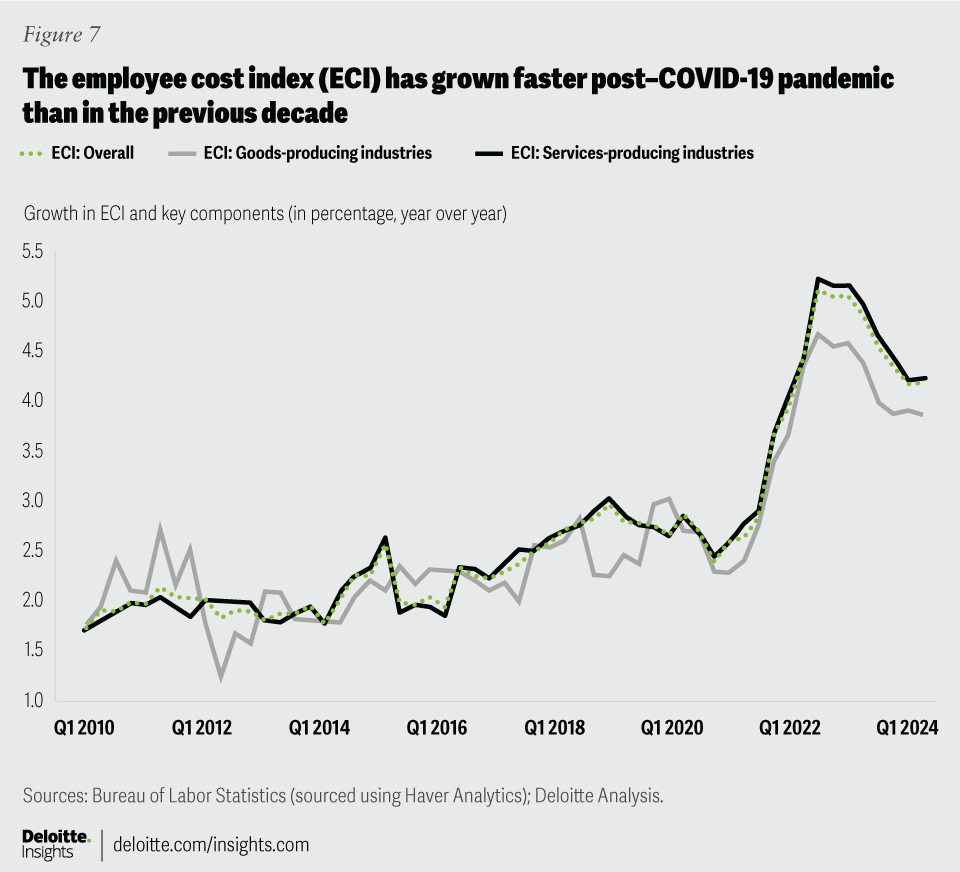
A tight labor market with high wage growth has also raised concerns about wage-push inflation. This channel of inflation assumes that, as wages rise, businesses pass these rising costs to consumers through higher prices. Indeed, wages have grown faster post pandemic than in the previous decade. This is evident from figure 7, which shows trends since 2010 in the Bureau of Labor Statistics’ employment cost index—including employee benefits and wages and salaries—for goods- and services-producing industries.27
Employee compensation accounts for a higher share of cost of production in services than goods-producing industries.28 With compensation rising more than the pre-pandemic average and PCE services inflation also high, is wage-push inflation at play? Research by economists at the Federal Reserve Bank of San Francisco in 2023 found that rising labor compensation has aided core PCE inflation (through nonhousing services inflation), but the impact is small.29 Similarly, researchers at the Federal Reserve Bank of Boston found that wage growth has not been a major driver of elevated inflation.30
High compensation growth hasn’t affected inflation much due to labor productivity growth.31 Gains in productivity have enabled businesses to absorb rising costs without passing on the burden to consumers through higher prices.32 And productivity has risen more in services-producing industries, therefore softening the blow of higher compensation growth in services-producing industries.33 However, any slowdown or reversal in productivity growth amid rising wages may put upward pressure on consumer inflation.

The Fed is expected to tread cautiously
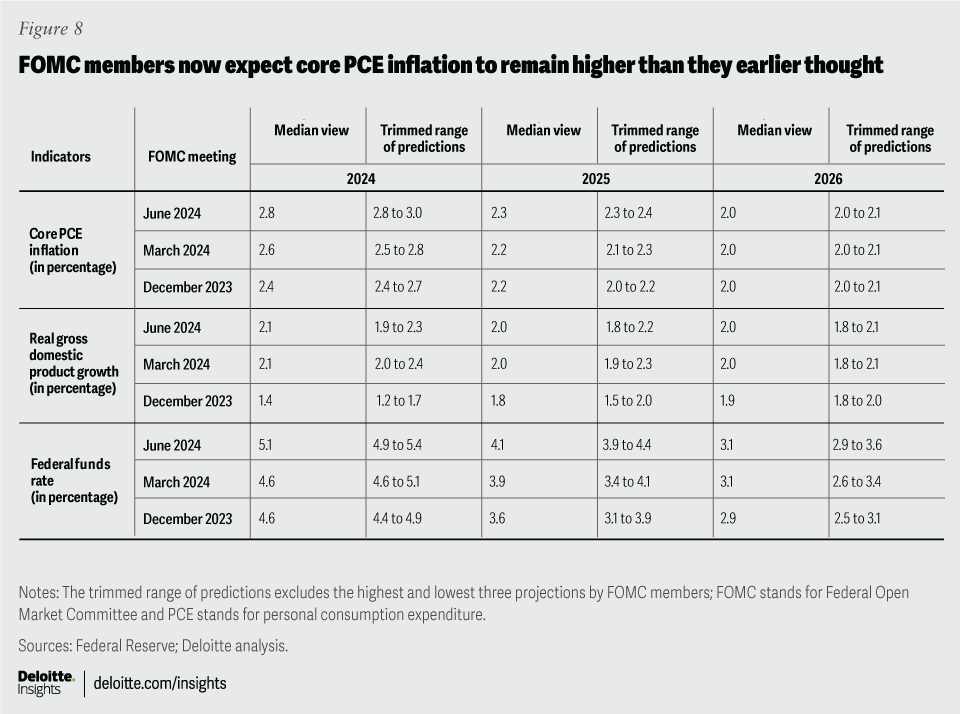
The slow progress against inflation made this year has made the Fed cautious. In its latest summary of economic projections, the median view of Federal Open Market Committee (FOMC) members is that core PCE inflation will decline gradually from 2.8% this year to 2.2% by 2026—that’s a longer inflation-reduction trajectory than what the FOMC had predicted in the previous two quarters (figure 8). That likely explains the FOMC’s change in views on the path of monetary easing between December 2023 and March 2024 (figure 8).34
As PCE data for May filtered in late in June (after the FOMC meeting), committee members would have noted the decline in core PCE inflation. But they wouldn’t have missed the slower decline in housing inflation. Unless inflation eases faster and sustainably, the FOMC is unlikely to change its stance. What may make them even more cautious, however, is any sharp drop in productivity growth amid a tight labor market. For then, it will have to worry about taming not only aggregate demand but also wage-push inflation.


