Making the invisible visible How network analysis can lead to more successful organizational redesigns
13 minute read
27 February 2019


Organizational network analysis (ONA) can help leaders understand the formal and informal networks in their company and might provide critical insights leading to more successful organizational redesign and business performance.
Today, nine out of 10 companies are exploring organizational redesign,1 often breaking down functional silos and replacing them with cross-functional collaboration models in an effort to better drive innovation, speed, customer value, and operational efficiency. Surprisingly, only 10 percent of leaders feel confident these changes will achieve the desired results.2 The challenge is knowing how to balance both adaptable networks of teams and more traditional hierarchical models to drive better results.3 If we think of one end of the spectrum as being silos and the other as swarms (see sidebar, “The spectrum of silos and swarms”), what is the optimal balance and combination for each organization? How do you take the applicable concepts from agile, for example, and improve an organization’s design so they are more flexible? And how do you implement this complex mix successfully?
Learn More
Download the article PDF
Explore the Future of Work collection
Subscribe to receive related content
These are high-stakes questions and implementing the answers is not for the faint of heart. With more than 80 percent of company reorganizations failing to realize intended value in the time planned, and up to 10 percent causing real damage to the company,4 the need to use both art and science in the design of the organization has seemingly never been greater. One generally essential element for success is to understand the informal structures—or the way work actually gets done in your organization—using organizational network analysis (ONA). In this article, we will discuss the opportunities and challenges of hierarchy and team-based structures, and how ONA can offer some of the critical information needed to find the right balance for your organization.
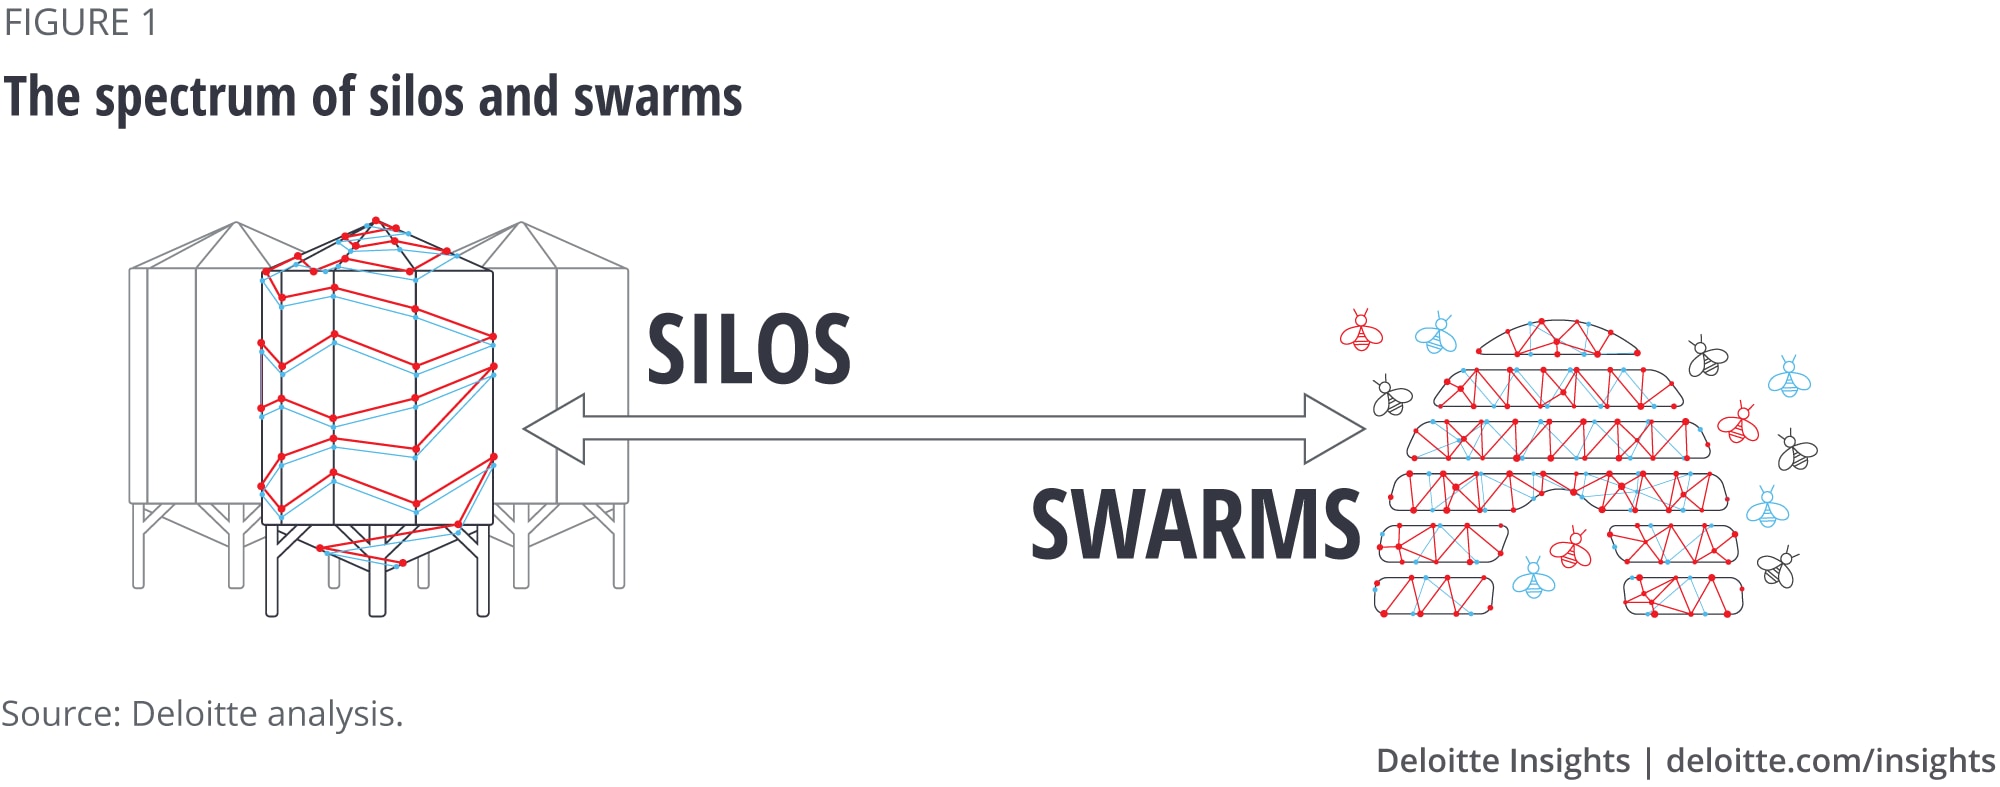
The spectrum of silos and swarms
In heavily siloed organizations, leaders are the main pathway (and often bottleneck) to cross-functional collaboration. At the opposite end of the spectrum is the swarm, where the organization is flat and team members are free to swarm around problems as they arise without a clear decision-making process. Both come with their benefits and challenges—and so organizations are challenged to find the optimal balance based on their goals and the needs of their customers.
Efficiency vs. adaptability: Balancing hierarchy and flexible networks of teams
“What we need is not some new kind of organization. What we need is managerial hierarchy that understands its own nature and purpose … We need to stop casting about fruitlessly for organizational holy grails and settle down to the hard work of putting our managerial hierarchies in order.”—Elliott Jacques, “In praise of hierarchy”5
Organizations have always needed to update their strategies based on changes in their external environments—whether that has required striving for cost efficiency, customer relationship-building, or cutting-edge innovation to compete. Popular structures over time have reflected the needs of their market environment, evolving from formal to functional hierarchy models 50-plus years ago, then more recently to matrixed organizations, and now toward flexible networks of teams—a shift many organizations are still trying to figure out today. But even as we move toward more agile team-based models, it seems that we shouldn’t throw out all elements of hierarchy.
Hierarchy is often criticized for (even equated with) creating intransigent bureaucracies. Critics believe it impedes the free flow of information, stifles individual initiative, fosters infighting and power jockeying, and ultimately chokes the ability of an organization to innovate.6 But while these things can happen, research and our experience present a more nuanced view: Many hierarchies benefit the performance of the groups they lead.7 In fact, in a broad review of research on organizational hierarchy, researchers found that hierarchy has positive effects more often than negative.8 When implemented positively, hierarchy can not only facilitate efficient communication and motivate employees, but can also offer group members clear markers for success and progress, a sense of order and security, and even a sense of place and identity.9
Of course, in today’s dynamic market environment, agile or flexible networks of teams also tend to play a critical role in organizational performance and success. Flexible teams are believed to result in higher team productivity and morale, faster time to market, better work product quality, and lower risk than traditional approaches.10 In a 2017 Deloitte study, 94 percent of participants reported that “agility and collaboration” were critical to their organization’s success.11 This helps demonstrate the importance of designing for adaptability and freeing up people from slow, bureaucratic decision-making that can hinder customer responsiveness, which is needed for market success.
In general, we find that adaptable networks of teams should be prioritized for groups that interact frequently with the external environment. These are often customer-focused, growth-oriented teams (such as sales and product development) organized in a cross-functional, decentralized model. On the other side, the efficiency that more traditional hierarchical models provide should be prioritized for teams that internally support an organization. These are often execution-focused, operational teams (such as finance and legal) organized as a centralized shared-services function. However, organizations need to find their own unique way to balance the benefits of teams and the efficiency of hierarchical models.
Previously, finding this balance was a daunting task, one that has seen mixed results when implemented based on approaches that relied on opinions, hunches, and trial-and-error. Now, with the application of ONA, leaders can garner critical insights into how best to adapt their organization for a more successful future.
Organizational network analysis: A key to a more successful reorganization
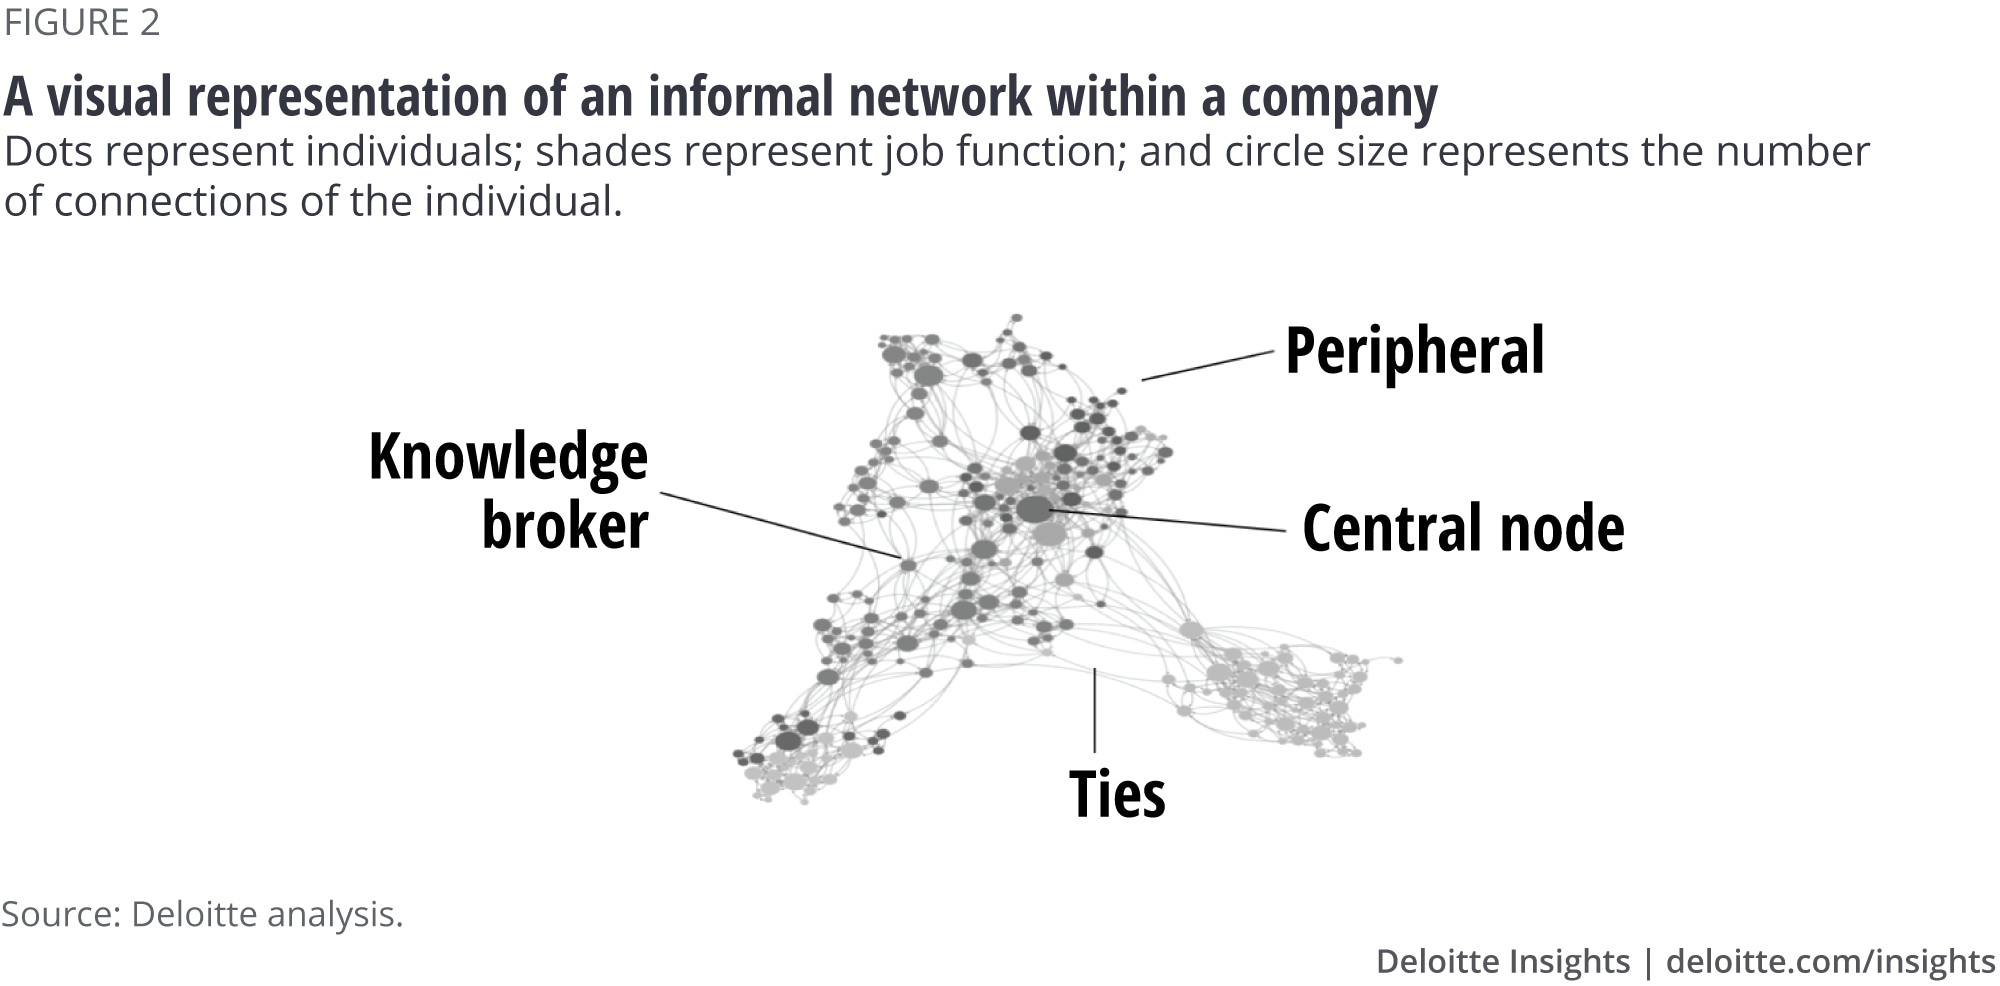
ONA relies on data collected actively (for example, through surveys) and/or passively (for example, through emails, calendar invites, shared drive access) to reveal the invisible communication patterns and flows of information, and, often, the motivations behind them that the traditional organizational chart cannot capture. In other words, ONA shows you who is working with whom to get their jobs done on a day-to-day basis. The analysis results in an organizational map that represents, through nodes and ties, everyone in your organization and how connected or disconnected they are (see sidebar, “Network science 101” and figure 2). This information can highlight where breakdowns could occur, affecting important elements of your business, ranging from efficiency and productivity to diversity, inclusion, and retention to creativity and innovation. This is critically important information, yet surprisingly, in a 2017 Deloitte survey, only 9 percent of business leaders truly felt they understood their internal networks.12
Network science 101
Through the analysis of communication patterns within an organization, we can objectively identify key people and relationships that help your organization function:
- Central node. These are the people who seem to know everyone. Central nodes share lots of information and influence groups quickly. They can be located anywhere in an organization’s hierarchy, are often well-liked, and are highly engaged in company news and developments.
- Knowledge broker. These people create bridges between groups. Without knowledge brokers, information and idea sharing grinds to a halt.
- Peripheral. Easily overlooked and unconnected to the rest of the company, high-potential peripherals can be a risk to organizations. For example, exceptional Java coders who don’t teach others best practices might not only stagnate product development but can also be easily convinced to take their talent elsewhere.
- Ties. Ties are the formal and informal relationships between nodes. Establishing optimal relational ties between central nodes and knowledge brokers can help ensure that useful information moves easily between and within groups.
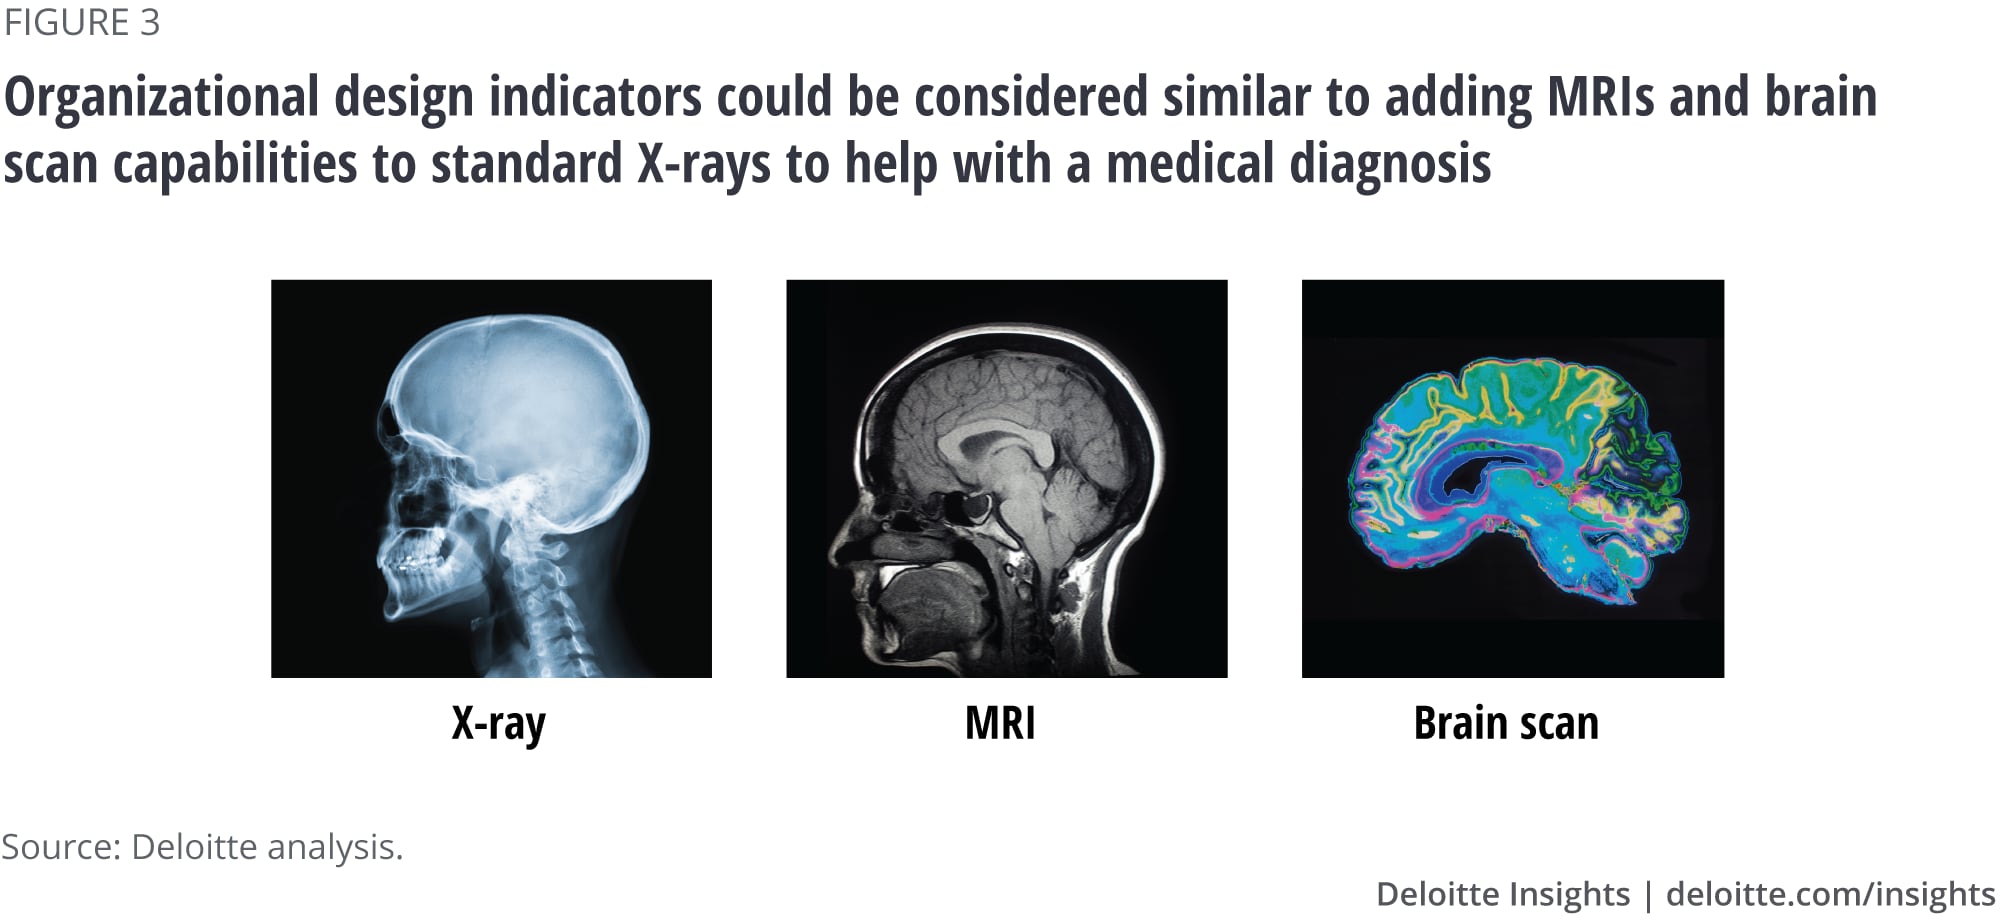
Put simply, ONA offers a powerful suite of analyses that reveals the relationship patterns driving your organization’s success—or dysfunction. Adding this capability to other organizational design indicators could be considered similar to adding MRIs and brain scan capabilities to standard X-rays to help with a medical diagnosis (figure 3). The organizational chart is like an X-ray, allowing you to understand things such as spans of control and layers of management. However, for more information, you need an MRI, which is like including governance, decision-rights, and supervisory burden data to add depth and richness to the formal expressions of the organization. But both of those don’t fully reveal information flows—and so, like a brain scan, we have ONA, which allows us to go beyond the surface of formal information flows to understand levels of trust, markers of innovation, and how people actually work together.
But, knowing this information and putting it to work are two different things. It’s time to put this data to work.
ONA: How it makes invisible networks visible
“The structural designers of organizations, those who mandate reporting relationships or memo distribution lists or access to databases, are much like architects who try to predict where the pedestrian traffic will be or should flow on a university campus. They lay their cement, install fences and other obstacles, but inevitably the flows of people and classes carve bare spots in the grass where the sidewalks need to be.”—Gerald Salancik, “Searching for structure”13
Organizational theorist Gerald Salancik compared organizational design to the process of building sidewalks on a university campus. Your organizational structure is the pavement, and people in your organization will use it so long as it’s efficient and makes sense for where they need to go and what they need to do. Where it doesn’t help, people will create shortcuts along the way. These shortcuts are akin to the informal relationships and communication networks that ONA reveals. While people will always find shortcuts, the design of the formal pathways can either help or hinder how easily people reach their destination—in other words, the extent to which your organizational structure supports your people in getting their work done.
To design an optimal structure, we should better understand how people collaborate to get work done, and we also should be able to detect the systems in place that create the most value. To do that, we have developed a set of ONA metrics based on new algorithms that can help an organization identify where improvements can and should be made to its structure. Ultimately, these measures when evaluated alongside the goals of an organization, can guide us in allocating certain parts of the design to an efficient hierarchical structure and other parts to fluctuate in networks of teams.
Formal structure to informal network comparison. In its simplest form, the comparison of formal to informal network indicates how closely an employee’s formal grouping mirrors the informal network they belong to on a scale of 0–1. If an individual employee has the same connections both formally and informally, the alignment is high and receives a score of 1. Low alignment, or closer to a score of 0, means that employees are more often working outside of their formal reporting structure on a day-to-day basis, thus working around the structure to be successful. In this evaluation, no score is good or bad. High alignment can predict team characteristics like higher cohesion, ease of work, simplicity of interactions, and a fast and efficient pace. However, it could also be indicative of siloed thinking. It’s important to consider the goals of each team to identify how closely aligned the formal and informal networks should be. Teams focused on innovation or that are tightly connected with the customer usually benefit from lower alignment scores, as they need to share information broadly to meet their goals. On the other hand, core business teams more focused on efficiency usually benefit from higher alignment.
Effort analysis. The formal versus informal network assessment can be taken a step further and used to measure how cumbersome a hierarchical structure may be for each employee. In this analysis, ONA looks at individual employees and who they actually work with. It then calculates the average number of steps through the formal hierarchy that it would take to reach the same people. Usually, the fewer the steps, the better the structure is at enabling work because it takes less effort to negotiate resources and to escalate, delegate, and approve their work product. Again, for very high-stakes or consequential decisions—for instance those that involve policy or legal decisions—a more challenging approval process may be worth the effort. However, if customer service and marketing or sales are having difficulty delivering a unified experience to the customer, fewer steps and structural barriers can help to resolve those challenges.
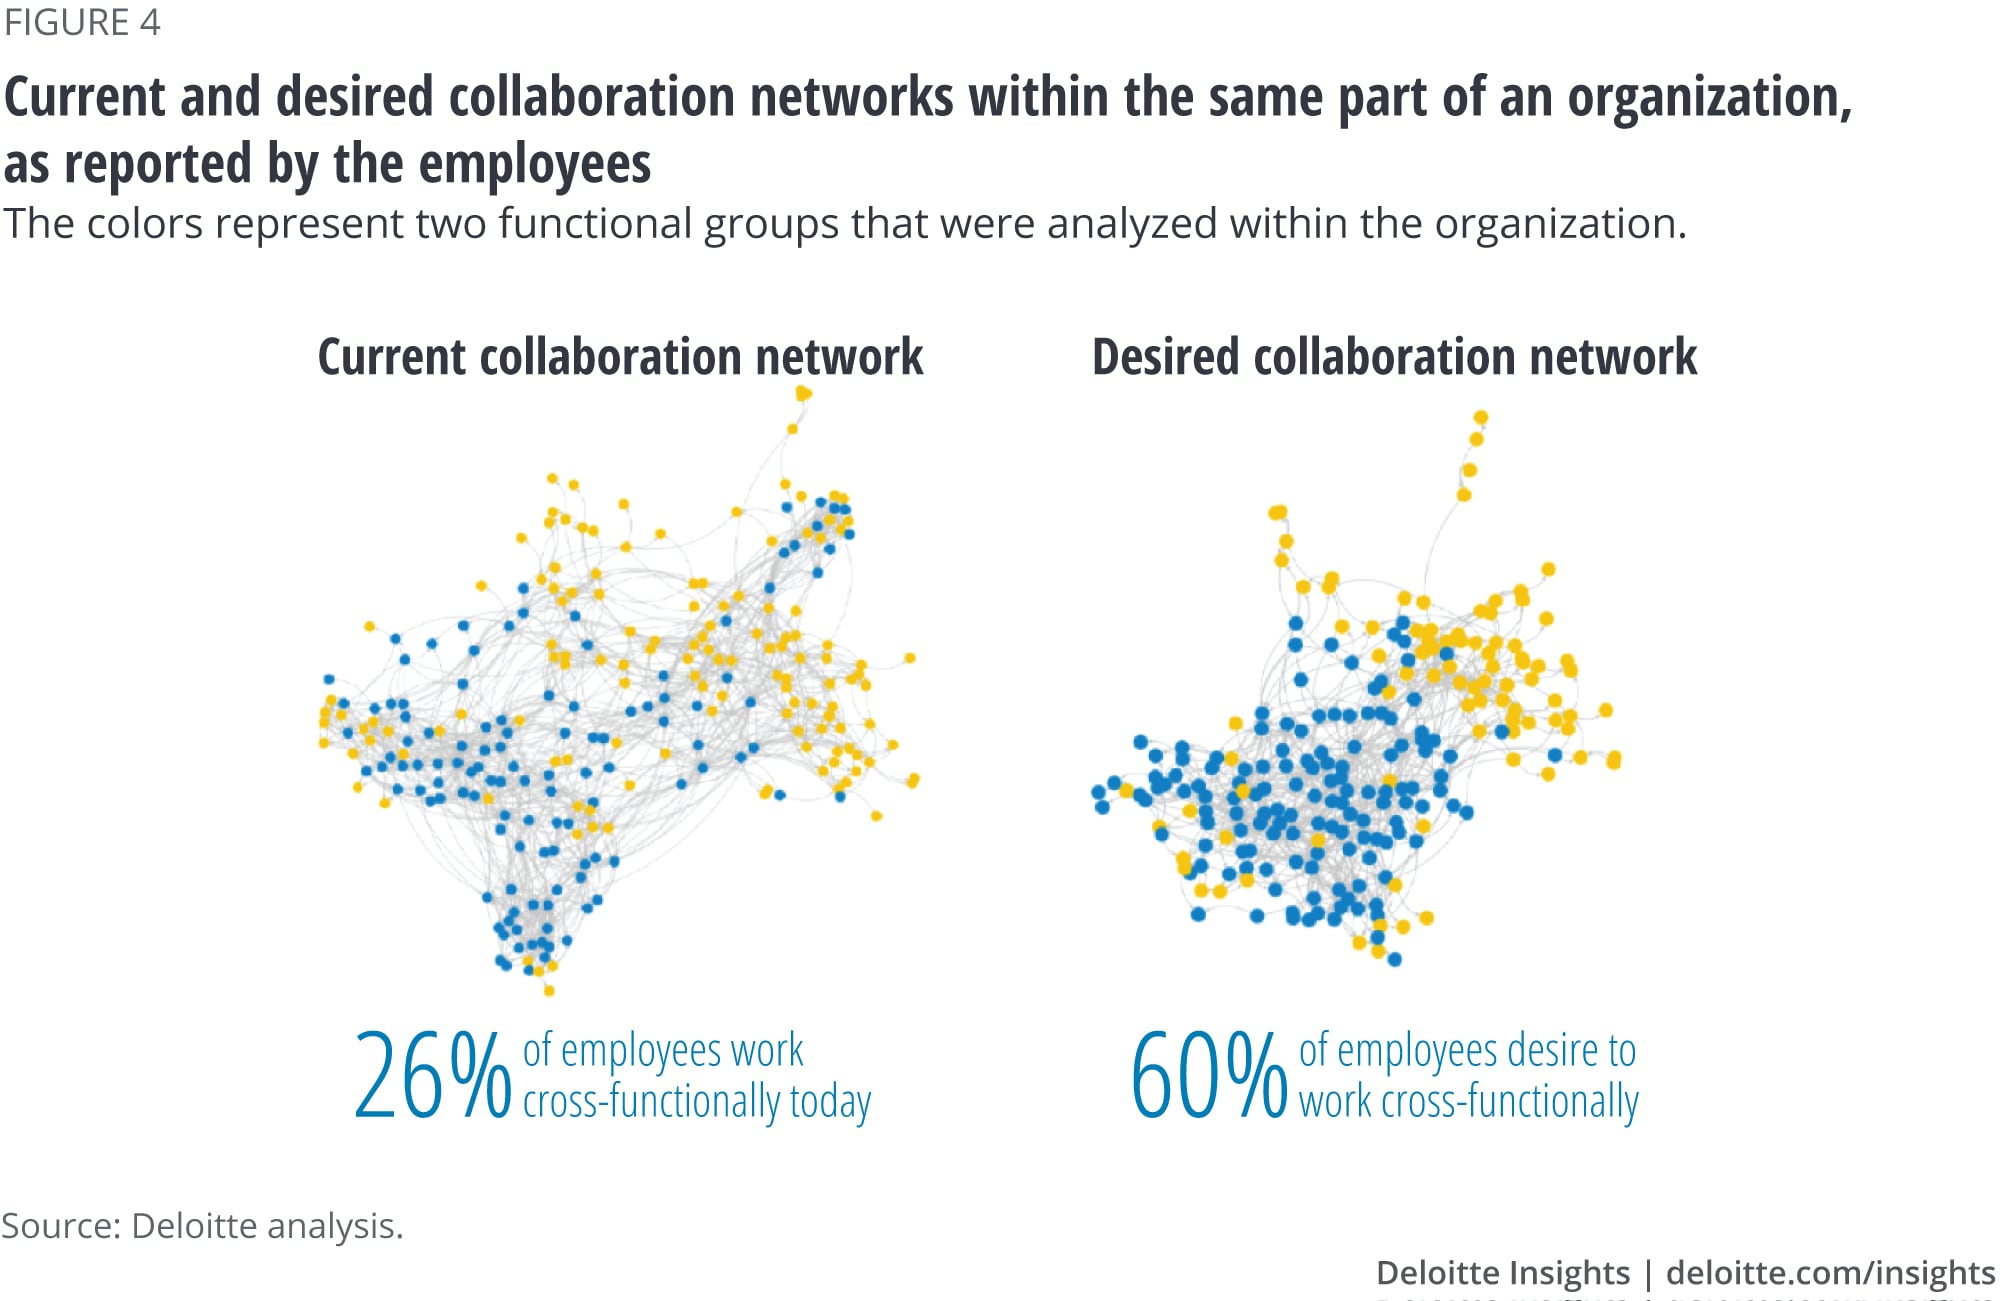
Cross-functional opportunity identification. Understanding the degree to which people are already trying to work around the structure is an important indicator, but it isn’t the whole story. It’s also important to understand the level of collaboration employees feel is required to help the quality of their work. Through ONA surveys, we can identify not only who people are working with today, but who they would like to work with to be more effective. One company, looking at the current level of cross-functional collaboration, found that 26 percent of employees were working outside of their function. However, when the same people were asked who they felt they should be working with to deliver the mission, they found that 60 percent desired more cross-functional access (see figure 4).
Adaptable readiness indication. Just because employees say they want to participate in more cross-functional work, it doesn’t mean they’re fully prepared to do so. It’s important to look at other factors as well to understand whether your organization is ready to work in adaptable networks of teams. These teams require higher levels of collaboration skills, a sense of trust in other departments, and, often, a higher tolerance for risk. ONA can provide indicators of these characteristics for each individual, based on how other people in their network see them today. With this analysis, organizations can understand how much change management and coaching is required for a successful redesign into a more adaptable model.
ONA insights in action: Unlocking organizational power
The insights available in these network maps can lead to transformative change for an organization. What does this look like in practice? Insights from ONA have led to a catalog of creative and, often, counterintuitive solutions—from redesigning the office layout to improve team performance14 to understanding how subtle differences in patient hand-off protocol led to big differences in health outcomes.15
In one example, a Fortune 500 company wanted to explore how an innovation team within the business could scale into the core. Prior to integration attempts with the core business, the innovation team had been a great success. However, as the organization tried to bring more of their ideas to scale, it was met with challenges, the root of which was unclear at first.
Using ONA, the company found that the innovation team and other functions had remained siloed. It also showed that these networks were being held together by a single employee, a significant risk to the business should the employee leave. However, the network analysis also identified a number of employees who had strong influence with many people within each of the groups.
What was the reason for this polarization? The network analysis identified lack of trust as a systemic issue for the organization. Any attempts to foster collaboration were likely to go nowhere until this was addressed. It also highlighted that employees facilitating connection between the two sides were lacking in trust, and solving this would be a key factor in breaking the divide. Understanding who the key influencers were in this dynamic gave clues about where to dig further and whom to bring in as champions for a new solution.
In addition, they performed a customer survey, which helped them to see that while their goal was to be proactive and strategic, information flow began with customer outreach 71 percent of the time. They were also able to identify that their customers were happier when they had multiple expert points of contact instead of a single middleman or liaison who might not have had the right expertise to help them right away.
Without these analyses, the company might have tried to implement a new organizational model without addressing the root cause of the original divide—and without understanding key markers of success from their customers. With this knowledge, the company was able to take steps to address the issue of trust, which could have resulted in the failure of the theoretically “optimal” model. Without taking the time to uncover the invisible networks and how they supported the actual results of the organization, this reorganization could easily have fallen into the long list of failed transformations. The company is now using these insights to optimally adjust their structure to be highly proactive and strategic to their customers. These changes will take into account the existing organizational energy and how work truly gets done to drive adoption and accelerate their results.
No one-size-fits-all solutions: Finding a balanced structure for your unique organization
“We’re agile on the edges. We’re stable at the core. And that’s what an adaptive organization should really look like.”—Michael Arena, chief talent officer at GM16
Organizational designers have long tried to reconcile the tension between the unpopularity of hierarchy and its apparent necessity and figure out what to do about it going forward. By understanding and then changing the network architecture—the landscape of formal and informal networks that drive the interaction patterns of an organization—we can finally resolve this tension. Leaders should first understand the differences between the traditional vertical organization design and the new horizontal network design and then, based on their organizations’ unique strategy and culture, determine what should remain in the hierarchy and what should be built into the network to allow for the agility and speed-to-market necessary to survive now and thrive into the future.
There is no one-size-fits-all model. However, as you embark on this effort, it’s important to consider the following:
- Start with your goals and a high-level identification of where teams may benefit from hierarchy vs. adaptable structures. Remember that often those removed from customers or focused on “behind the curtain” critical support areas tend to function better with more hierarchical and efficient models. Applying traditional design analytics such as spans, layers, and supervisory burden assessments largely still makes sense. Adaptive team-based models tend to work better where people are more on the “edges” of the organization—mission- or outcome-oriented initiatives often aligned to customers.
- Compare your current formal structure to the informal network within your organization. ONA analyses can help you verify and/or identify new groups that should work together or that would benefit from delayering some of the hierarchical structure.
- Identify your ideal state. Don’t get stuck in what’s happening today—or what you think should be happening. Use ONA to understand where your employees see opportunity for cross-functional collaboration and verify that with your original assessment of which teams might benefit from more cross-functional work.
- Diagnose how ready your people are to make this change. Remember that wanting to work more collaboratively doesn’t equate with having all the skills today. Use ONA to understand just how much culture change your organization may need for a successful transition to a new way of working.
- Prepare for continuous change. Organizational design is not a “set it and forget it” discipline. Business needs may demand certain disciplines and team models to change and undergo ongoing modifications to optimize performance.
It bears repeating that this type of change is not for the faint of heart. Organizations must decide how much autonomy, flexibility, and agility is required for their particular strategy. The road map to becoming an adaptable organization is typically a series of small, incremental changes, rather than a big bang. It also generally requires an ongoing process of optimization, without a final destination. However, through ONA, the invisible variables that may have caused challenges in the past can become visible, finally giving leaders the tools they need to guide their organizations more successfully into the future.
The Future of Work
Disruption lies ahead. Driven by accelerating connectivity, new talent models, and cognitive tools, work is changing. As robotics, AI, the gig economy and crowds grow, jobs are being reinvented, creating the “augmented workforce.” We must reconsider how jobs are designed and work to adapt and learn for future growth.
Learn more
Get in touch

- Tiffany McDowell, PhD
- Principal, Organization Strategies leader
- Deloitte Consulting LLP
- tmcdowell@deloitte.com
- +1 619 237 6611
© 2021. See Terms of Use for more information.


-
 Are you having fun yet? Article6 years ago
 -
 You snooze, you win Article6 years ago
 -

-