Can evolving energy technologies help reduce the sector’s impact on water stress?
Deloitte’s analysis shows how the energy transition could affect water stress and which energy technologies are likely to have the lowest water intensity.
Water is a critical input along the entire energy value chain. It’s used in fossil fuel extraction, fuel processing, agricultural irrigation (for biofuels), hydrogen production, power generation, and transport fuels. In the future, new sources of energy production could change that water footprint, either exacerbating or reducing water stress,1 which occurs when the demand for water exceeds the available supply. As the net-zero energy transition progresses, the energy industry should increasingly focus on the water intensity of current and new energy technologies.
To demonstrate the relationship between the energy transition and regional water stress, to identify opportunities for mitigation, and to assess the environmental impact of those options, Deloitte has analyzed several independent studies that estimate the water intensity of various energy technologies and processes across North America. Although the water-energy-food-ecosystem nexus and its multiple trade-offs are often widely discussed on a global level, the Deloitte analysis focuses on the consumption and withdrawals of freshwater from a few technologies in the power and transportation sectors. However, it is acknowledged that other water sources could be utilized in certain applications (for example, grey and green water) and energy technologies are expected to continue evolving.
Higher temperatures and water stress are a concern for the power sector
The electric power sector alone accounts for roughly 40% of total water withdrawals in the United States, according to the United States Geological Survey.2 This is largely due to thermal power plants’ reliance on water for their cooling systems.3 Higher atmospheric temperatures can result in drawing warmer water for cooling, which can reduce the efficiency of the thermal power plant, leading to higher water withdrawals to generate the same amount of electricity. In some circumstances, thermal power plants may have to reduce output because environmental regulations limit how much hot water power plants can discharge in order to protect aquatic life.
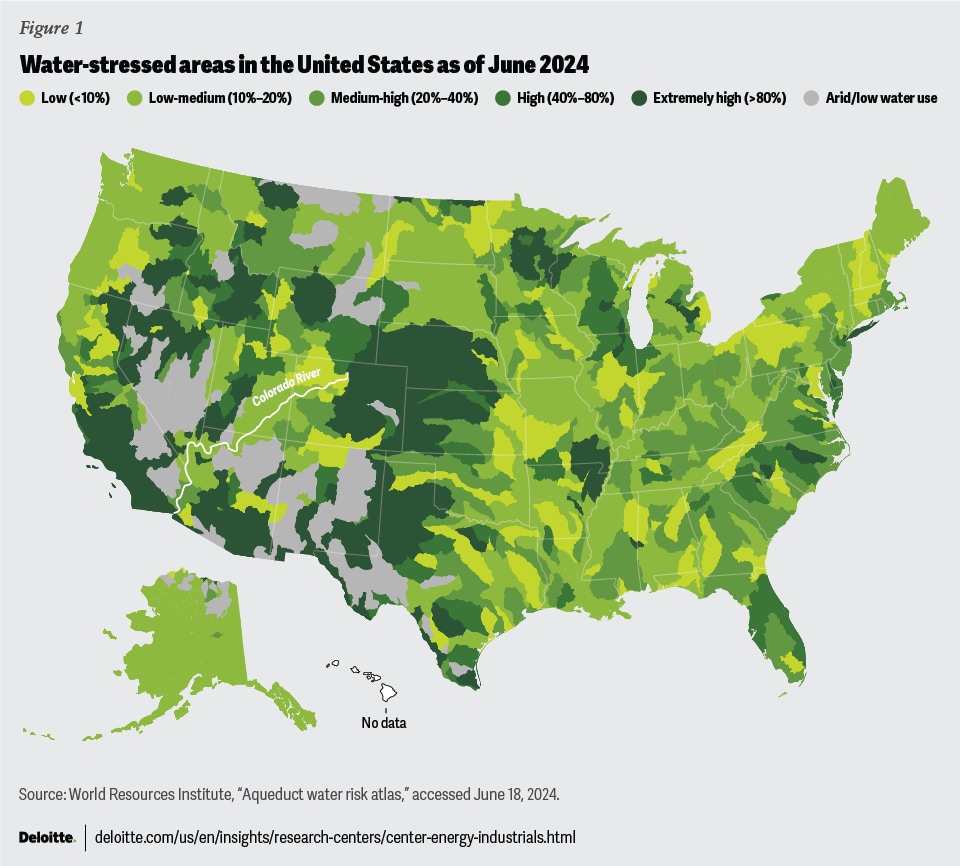
Prolonged drought conditions can reduce hydroelectric output, decrease thermal plant efficiency and output, raise carbon emissions, and potentially lead to plant shutdowns.4 And droughts are not rare: According to the National Centers for Environmental Information, drought touched every US state at some point in 2022 and more than 46% of the contiguous United States at the start of 2023.5 The drought in the Colorado River Basin, for example, poses a threat to the 40 million people who rely on it for drinking water.6 In fact, according to sources at the World Resources Institute, if the Basin was itself a country, it would rank among the most water-stressed in the world (figure 1).7
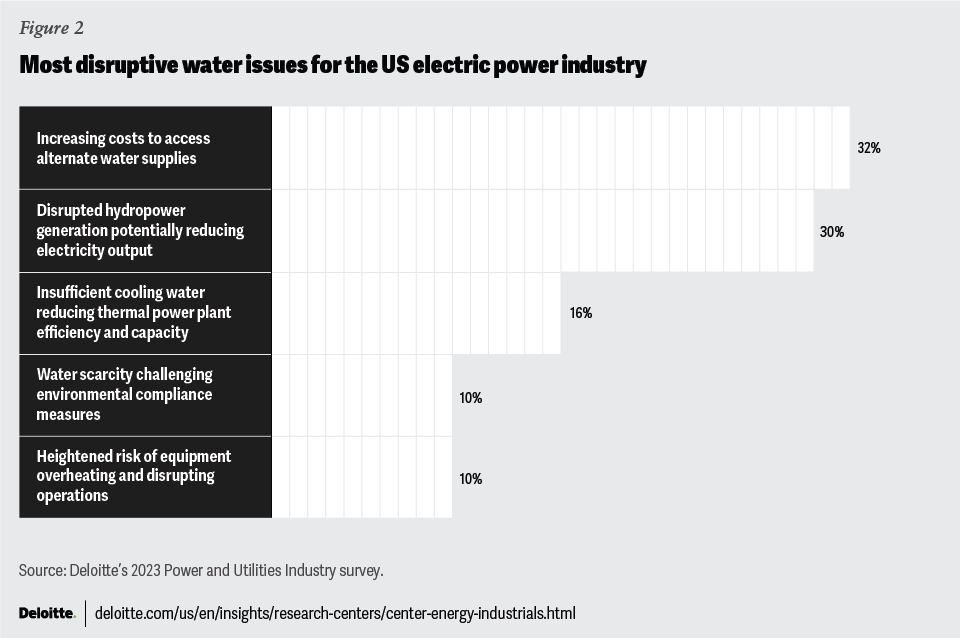
As temperatures continue to rise, electricity demand for cooling is expected to grow globally. In the United States, the projected increase in power demand from data centers, the reshoring of industry, and increased electrification could create more strain on the system.8 At the same time, water stress is expected to worsen over time (without significant interventions). According to a 2022 Deloitte survey of around 70 executives and senior leaders in the US power and utilities industry, respondents listed the increasing cost to access alternative water supplies and disrupted hydropower generation as the most disruptive water issues for their companies (figure 2).9
As the energy transition progresses, water use for power generation is falling
From 2015 to 2022, the power sector’s water intensity (water withdrawals as a percentage of total electricity generated) fell more than 24% from 15,148 gallons/megawatt-hours to 11,472 gallons/megawatt-hours, as coal-fired generation was replaced by solar, wind, and natural gas.10
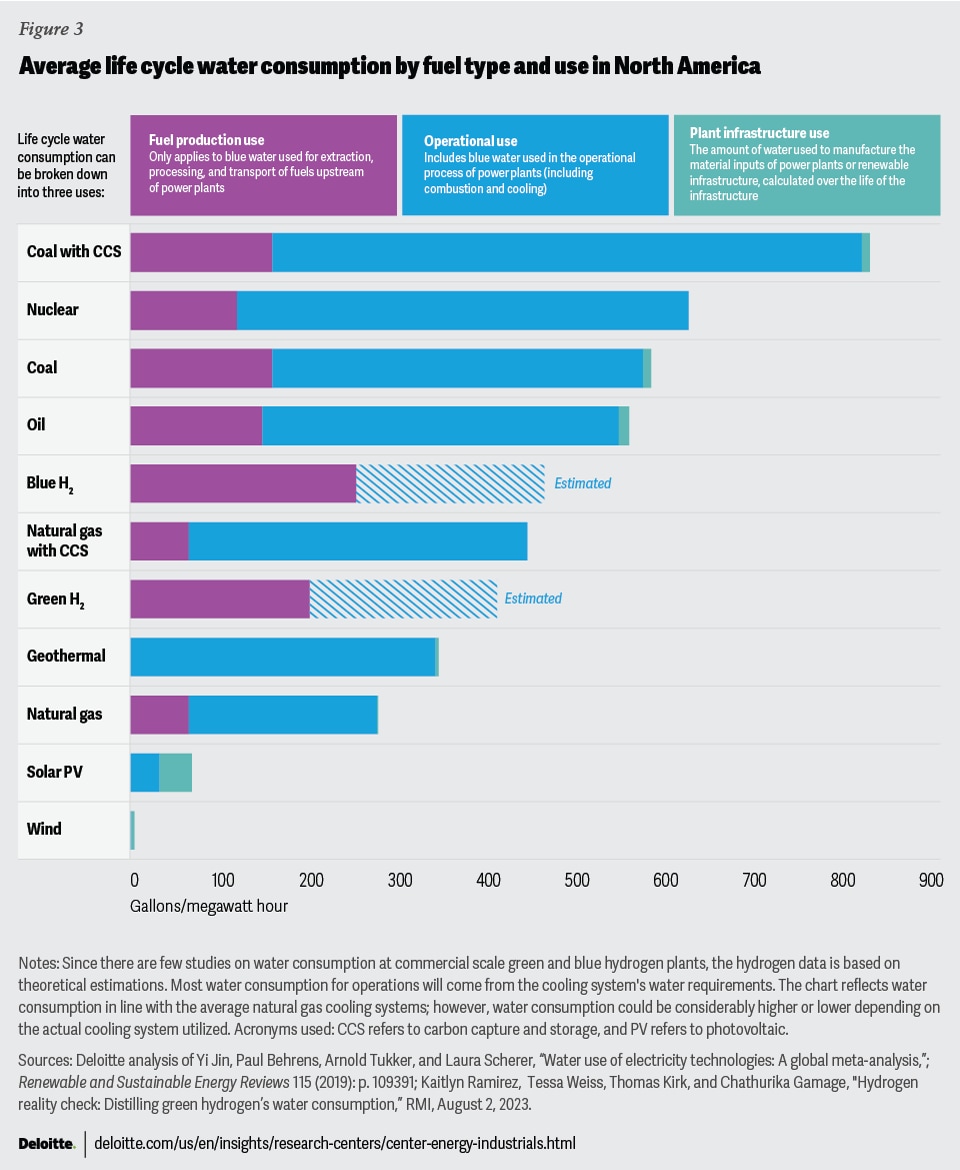
According to Deloitte’s analysis of data published by researchers from Leiden University, the average life cycle water consumption11 of wind and solar is less water-intensive than that of many fossil fuel generation technologies (figure 3).12 This is largely because thermal power plants use large amounts of water in their cooling systems, while wind and solar do not.
Deloitte expects the sector’s water intensity to continue declining in the short term, as US operators plan to retire more than 40 gigawatts of coal-fired capacity and add more than 30 gigawatts of wind and 90 gigawatts of solar over the next seven years.13 The displacement of coal by wind and solar, and consequently the reduced water withdrawals, will vary by region, however.
Of the fossil fuel-fired power plants, natural gas-fired plants use the least water on average. This is for two main reasons. First, less water is used in fuel production because natural gas extraction and processing are less water-intensive relative to oil and coal.14 Second, less water is used in plant operations because more than half of the US fleet of natural gas-fired power plants employ combined cycle technology, which is more energy-efficient and enables the plants to generate more electricity per unit of water used.15
In contrast, using carbon capture and storage (CCS) on fossil fuel generators could increase water consumption at those plants since all current CCS technologies require some water usage. There are currently plans to build 28 such CCS plants in North America.16 A rise in the use of CCS on fossil fuel generators could slow the trend in reducing water withdrawals from the power sector.
Electric and hydrogen vehicles could also help reduce future water consumption in the transportation sector
Today’s petroleum-based transportation fuels have a water footprint on par with or even less than lower-emissions alternatives.17 But in the future, less water-intensive forms of electricity, such as wind and solar, could result in lower water consumption for electric vehicles and fuel cell vehicles, if the latter uses electrolysis for production. This is because electric vehicles depend on electricity for fuel and fuel cell vehicles depend on electricity for electrolysis (green hydrogen production).18
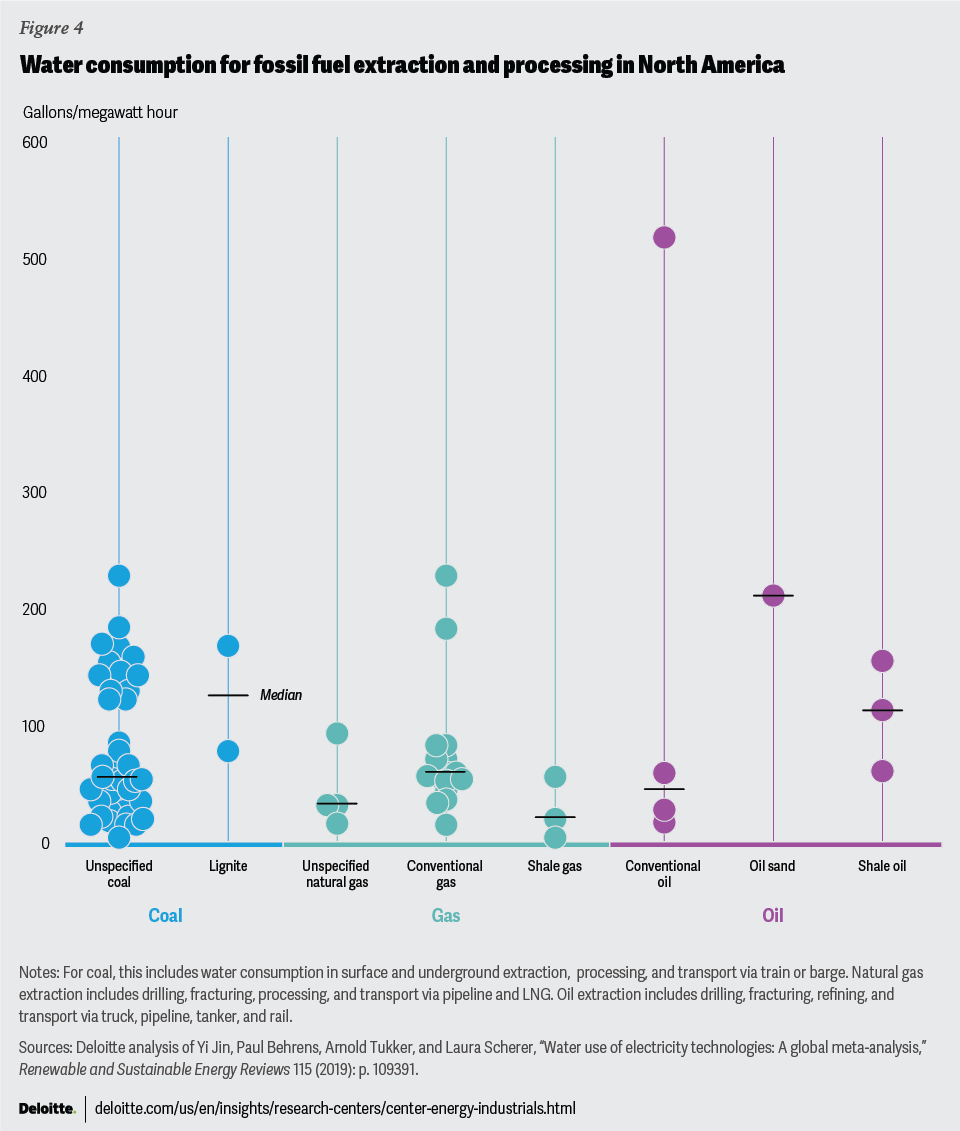
Water consumption for oil production varies greatly based on geography and the use of enhanced oil recovery (see Figure 4).19 Because more than 60% of US oil production is located in the water-stressed western United States,20 many producers are beginning to reuse or recycle produced water from their oil and gas extraction activities.21 For context, the United States Geological Survey estimates that hydraulically fracturing a single well, a technique that involves injecting fluids into a well to stimulate the flow of natural gas or oil, can use between 1.5 million and 16 million gallons of water.22 A study conducted in Texas last year states that about 54% of water used in fracturing is currently sourced from produced (reused) water.23 Continued increases in the reuse or recycling of produced water in oil and gas operations could significantly reduce freshwater consumption in oil and gas extraction.
Conversely, the use of biofuels could increase water consumption for transportation fuels, though this may be dependent on factors such as crop type and irrigation requirements. According to Deloitte analysis of data published by researchers from the University of Texas at Austin, in some cases biofuels could increase water consumption by up to 50 times on a gallon per mile basis.24 However, water usage could be reduced with improvements in fuel economy, crop yield, or irrigation.
Even if petroleum-based transport fuels do become less common in the United States, oil and gas extraction could continue to serve the export market. As a result, even if water consumption declines in the US transportation sector, total water consumption for oil and gas extraction could still rise.
Wind and solar are expected to reduce greenhouse gas emissions and water consumption, but that’s not necessarily true for all low-carbon technologies
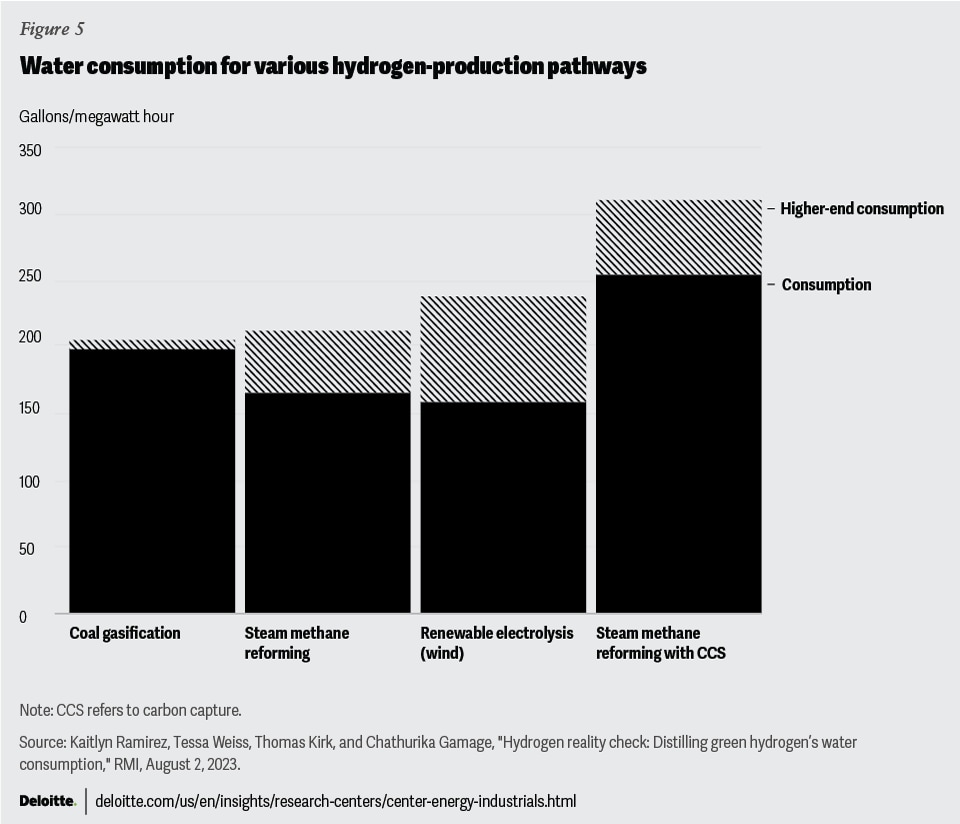
Hydrogen has a key role to play in decarbonizing hard-to-abate industries and providing energy storage for the power sector. Today, both green and blue hydrogen production are expected to require more water for fuel production than fossil fuels.25 Some considerations that could change the water requirements for hydrogen production include the hydrogen production method, water quality, water treatment method, climatic conditions, cooling method, and any carrier conversion process that might be needed to transport the hydrogen.
Current studies indicate that gray hydrogen (produced from coal gasification or natural gas using a steam methane reforming process) and green hydrogen (produced from renewable energy using electrolysis) have the lowest water footprint among hydrogen technologies (figure 5).26 This is mainly because the increase in water consumption from natural gas extraction and processing is offset by electrolysis, which is relatively energy-inefficient. However, the carbon footprint of steam methane reforming production without CCS is significantly higher relative to electrolysis using renewable energy.27
That said, many clean energy technologies are still in their infancy, and their water requirements may change as they scale and mature.
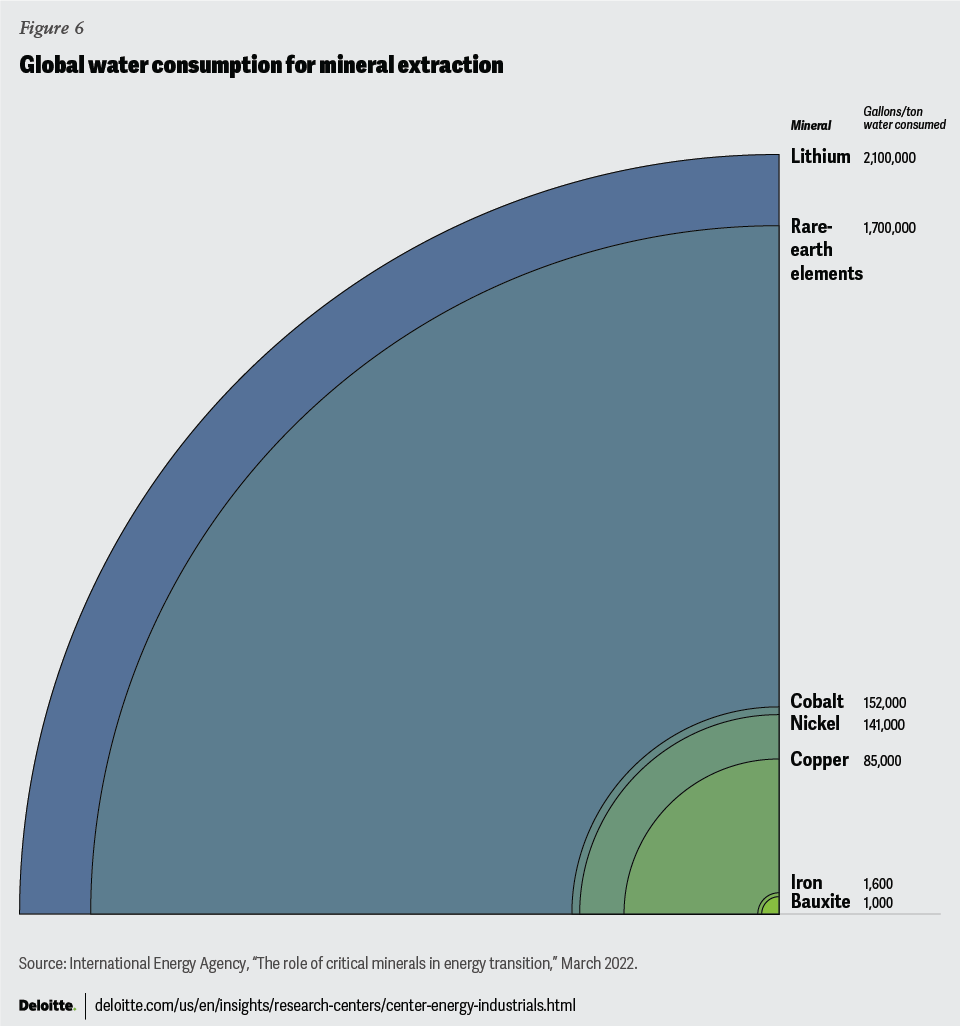
The growing use of battery storage for power and transportation could also impact water-stressed areas. The International Energy Agency estimates that battery usage in the energy sector quadrupled between 2020 and 2023 and will need to increase sixfold by 2030 to meet net-zero targets by 2050.28 Water is consumed across the battery supply chain, from mining raw materials to manufacturing to cooling and cleaning processes during operation. The extraction of lithium, cobalt, and nickel, which are key inputs in battery production, is water-intensive (figure 6 ).29 But like in oil and gas extraction, some mining companies are attempting to boost freshwater recycling. For instance, several companies using direct lithium extraction report that they are recovering more than 90% of their freshwater, with goals to increase this percentage.30 Others are investing in large desalination projects to reduce their dependence on local freshwater.31 Although some desalination technologies are energy-intensive with their own environmental impacts, these technologies are also evolving to reduce energy requirements and negative environmental impacts.32
Significant amounts of water can be used in battery manufacturing plants to prepare reactive materials and electrolytes, deposit reactive materials on electrode structures, charge electrodes, remove impurities, and wash finished cells and equipment.33 Here too, some manufacturing companies are investing in water treatment plants to recycle wastewater and reduce their freshwater needs.34
Nevertheless, if steps aren’t taken to help reduce these impacts, the increase in battery storage could raise water demand and impact certain regions or localities.
Water stress is expected to continue to be a risk regardless of the energy source
Some companies, utilities, and local governments are already considering their projects’ impacts on the local environment and the local environment’s impact on the long-term efficacy of their projects. This impact is often measured in terms of carbon emissions, but the impact on water intensity should be increasingly considered.
From a stewardship perspective, planning should take into account existing regional water stress when siting water-intensive energy technologies, which could compete with agriculture and drinking water requirements. From a project perspective, local water stress and the water intensity of the project technology should be considered to protect against future exposure to rising water costs, operational risks, supply chain risks, and evolving policy or regulatory risks. As climate change intensifies, these risks are likely to grow, putting this issue at the forefront of the industry’s conversations about how to transition to a sustainable future.
To access more in-depth research and analysis that supports this report, please contact Ashlee Christian at aschristian@deloitte.com.


