A new metric for tracking US communications infrastructure
Introducing the Deloitte communications infrastructure index, a new metric to track progress and innovation in the telecommunications industry
Dan Littmann
Jack Fritz
Jeff Loucks
Duncan Stewart
Tim Krause
Carleigh Joiner
US and global communications infrastructure providers have a century-plus track record of innovating and scaling to meet evolving connectivity demands, most recently due to restrictions during the COVID-19 pandemic. To provide a picture of the industry’s progress, as well as its ability to adapt to future shifts, Deloitte’s US Telecom practice, in conjunction with the Deloitte Center for Technology, Media & Telecommunications, has developed the communications infrastructure index. With 20 key indicators synthesized into a single, easy-to-understand measure, this composite index can serve as a benchmark for evaluating the US telecommunications industry’s growth and resilience.
For the inaugural edition of the index, we analyzed historical data going back to 2019 to establish a baseline (defined as 100). Inputs include measures of wireless speeds, customer satisfaction, broadband and wireless reliability, and jobs in the telecom sector, among other indicators (see methodology).
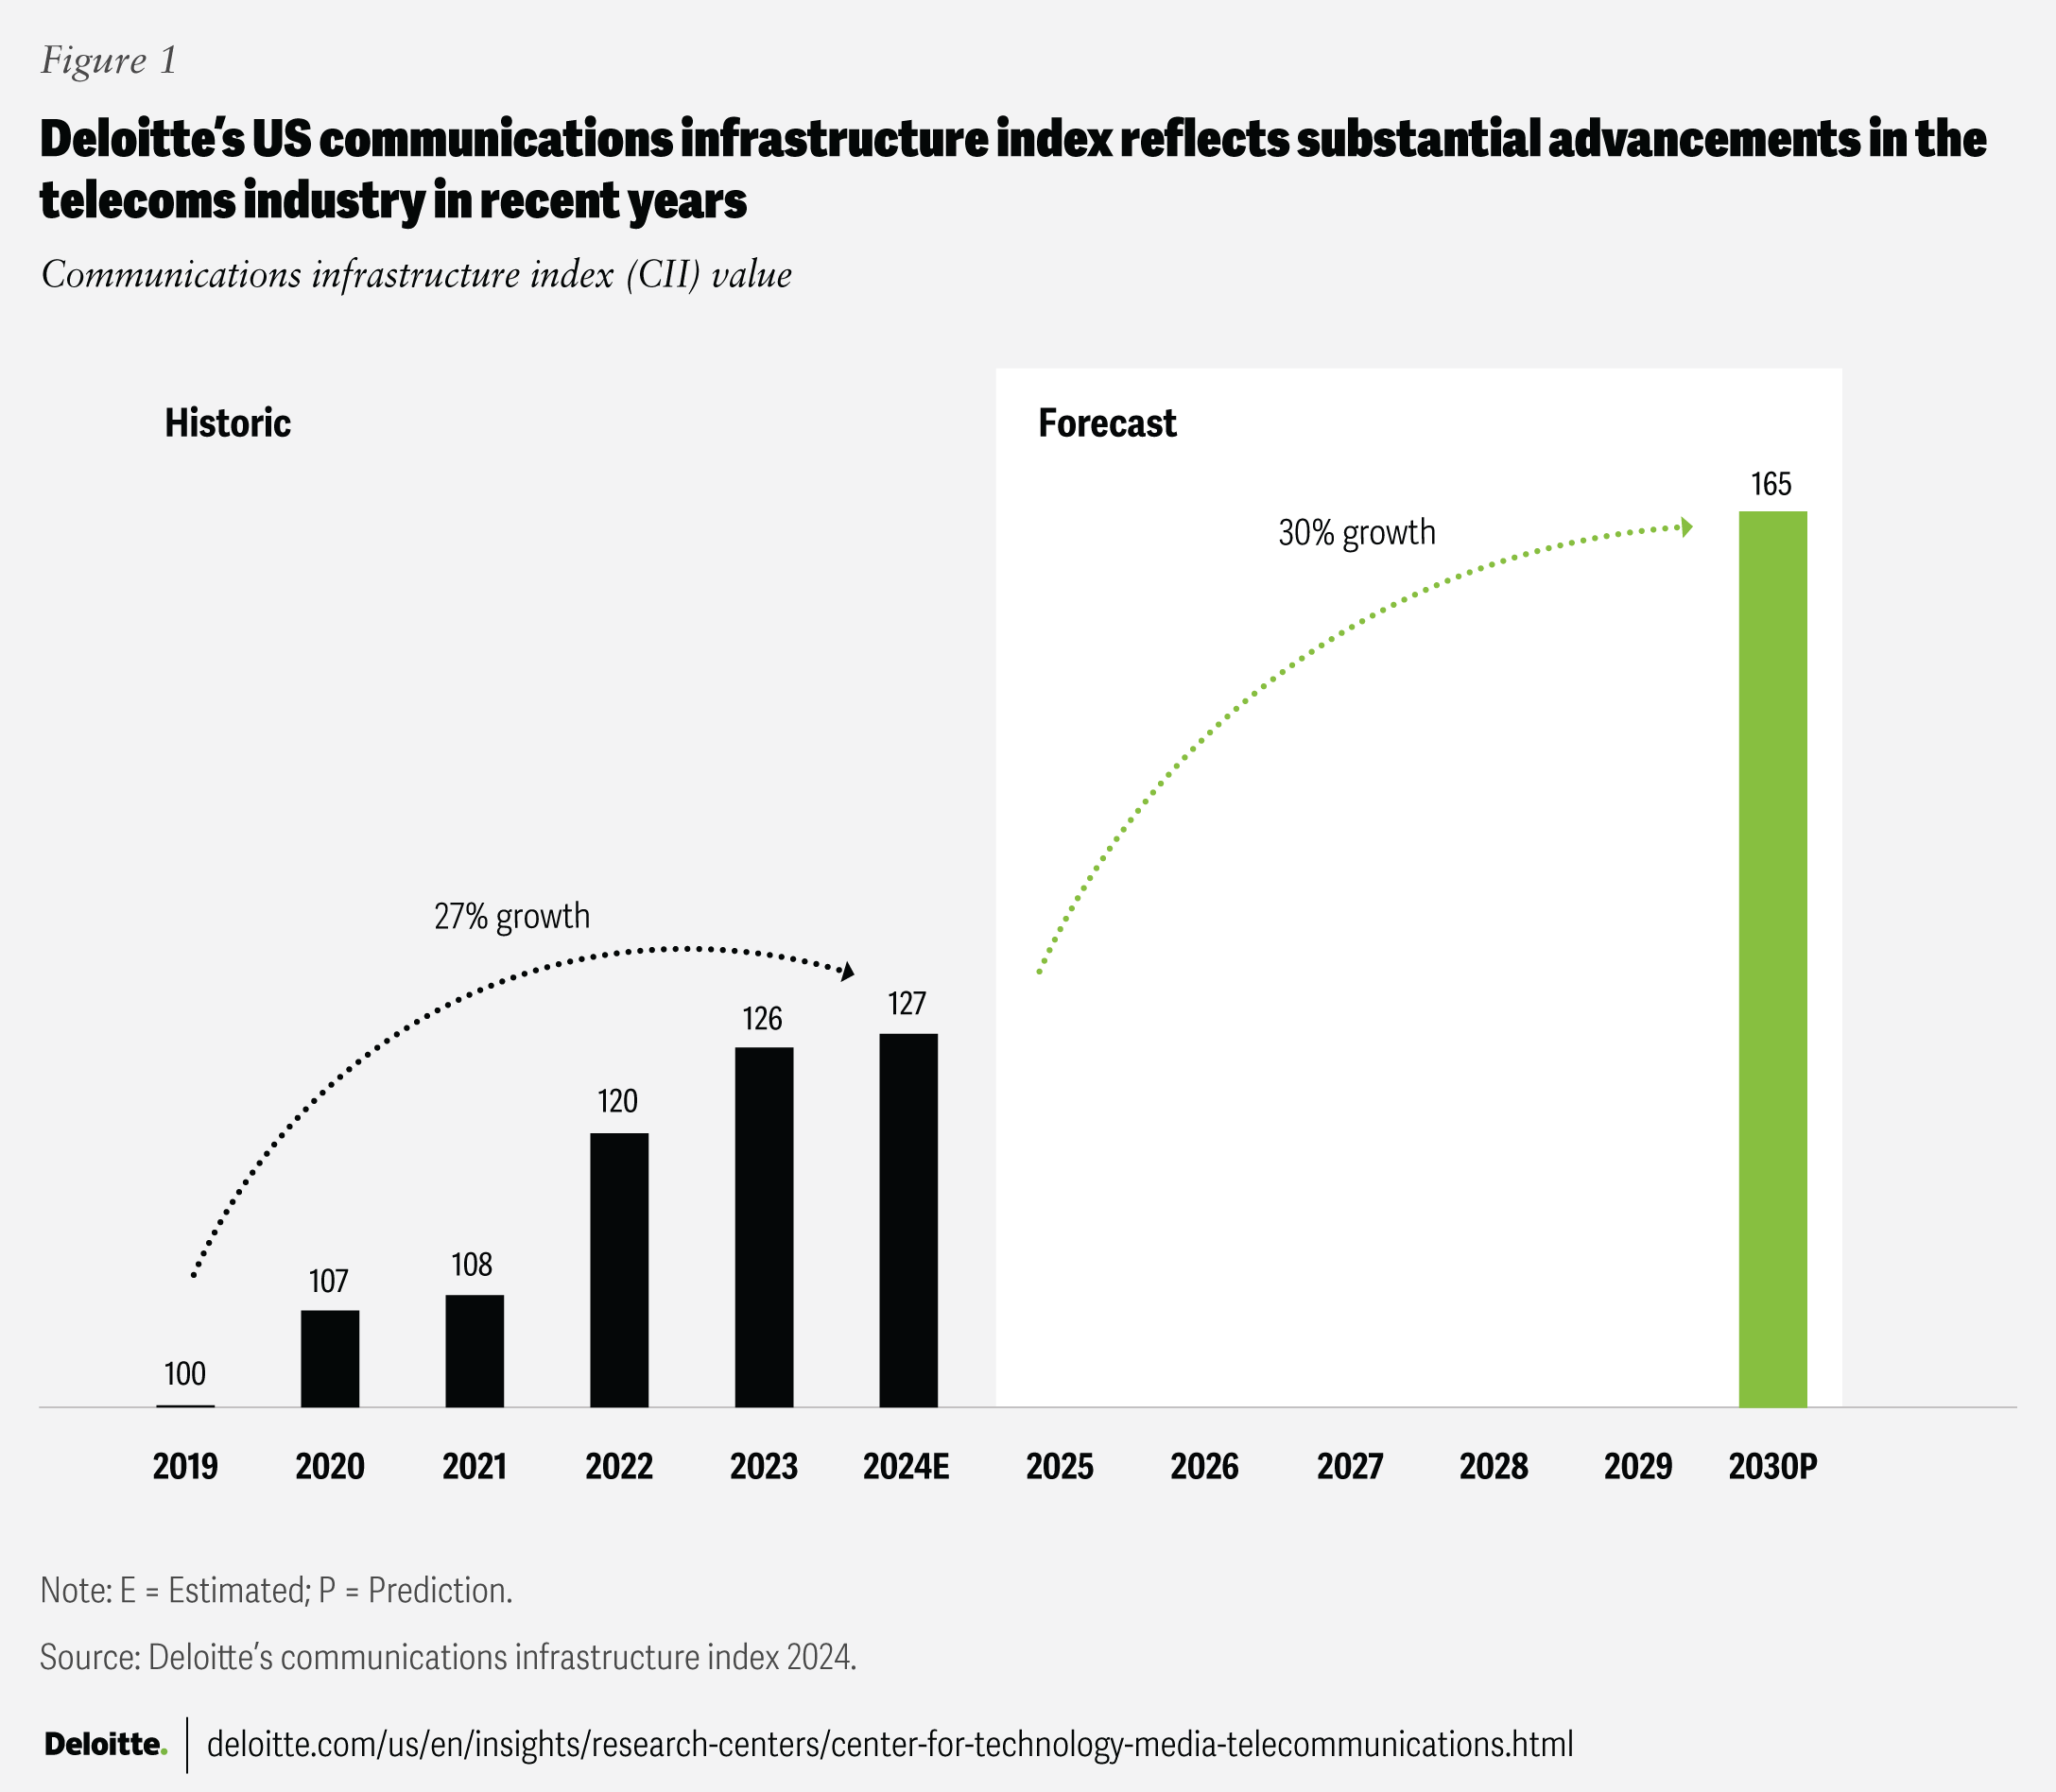
Overall, the communications infrastructure index (CII) has grown an estimated 27% from 2019 to 2024, indicating substantial advancements in US telecoms infrastructure and connectivity over the last few years.
We also extended our analysis into the future. For the United States to keep pace with other leading countries and their telecom infrastructures, we estimate the CII would need to grow another 30% from 127 in 2024 to 165 by 2030 (figure 1). Achieving this target would likely require additional actions on the part of network operators, their technology suppliers, and the government. Without additional capital expenditures and access to new wireless spectrum, however, the CII could stagnate, indicating inadequate communications infrastructure in the United States.
Communications infrastructure is often an unsung hero of the digital age. It’s as old as transportation infrastructure like roads, bridges, canals, or railroads, but unlike those, it requires continuous high levels of investment to stay cutting-edge. When it comes to capturing the public imagination, it may lack the novelty or technological pizzazz of advanced node semiconductor plants or generative AI data centers. It occupies a kind of reverse Goldilocks zone: not new enough and not old enough at the same time. Yet, it’s the critical technology that connects all those chips and AI models to consumers, to enterprises, and to each other. Telecom infrastructure only makes the front pages when it doesn’t work as it should. But it remains the foundation on which everything digital rests and enables future economic growth.
As a tool, the strength of the index lies in its dual utility: As a single metric, it presents a clear measure of overall progress, while also allowing for detailed analysis of underlying trends. For example, by digging into the individual inputs, we can identify many recent advancements (download speeds have nearly doubled and 5G coverage has expanded significantly since 2019), as well as challenges. By curating all this data, the index can facilitate both high-level assessments and a deeper exploration of the dynamic nature of the industry.
Confirming communications infrastructure can support a connected future
The resilience and advancement of communications infrastructure to support connected services is increasingly critical both in the United States and globally. Faced with unforeseen increases in demand and a radically changed traffic profile during the pandemic, communications infrastructure providers worldwide were presented with a unique challenge to maintain network stability while responding to extreme shifts in usage patterns. In the United States, carriers were already working on 5G upgrades and fiber expansions, but they also responded by accelerating investment in real time in response to demand.
In 2025 and beyond, the stakes may be even higher if AI use cases and solutions create more demand for communications infrastructure capacity and performance. The likely shift from centralized computing power for large language models to highly distributed generative AI processes may have a dramatic effect on network traffic patterns.1 Delivering the required performance for these dynamic workloads while maintaining stability for legacy services would likely be a factor in the ability of the United States to maintain global technology leadership. Studies have shown that a robust and improving communications infrastructure is positively correlated with economic growth, innovation, and a narrowing of digital divides (urban vs. rural populations, higher vs. lower income, more vs. less education, etc.).2
Deloitte’s analysis of financial filings from large communications providers estimates that operators in the United States have invested more than $70 billion per year over the past five years into network capital improvement.3 Meanwhile, private equity firms are placing big bets on fiber infrastructure builders,4 and the US government is becoming a more active investor in getting citizens connected through programs like the Rural Digital Opportunity Fund and the Broadband, Equity, Access and Deployment (BEAD) fund5, although the new administration may change or revise the implementation of those programs. Yet, no widely accepted metric exists to help governments and network owners gauge industry progress in advancing US communications infrastructure.
The communications infrastructure index can serve as an industry measure of the advancement or decline of US communications infrastructure and its ability to accelerate economic growth and advance social and public interests. The CII measures not only things like coverage and speeds, but also affordability, wireless spectrum, spending, and much more.
Digging into the details: Communications infrastructure advancements and challenges
According to Deloitte’s analysis of company financial filings, US communications infrastructure providers invested approximately $400 billion of capital between 2019 to 2023, driving the index upward. This investment helped spur improved wireless speeds and capacity as well as a 21% growth in the number of homes passed with at least 100 Mbps downstream and 20 Mbps upstream service (the US government’s current definition for broadband service). Government investment also contributes to the index and has had a direct impact on expanding access to broadband. Although commercial investment is historically five to seven times larger than government investment, government funding may be amplified by motivating private sector companies to accelerate the expansion of broadband to more homes in more markets.6 Nonetheless, while 5% of US households don’t yet have access to 100/20 broadband service, BEAD program funding may help close that gap.7
Bandwidth consumption expanded 40% during the first year of the pandemic (2020) as more people stayed home for work and school.8 While this expansion marked the highest annual growth rate in 10 years, customer satisfaction remained consistent or increased, indicating that operators reacted to meet the demand spike.9
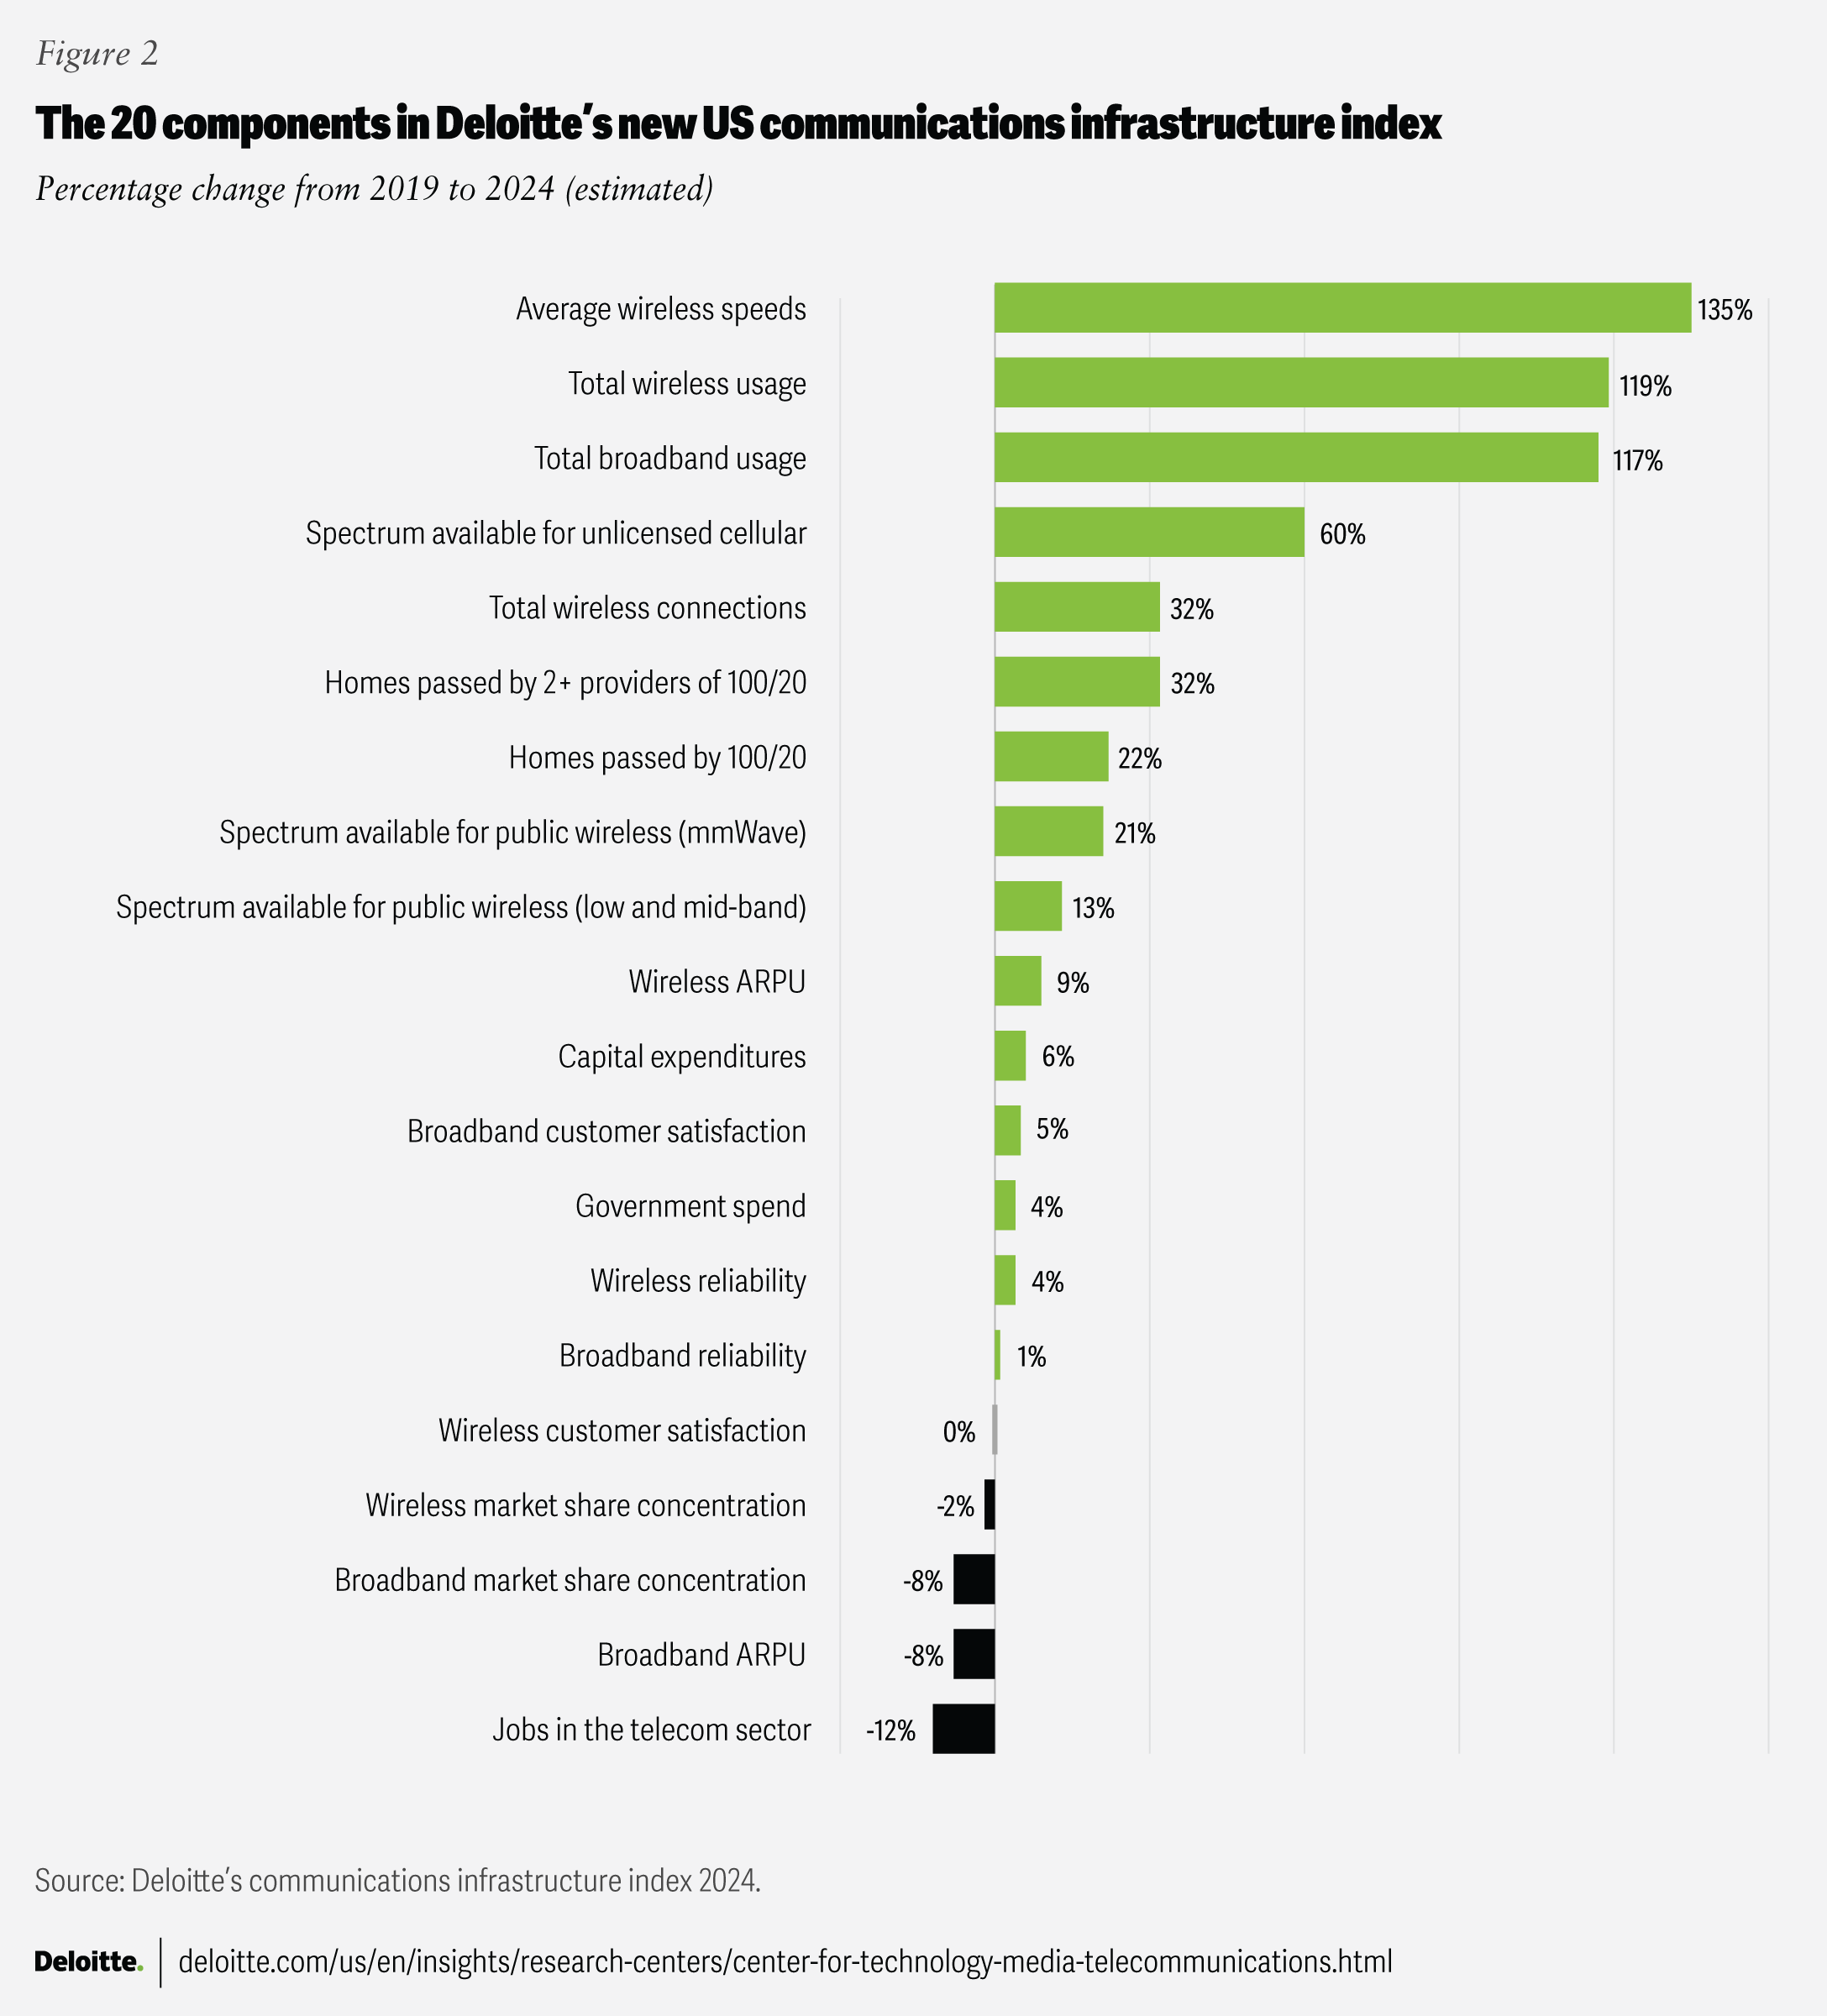
Average wireless download speeds have nearly doubled from 2021 to 2023, reaching an average of 80 Mbps in 202310 (figure 2). The number of US wireless connections grew 12% from 2021 to 2023. Upgrades to 5G technology have delivered increased speeds;11 however, the modest connection growth could indicate that the promise of millions or even billions of connected Internet of Things devices (as opposed to consumers) made possible by cellular technology has not come to fruition. Enterprises may be unconvinced about the value of these use cases or may instead be using Wi-Fi as the connectivity technology for most IoT devices.
Competitive metrics in the broadband market have had a net positive impact on the CII. The number of households that receive 100/20 service from two or more providers, not including satellite-based options, is an important factor in measuring competition. Compared to 2019, approximately 17 million more households in 2023 had access to two or more providers.12 However, demographics differ greatly for households that receive 100/20 internet service from two or more service providers versus those who have access to only one or none (see Demographics and the broadband divide).
Demographics and the broadband divide
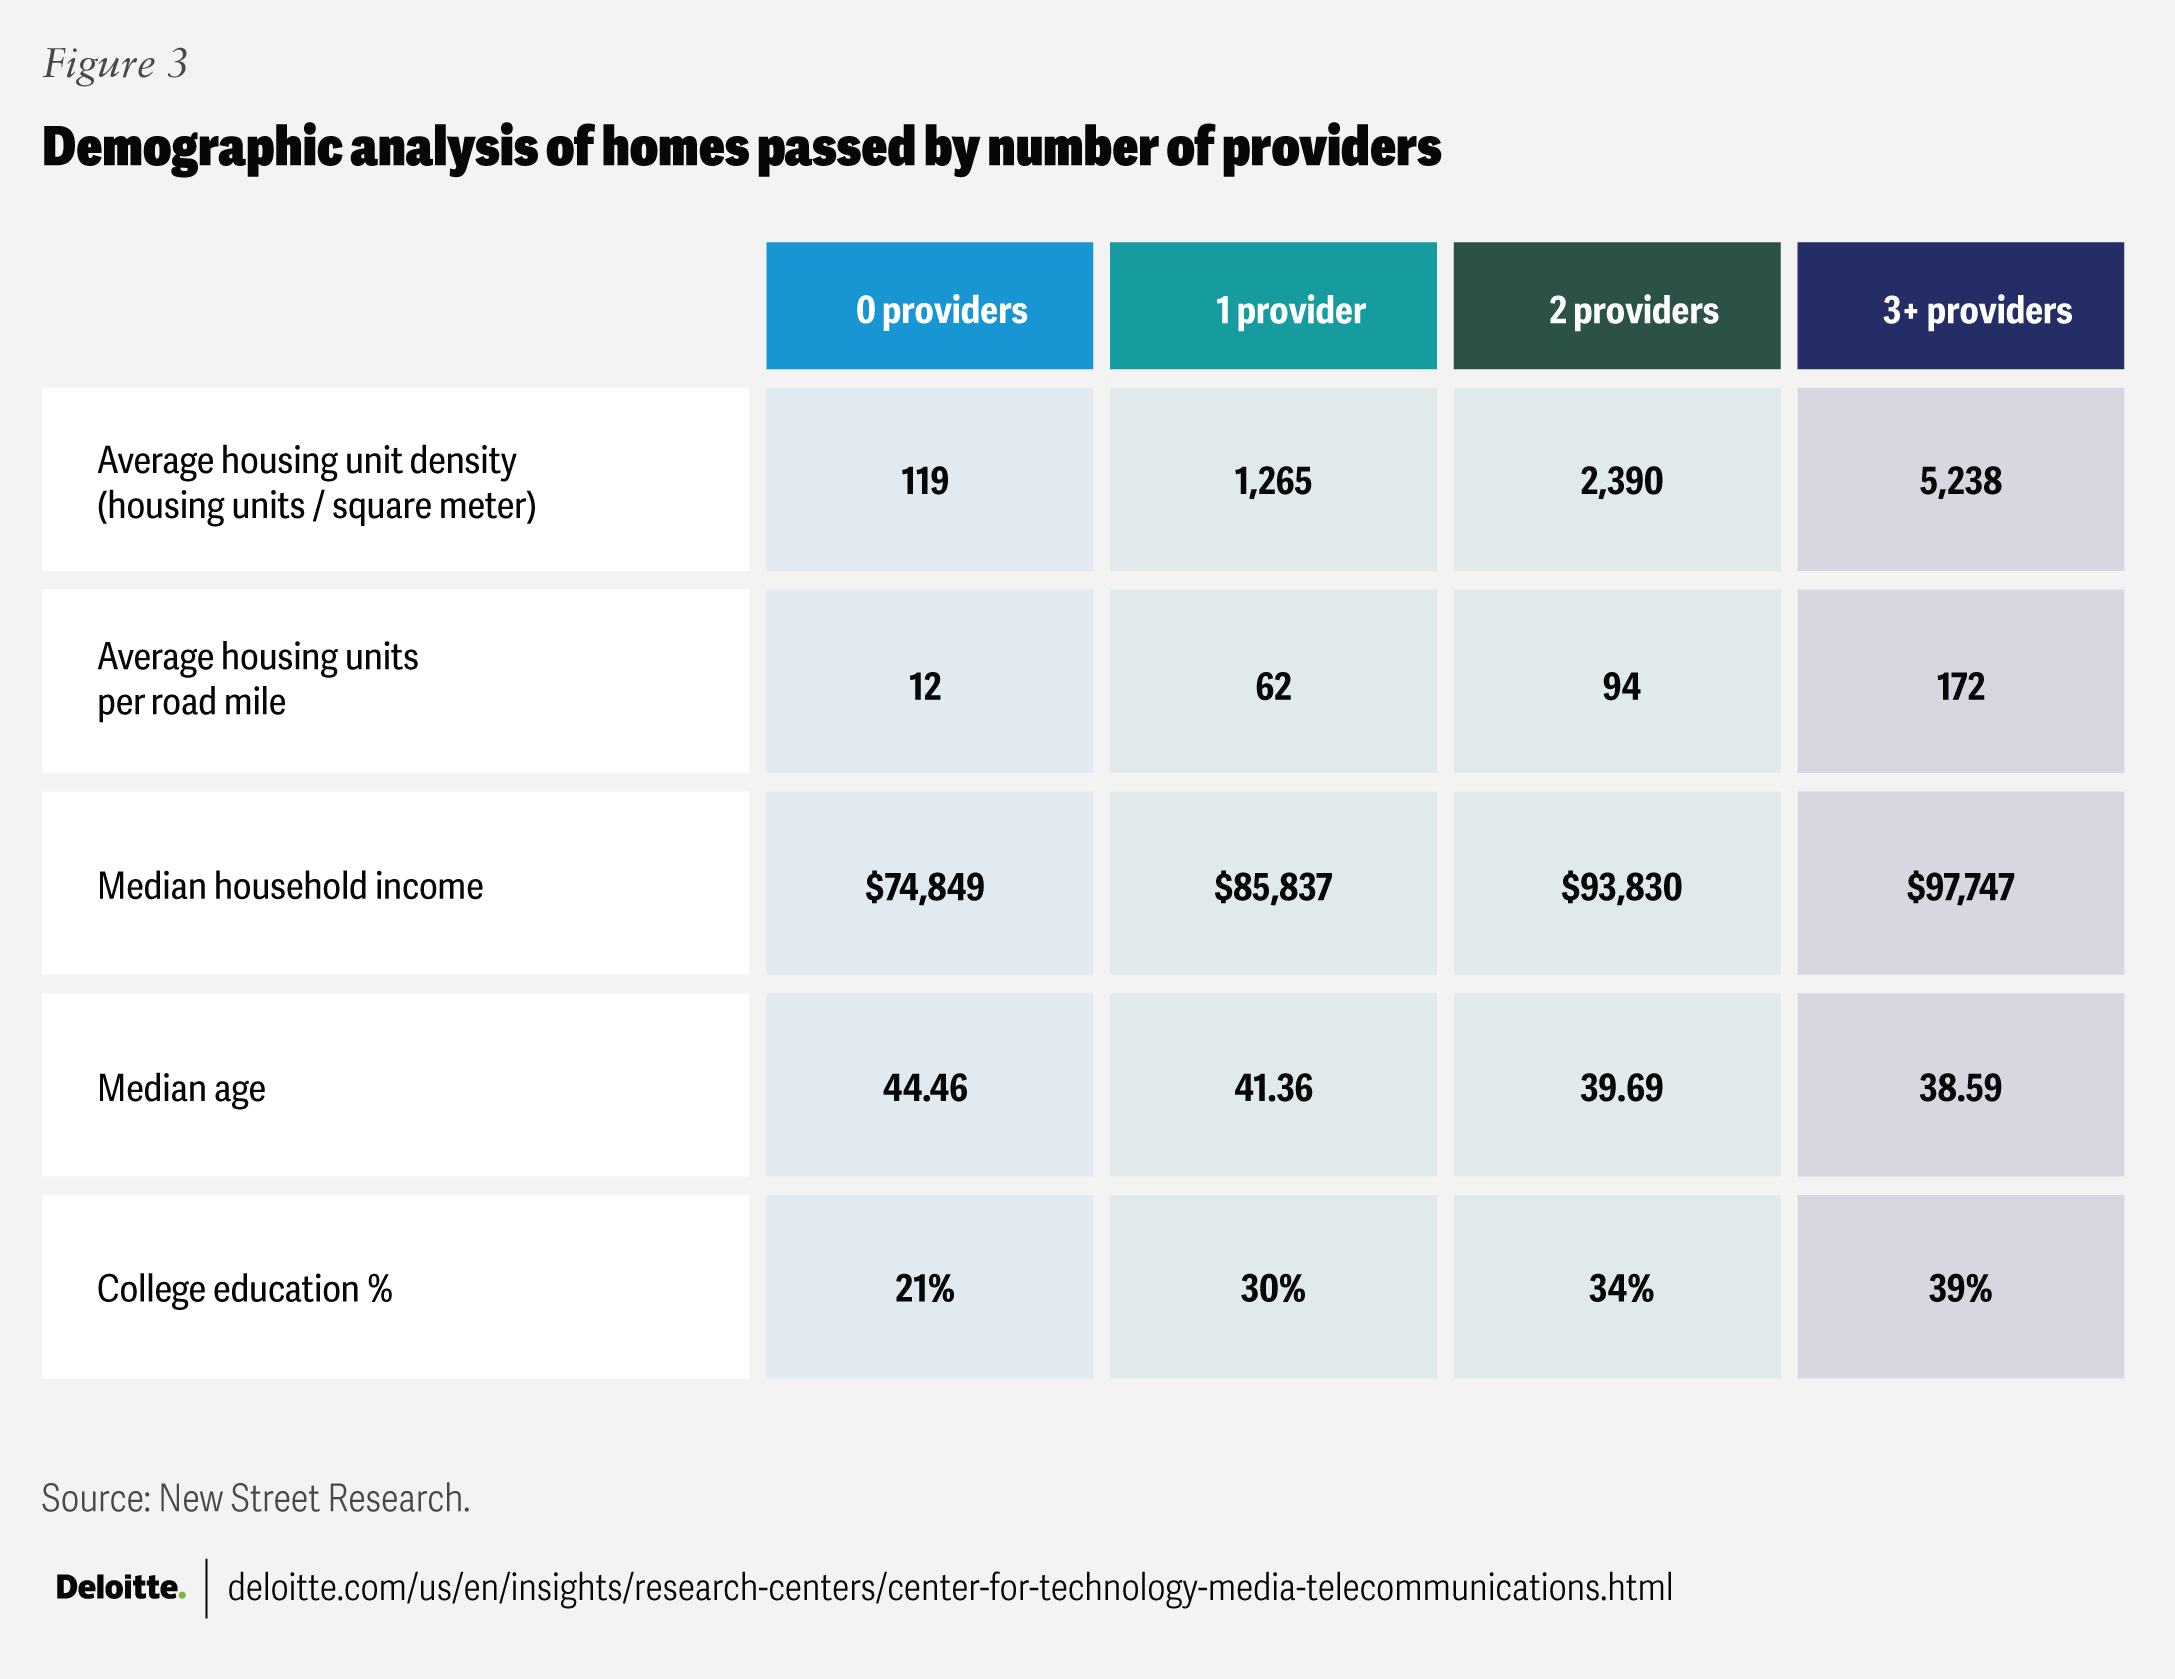
Deloitte collected certain metrics at the census tract level, allowing for a more geographically granular assessment of broadband coverage and competition. For example, areas with less competition in general are often less densely populated, with lower income, older, and less educated residents on average than areas with higher competition. This may be unsurprising, but showcases the ability to assess progress, or lack of progress, for US communications infrastructure below the national level.
Specifically, Deloitte compared the household demographics of four categories of broadband competitive intensity, including:
- Households with zero providers capable of delivering 100/20 broadband
- Households with one provider capable of delivering 100/20 broadband
- Households with two providers capable of delivering 100/20 broadband
- Households with three or more providers capable of delivering 100/20 broadband
We examined the number of households in each of these categories and compared them along demographic factors, including density metrics, median household income, median age, and college education percentage (figure 3).
The numbers appear to confirm the premise of programs which are meant to help communications services providers create a viable business case for broadband upgrades in geographies where affordability or physical distance and low population density could weaken return on investment (ROI). The CII will continue to track coverage and competitive intensity measures in future years. It will also continue to track the impact of satellite broadband offerings that reach all population segments.
Moreover, the successful introduction of cellular fixed wireless access as an alternative solution has had a positive impact in availability, price, and choice for consumers according to the index. Market share of the largest broadband service providers has declined during the past five years.13 Accordingly, average revenue per user (ARPU) for broadband, adjusted for inflation, has declined by 8% as competitive intensity increases.14 Customer satisfaction during this same period has held relatively steady.
A similar, but less extreme, dynamic is apparent in wireless competitive metrics. Competition has increased slightly as mobile virtual network operators (MVNO) not owned by the largest wireless providers gain share, showcasing a highly competitive wireless market. Inflation adjusted ARPU for wireless service remains relatively steady, although does not show the declines apparent in broadband.
The availability of wireless spectrum, especially licensed public spectrum in the more desirable low- and mid-band frequencies, underpins improvement in many other wireless metrics. Wireless reliability, for example, could be improved substantially if new spectrum allows increased capacity in dense urban markets or increased coverage in rural or other underserved geographies. A lack of spectrum auctions over the last two years held this key metric back in the reporting period and may limit the ability of operators to deliver the capacity, speed, and reliability required for future growth.15 Unlicensed spectrum and mmWave are components of the index but have remained stagnant over much of the study period. Propagation limitations associated with mmWave have led to limited deployment and adoption in both public networks and private cellular settings.16
As can be seen in figure 2, both wireline and wireless reliability are up slightly since 2019.17 We believe wireless reliability could grow even further with the release of additional spectrum: Spectrum acts as a multiplier, and would likely increase other metrics, such as reliability and satisfaction. The drop in customer satisfaction in figure 2 of 1% compared to 2019 is not material: further, late breaking 2024 data shows satisfaction rising to 76%, which is higher than 2019, although not shown in figure 2.18
Another metric impacting the CII is job growth. The telecom sector has lost more than 70,000 jobs on a base of 718,000 in the United States in a consistent decline from 2019 through 2023, as network owners implemented cloud-based architectures and further automated operations.19 Although declining employment might be seen as a negative by some, being able to grow revenues with fewer workers allows the sector to operate with lower costs, freeing up money for future network investment, As more employment shifts away from communications infrastructure providers to newer network owners such as hyperscalers and other very large private enterprises, this downward trend is expected to continue.
Looking ahead at 2025 and beyond
Overall, subscribers have benefited from both private and government investment in US communications infrastructure. Even in the face of radical changes in consumption patterns brought on by the pandemic, streaming, and potentially AI, citizens who have access and can afford connectivity have enjoyed stable prices, consistently reliable connections, and access to the content and services they need. The CII increased by 26% from 2019 to 2023, indicating a robust and improving US communications infrastructure. However, with no new wireless spectrum and no generational technology upgrades such as 6G under way in either wireless or broadband connectivity, the index is expected to remain nearly flat in the full year 2024, which is why we estimated the index most recently stands at 127. In fact, several of the primary drivers of past CII growth had leveled off in early 2024, including customer satisfaction, market share concentration, and capital investment.
Collectively, capital investment by carriers is decreasing relative to revenues and depreciation. This suggests that net assets for the industry are either holding steady or may be at risk of decreasing in the future. While such trends may be rewarded in the short term by capital markets looking for lower capital intensity, the long-term trend is potentially worrisome given that it implies that carriers may lack the return on invested capital incentive to justify further investment to modernize and expand their networks.
Rates of annual traffic increase at the household level are showing signs of slowing.20 While we don’t see this in our current index study period, Ericsson’s 2024 mobility report projects a slower increase in traffic growth to 16% annually in the period from 2025 to 2030.21 The CII indicates that carriers have invested the capital necessary to provide capacity for exponential traffic growth. Reliability could be a point of emphasis for future gains in the index. As annual increases in bandwidth requirements grow less quickly than in the past and people use their network connections for more daily activities (like TV, social media, education, and work) reliability may become more important than bandwidth when it comes to measuring the state of our communications infrastructure—and we expect it to be a differentiator for operators.
The CII seems to have benefited from an increase in competitive intensity across both broadband and wireless. Cable has been successful in its wireless endeavors through partnerships with mobile virtual network operators, while mobile carriers have deployed and launched expansive fixed wireless broadband offerings, likely connecting over 10 million US households (about 7.5% of all US homes) by the 2024 year-end.22 Carriers, financial investors, and governments have all invested to deploy fiber and other high-speed broadband solutions. Meanwhile satellite offerings, especially low Earth orbit services, are growing in prominence and capability: One service has a reported 1.4 million US broadband subscribers, via terminals in 2024, and will be introducing direct-to-device capability in 2025 for smartphone text-based services.23 Indeed, competitive intensity is growing based on existing players entering new markets and new players taking advantage of technological improvements to offer new services. New technologies will likely continue to benefit the overall competitive intensity of the industry and have a positive impact on the CII.
The advance of new technologies could also imply that new customer and provider paradigms can emerge about how traffic is consumed and over which networks. Interoperability between the public radio access network (RAN), Wi-Fi networks, wired networks, private networks, and satellite could be a major success factor for the advancement of US communications infrastructure. Such interoperability is often referred to under the heading of “heterogeneous networks” or “HetNet” and we expect it to become an increasingly significant factor that will be measured by the CII in future years.
Achieving a CII target of 165 by 2030
Deloitte believes that the CII could reach an index target of 165 by 2030, achieving a 30% growth rate over our 2024 estimate. However, achieving this growth, benefitting consumers and businesses, is likely predicated on decisions being by made network owners, their technology suppliers, and the government.
Even with historic levels of government funding, capital expenditure from communications services providers is at least five times greater than government investment.24 Government investment can generate a compounding impact by augmenting the larger pools of private capital. Furthermore, without more spectrum, delivering higher speeds for more applications focuses even more pressure on operational efficiency to satisfy investors, which inevitably impacts job growth for the sector. Releasing more, attractive low and mid-band spectrum can mitigate a reversal of the index performance for future years, providing the necessary first ingredient for infrastructure to continue to flourish. A portfolio of dedicated, licensed spectrum for public RAN and satellite may be needed to increase the attractiveness of more use cases to drive demand.
In addition to a larger spectrum pool, the industry should not lose sight of innovations beyond 5G. If data and compute move to the edge, carriers may need to adopt a more holistic view of asset ownership, with traffic management, resiliency, and security taking on new meanings. Assets and capital spend will likely no longer be dictated solely by the radio access network and access fiber to homes, but on an encapsulated view of the HetNet required to connect endpoints, processes, and information. Wi-Fi, satellite, 5G, fiber, and any other emerging connectivity technologies can be managed together to help provide more valuable and reliable services while also reducing the security risks of an expanding threat surface.
In addition to a more holistic connectivity strategy, a healthy ROI for network investment will likely depend on carriers carving out a role in connected devices and AI/data centers. And the technology companies that supply operators may need to do more to open new revenue streams to justify the capital outlay for their networks. Going forward, they should bring solutions to market that drive connected device adoption to increase usage. One path to achieving this goal should come through intentional collaboration between equipment manufacturers, application providers, carriers, and industry vertical specialists to help address tangible business problems.
As the industry evolves, aligning strategic objectives across various stakeholders often becomes increasingly crucial to sustain growth and innovation. This alignment can be important for fostering an ecosystem where communications providers, consumers, and industries can thrive.
Deloitte intends to continue to publish the CII on an annual basis to provide a consistent barometer, tracking progress in US communications infrastructure. In addition, as the fidelity of the data model expands, specific CII metrics can provide valuable insights at various levels of granularity including geographic, demographic, and service-provider levels.
Methodology
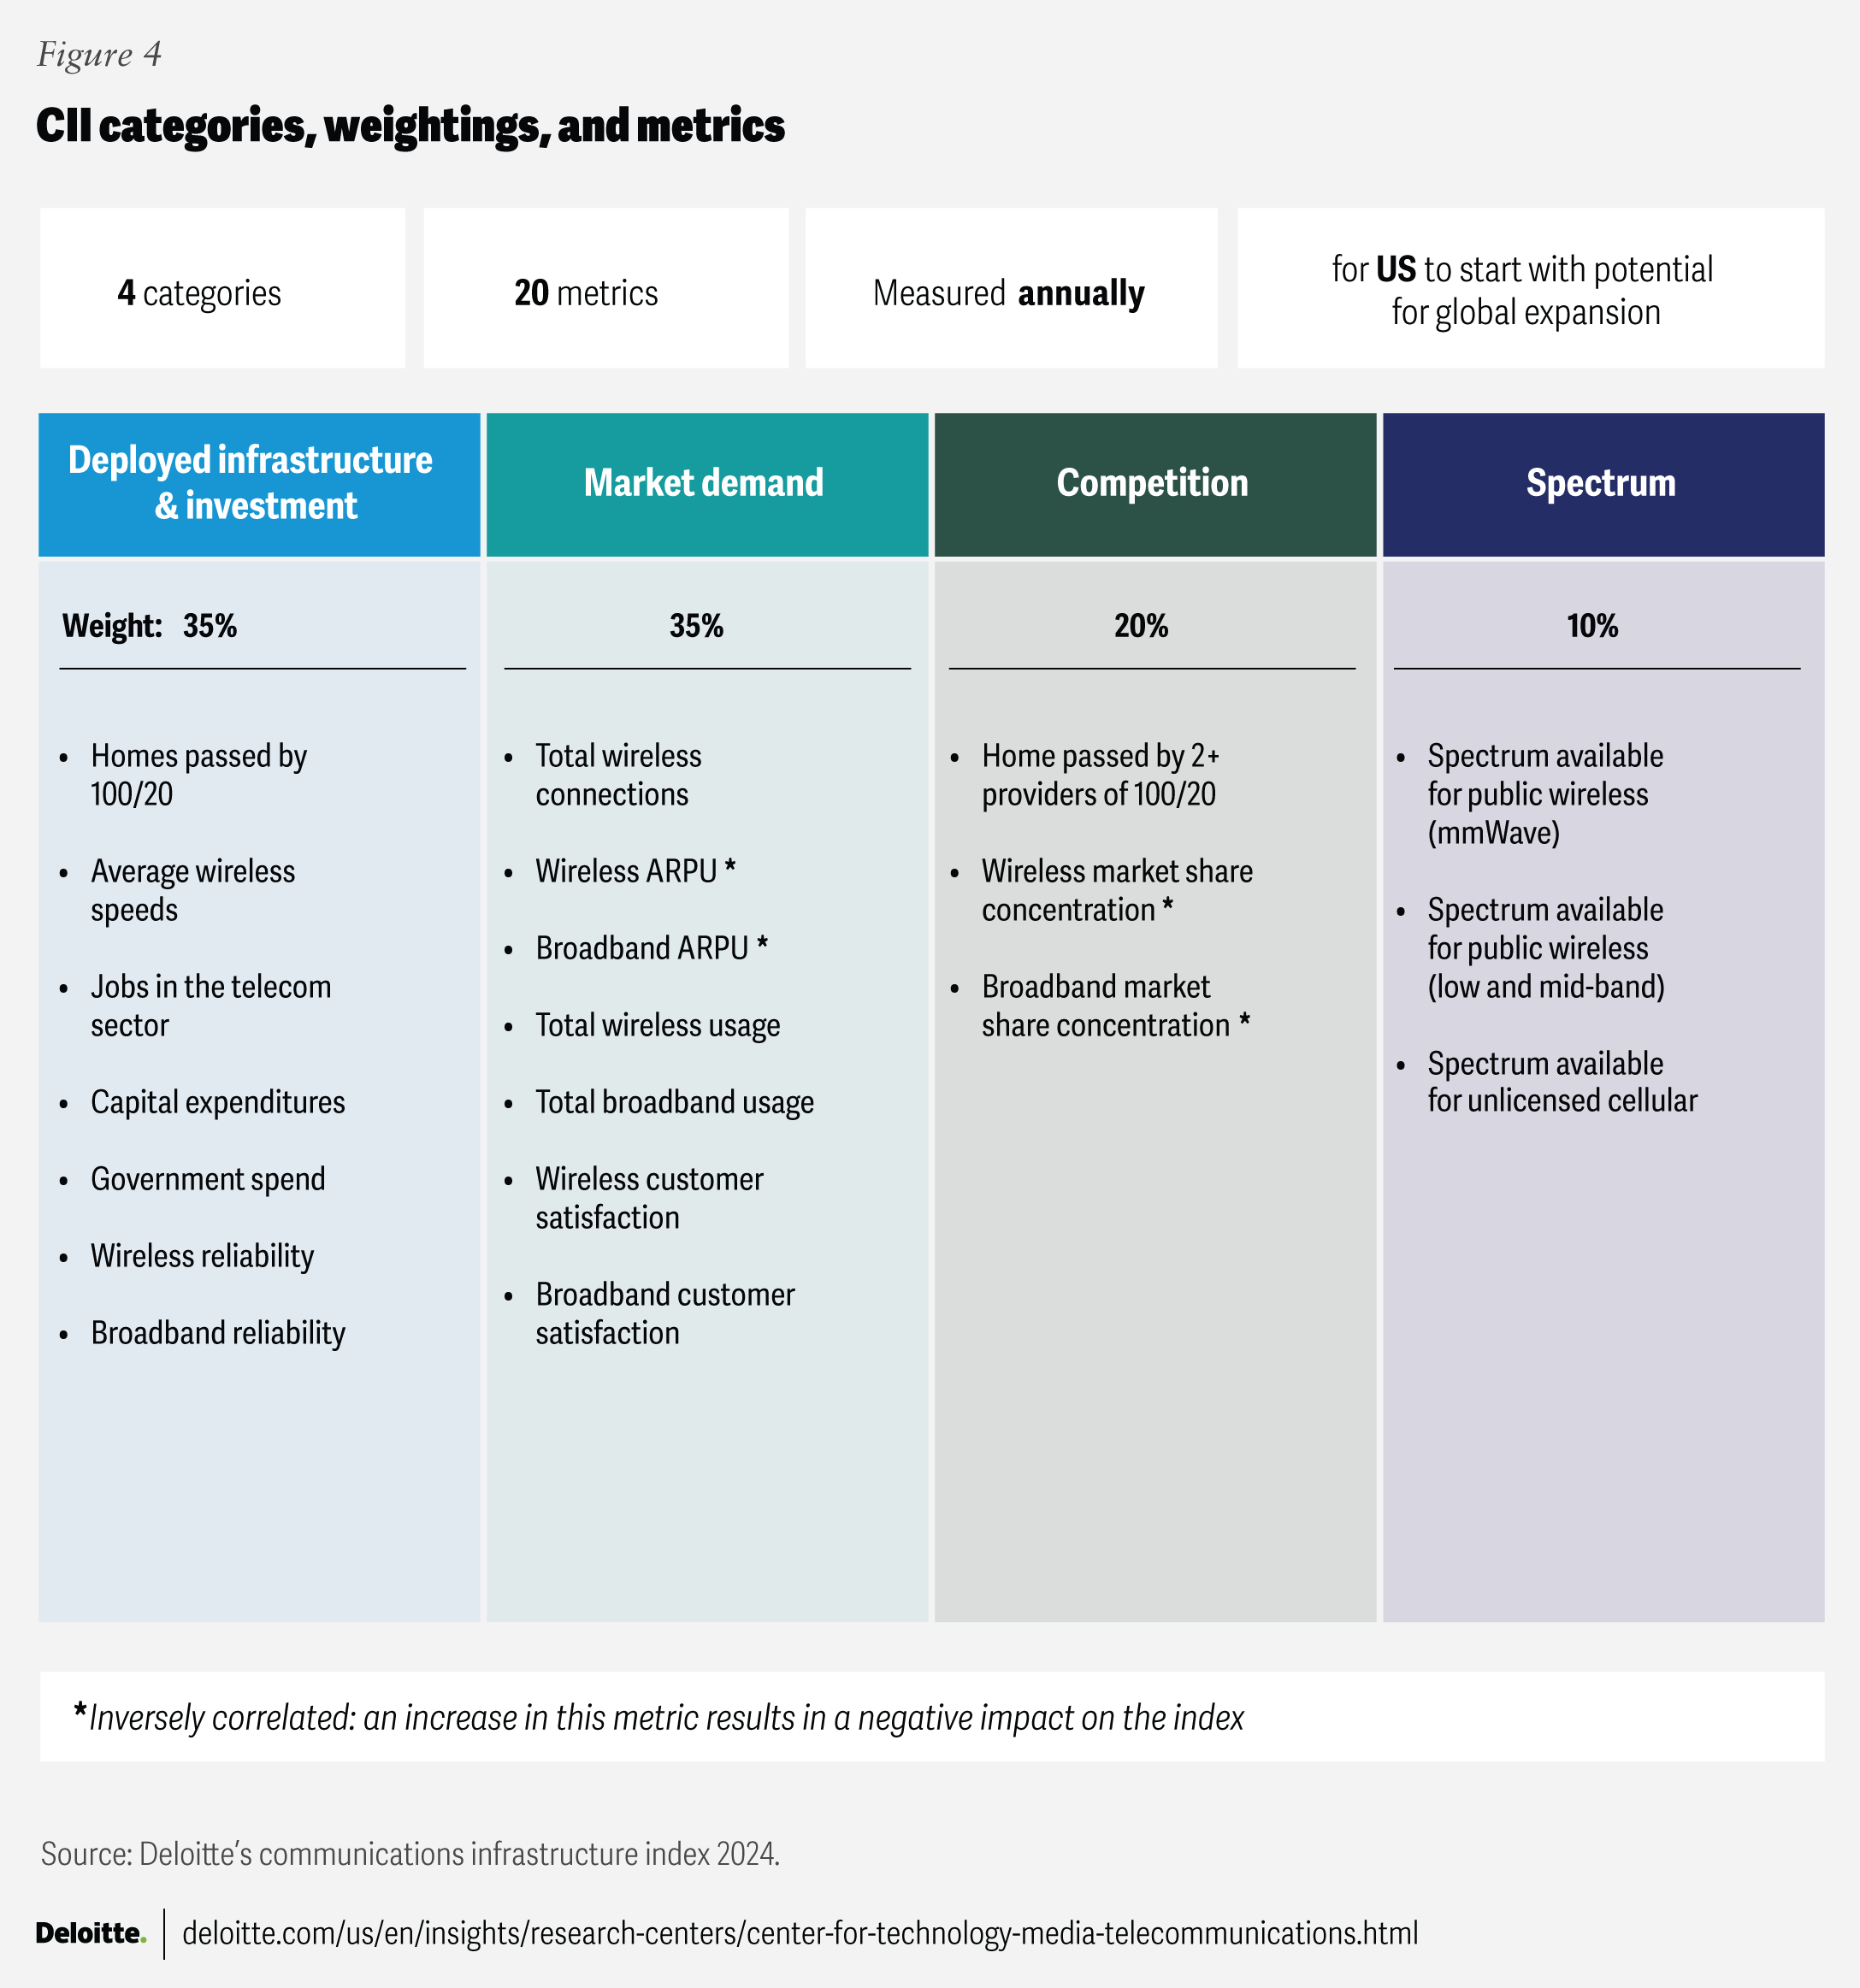
The communications infrastructure index, compiled by Deloitte’s US telecom practice in conjunction with the Deloitte Center for Technology, Media & Telecommunications, is a composite index derived from 20 metrics from sources including government agencies, Deloitte analysis of telecom company filings, and industry reports (see appendix). The underlying metrics were grouped into four overarching categories, each weighted to reflect their importance to long term infrastructure performance.


