


Smart mobility: Reducing congestion and fostering faster, greener, and cheaper transportation options has been saved
Smart mobility: Reducing congestion and fostering faster, greener, and cheaper transportation options Part of the "Smart mobility" research report
19 May 2015
For decades, many governments have tried to develop solutions to address traffic congestion, yet commute times continue to lengthen in most of America's urban centers. It’s time for a new approach.
The promise of smart mobility
New business models inspired by the sharing economy and disruptive technologies are ushering in an exciting new age in transportation: the era of smart mobility. The arrival of on-demand ride services like Uber and Lyft, real-time ridesharing services such as Carma and Zimride, carsharing programs such as Zipcar and car2go, bike sharing programs, and thousands of miles of new urban bike lanes are all changing how people get around.
Commuters no longer need to own a car to have one at their disposal. They don’t have to pre-arrange carpools to share a ride with others headed in the same direction. They needn’t wait for a ride home when it’s pouring down rain and there’s not an empty cab in sight.
For their part, automakers increasingly see themselves as both product manufacturers and mobility services companies. In addition to developing next-generation connected and autonomous vehicles that will improve traffic flows and safety, automakers are investing in a wide swath of new mobility services—everything from carsharing and rental services to multimodal trip-planning apps.
There’s no question that consumers have been the primary beneficiaries of new mobility services. The question facing urban planners is how today’s expanded mobility ecosystem can help advance public policy goals such as encouraging higher productivity and reducing congestion, while bringing related benefits such as fewer traffic accidents, better air quality, and a smaller urban footprint for parking.
Can alternative transportation modes help metropolitan areas reduce traffic congestion without spending tens of billions of dollars on new roads, tunnels, and light rail? And if so, what are the most promising strategies? Which approaches work best in which cities? How can automakers and transportation officials work together to address changing mobility needs?
These are just a few of the questions our analysis attempts to answer.
This study takes a data-driven look at what metropolitan areas can gain from expanded mobility ecosystems. We compare alternative approaches from ridesharing to biking, and explore how governments can focus scarce investment dollars on areas where they can do the most good.
Traffic congestion in America: Grim and getting worse
The need for answers to America’s traffic gridlock problem becomes more acute each year. In much of the nation, traffic congestion has increased to alarming levels, with associated costs estimated at $121 billion, equivalent to slightly more than 1 percent of all annual US personal consumption.1
The average American spends about 34 hours every year sitting in traffic. That’s a whopping 5.5 billion hours for all commuters.2 The economic opportunity cost is staggering: $330 million daily, or about $124 billion every year. If nothing changes, this cost could grow to $186 billion by 2030.3
And that’s just the cost to individuals. Every mile we drive costs governments 7.5 cents, and at almost 3 trillion vehicle-miles traveled per year, those miles add up.4 If you include the cost of congestion, air pollution, or even lost property value near roadways, the total estimated external cost of driving runs between 27 cents and 55 cents per mile.5
For decades, governments have tried in vain to develop solutions to address congestion. High-occupancy vehicle (HOV) lanes and costly public transportation networks may have slowed the growth of congestion, but commute times continue to lengthen in America’s urban centers. Estimates suggest that only 15 percent in congestion savings can be achieved even with widespread deployment of such conventional measures to all major freeways.6
Clearly, a new approach is needed.
Nurturing the elements of smart mobility ecosystems
Helsinki, Finland has announced an audacious goal: By 2025, the city plans to make it unnecessary for any city resident to own a private car. The goal is an on-demand mobility system that would allow customers to choose among public and private transport providers and assemble the fastest or cheapest way of getting anywhere they need to go at any time.
“The city’s role is to enable that market to emerge,” explains Sonja Heikkilä, a transportation engineer with the city.7
Bus routes would be dynamic, changing based on current demand at any moment. From planning to payment, every element of the system would be accessible through mobile devices.8
Citizens could arrange a personalized travel experience irrespective of location. Wherever they are in the city, they could access a variety of options with their phone: a rideshare, an on-demand bus, an automated car, special transport for children, or traditional public transit. Residents could purchase “mobility packages” from private operators that would give them a host of options depending on weather, time of day, and demand.
Today, our congested transportation system is designed around infrastructure and vehicles: roads, bridges, subways, and buses. Helsinki’s 2025 vision points to a very different future model, one designed around individual mobility—moving each traveler from point A to point B as quickly and efficiently as possible. US cities also are beginning to reimagine their transportation ecosystems around this concept.
A transportation system designed around individual mobility would prominently feature four modes of alternative mobility (as well as more traditional modes such as buses):
- Ridesharing (i.e., carpooling), which taps into an abundant yet underutilized resource: empty car seats. This option doesn’t add any new vehicles to the system, and that’s why it could help reduce the traffic congestion that plagues most cities today. Unfortunately, carpooling has declined from around 20 percent of all commuters in 1970 to less than 10 percent today.9
- Bicycle commuting, which has been on the upswing in recent years, particularly in Europe and in cities with relatively flat terrain, miles of bike lanes, and other cycling infrastructure. For commutes of a few miles or less, biking is often the fastest way to get to work.10
- Carsharing, enabled by new technology that allows companies and individuals to rent cars by the minute or hour.
- On-demand ride services companies such as Uber and Lyft, which allow ordinary motorists to use their personal cars to offer prearranged transportation services. These services, enabled by mobile and GPS technologies, are making the taxi market more competitive.
See appendix A for a more detailed definition and description of each mode.
 These forms of transportation have seen different levels of popularity in recent years. Ridesharing, as mentioned above, has been in decline for decades. On-demand ride services, on the other hand, have seen rapid growth since their launch several years ago.
Individual, corporate, and government incentives line up well for some of these modes, and poorly for others. Where the incentives align, we see faster growth (figure 1). Ridesharing, for example, suffers from a lack of both individual incentives to participate and private sector incentives for technological innovation. Carsharing’s growth has been more rapid due in part to automobile manufacturers’ entry into the carsharing business and relatively enthusiastic support from municipalities.
We now take a more detailed look at the current and future role that each of the four transport modes can play in addressing America’s traffic congestion problems.
Our methodology
To understand which cities—and even neighborhoods—stand to gain the most from better congestion reduction strategies, we examined a variety of data, most prominently commuter behavior at the census-tract level. Using data from the Census Bureau’s American Community Survey (ACS) and Census Transportation Planning Products (CTPP), we estimated the number of people who could reasonably rideshare or bike to work.11 We then tallied up how many vehicle miles traveled (VMT) and congestion-cost dollars would be saved if all of these commuters used alternative transportation.12
For carsharing, we used a slightly different approach. Using ACS data, we estimated the population in each tract matching the target demographics of carsharers.13 With these numbers, we estimated the number of neighborhoods nationwide with strong carsharing potential.14
On-demand ride services, the newest of the alternative transportation modes we studied, also offers the least available data.15 Our estimates for this mode are thus less detailed.
For each mode, we compare current usage rates with estimates representing our model’s maximum possible usage.
A more detailed description of our methodology for capturing the existing and potential reach of alternative mobility approaches can be found in appendix B.
Ridesharing: Modernizing how empty passenger seats in vehicles are filled
Bowling alone and driving alone: The long, slow decline of carpooling in America
For decades after World War II, the carpool to work was a daily ritual for millions of Americans, mostly suburban (and then, mostly male). Through the 1960s and into the mid-1970s, one in five workers carpooled to their jobs.16
How times have changed.
Most suburban—and even many urban—households now have at least two cars. More often than not, both parents drive into work by themselves, in separate cars. Today, fewer than one in ten commuters nationwide shares a ride to work.17 Fully 77 percent of Americans drive to work alone.
And, in contrast to the suburban business commuters of days past, carpooling today is often associated with lower-income workers with limited resources.18 Many of today’s carpoolers do so out of economic necessity rather than choice.
But the news on the ridesharing front isn’t all bad. Despite the 30-year decline in carpooling rates, several factors—new technologies enabling real-time ride matching, changing attitudes toward car ownership, the growth of the sharing economy, and an increasing number of managed lanes that provide incentives for carpooling—offer significant opportunities to revive ridesharing.
We analyzed ridesharing rates in 171 metro areas across the United States and identified some important factors that will help determine ridesharing’s future.
Measuring ridesharing’s economic potential
The beauty of ridesharing lies in the fact that it taps into an abundant yet underutilized resource: the empty seats in cars. Every day millions of Americans drive to work by themselves, in parallel with neighbors who very often are driving to similar locations. These empty seats in cars represent a huge source of waste in our transportation system—but potentially also a huge opportunity for improvement.
What is the potential impact from reducing this waste? To model potential rideshare savings in cities, we treat transportation choices as a function of fuel costs, congestion patterns, attitudes, and assembly costs. (See appendix B for a detailed description of our methodology.)19 We imagine a world in which assembly costs for ridesharing approach zero and societal attitudes toward ridesharing are more supportive. This scenario allows us to calculate the personal and societal benefits that could accrue if all commuters who could reasonably rideshare to work did so.
A detailed examination of our methodology can be found in appendix B, but here is the Cliff’s notes version. We used geospatial analysis of demographic data to calculate the number of likely ridematch pairs within each census tract who live within one mile of one another, leave for work at the same time in the morning, and travel to the same workplace tract. To account for commuters who engage in “trip chaining”—stopping along the way to and from work to carry out other business—we reduced this number by 16 percent.20 We then calculated the reduction in vehicle miles traveled (VMT) and fuel savings if the pair chooses to rideshare.
Figure 2 shows ridesharing’s economic potential, nationwide and for the 10 largest cities by projected number of new carpoolers.

We estimate that almost 19 million commuters in US metro areas could switch from driving to ridesharing if current barriers to ridesharing were eliminated, resulting in a 27 percent overall modal share.21 This switch would have enormous societal benefits: We project maximum potential savings from increased ridesharing at $30.3 billion annually. These savings would accrue from several sources: $15.8 billion in direct annual savings to new carpoolers due to reduced vehicle upkeep, $11.6 billion in indirect savings from lowered congestion costs, and $1.8 billion in reduced annual road infrastructure costs. Furthermore, traffic-related accidents could fall by 22,915 annually (yielding $847 million annual savings), while carbon dioxide emissions would fall by 9.1 million metric tons annually—yielding societal savings of $338 million.
To be clear, our estimates represent a best-case scenario that may take years to be fully realized. Our point is to show the vast, and currently mostly unrealized, potential of this mode of transportation. Our results further reveal some general trends indicating where ridesharing could be most effective.
An important finding of our study is that “ring” neighborhoods could become ridesharing hotspots. Neighborhoods with high ridesharing potential, according to our analysis, are usually distributed in a ring 10 to 15 miles outside each city’s urban core. These neighborhoods tend to have higher concentrations of commuters traveling each day to similar workplace destinations, both in the city center and in office parks and edge cities throughout the metro area. (Here’s a surprising fact about tomorrow’s ridesharing: It’s not only commutes from the suburbs to the city center which offer the best opportunities for increasing ridesharing. Many commuters who live in tracts that can be hotspots for ridesharing do not in fact work in a city center.22)
A classic example is Indianapolis, where neighborhoods with the highest numbers of potential new ridesharers are concentrated about 10 to 12 miles from the city center, in suburbs such as Carmel, Fishers, Greenwood, and Brownsburg (figure 3). The map in figure 3 shows census tracts with higher projected levels of ridesharers as darker blue. The bulls-eye pattern of carpool potential shows clearly here because there are relatively few physical boundaries near the city and no contiguous metro areas to complicate the pattern.

Eight ways to encourage ridesharing
Our analysis demonstrates the enormous economic potential of ridesharing—$30.3 billion in annual savings if ridesharing were embraced by its maximum potential user base, or about a fifth of US commuters. So how do we get there? Experience teaches that it won’t be easy. The following strategies, however, could help make progress.
- Expand tax incentives to rideshare. Extending the employee pre-tax benefits currently available for parking, transit passes, and vanpool costs to ridesharing could increase its appeal to commuters. New technology that verifies vehicle occupancy could aid the implementation of this benefit. Carma’s new ridesharing app, for example, was tested in Austin, Texas in 2014, and program evaluation results are due in the spring of 2015. Carma’s app verifies the presence of two passengers in an automobile, which qualifies the automobile for an automatically applied 50 percent toll discount; with three or more passengers, the auto is eligible for a 100 percent rebate.23 The total cost of this pilot was slightly less than $1 million, partially funded through a federal grant. The program is continuing to grow. A mid-year interim report showed 322 new carpools encouraged by the program and approximately 250 daily carpool trips in the fourth quarter of 2014.24 The estimated cost of constructing new lanes to provide the same capacity would be between $5.8 million and $17.4 million.25
- Improve ridematching platforms’ customer experience. Most cities we studied have already invested in online ridematching platforms (all but 6 of 79 cities26) or participate in a statewide rideshare platform. But none of these platforms has attracted enough members to achieve a critical mass of commuter participation. Cities need to determine how best to marshal private sector innovation to bring first-class user interfaces, highly reliable service, incentives for participation, and widespread public awareness to ridematching. If policymakers and on-demand car service providers began to view each other as allies in the battle to reduce congestion, then the public sector might make quicker progress in achieving its goals. For example, states or cities could incentivize commercial platform providers with large user bases such as Sidecar, Uber, and Lyft to increase the percentage of their customers who share rides with other passengers. Such incentives might encourage providers to enhance their shared ride user interfaces, outreach, and marketing.Creating incentives for increasing carpooling might also encourage on-demand service providers to partner with carpool providers to create synergies, as recently announced by Uber and Carpooling.com in Europe. This new deal has Uber providing first-mile drop-offs and last-mile pickups to support Carpooling.com’s long-distance carpools.27 Technological innovations are already poised to improve the customer experience for tomorrow’s ridesharers. Mobile apps that today measure driving habits to help convey insurance discounts will likely be used tomorrow to credit drivers and passengers with toll discounts in real time, without making them register as a carpooler.
- Use infrastructure investments to support ridesharing. Commuters who carpool are motivated principally by the time or money they can save by doing so.28 And, as the Federal Highway Administration has observed, “Infrastructure plays an important role in helping dynamic rideshares accumulate time and money savings” by allowing carpoolers free or reduced-cost access to restricted lanes.29Real-time ridesharing initiatives should be bundled with high-occupancy vehicle (HOV) and high-occupancy toll (HOT) lane projects, as well as in any new designated commuter lots that can facilitate the convenient pickup and drop-off of passengers via dedicated entrance and exit ramps. For example, when a city or state secures funding to create managed lanes, we recommend they direct a portion of those funds into investments in digital infrastructure for real-time ridesharing.According to the Texas Transportation Institute, an average 7 percent of congestion reduction can be attributed to operational treatments such as HOV lanes, with higher percentages in large cities such as New York and Los Angeles.30 In our study, we found that carpooling rates are higher by almost 1 percent in metro areas with HOV lanes—a small but significant difference.31
- Focus on building critical ridesharing mass in key corridors. Rather than trying to expand ridesharing across a wide region, planners should focus on building a critical mass of users in particular corridors.32 To understand which corridors offer the greatest ridesharing potential, planners should target the areas with the biggest potential supplies of carpoolers based on commuting behavior, neighborhood demographics, and supporting infrastructure. A base level of “guaranteed” service (meaning that a commuter will always be guaranteed a carpool on a corridor) is needed to generate repeat users until a critical mass is achieved.33 Many cities already have guaranteed ride-home programs (56 out of 79 in our sample). These programs typically offer vouchers to members to pay for a cab if they miss their vanpool. Such programs should be tied to real-time ridesharing initiatives to help provide a guaranteed service level until the corridor network is dense enough to achieve stable critical mass.
- Recruit participants through trusted channels. The greater the number of employees in a given location, the more likely it is that rideshare matches can be found. Large companies, universities, and hospitals have hundreds or thousands of people working in the same setting, and they may have a strong incentive to encourage carpooling to reduce the need for parking infrastructure. Recruiting efforts are most effective when they involve trusted channels such as employers.34New employee orientations, for instance, represent an effective channel for improving awareness of ridesharing as a commuting option.35 Cities such as Indianapolis, IN and Jacksonville, FL are exploring strategies to use employer outreach to increase ridesharing.36 Transportation demand management (TDM) agencies—usually housed in a city’s metropolitan planning organization (MPO)—can serve as a bridge between employers and ridesharing providers.
- Target younger commuters. Recent years have seen significant shifts in attitudes toward vehicle sharing, especially among Millennials. Forty-two percent of Generation Y consumers in the United States (versus 28 percent for other generations) say they are willing to carpool if carpooling is readily available and convenient.37 These shifts are reflected in recent census data: The median age of those who commute to work using shared rides (carpool or vanpool) in 2013 was 39, compared with 42.8 for single-occupancy vehicle drivers.38 Similarly, cities with younger populations have slightly higher rates of ridesharing.39
- Establish public-private partnerships (PPPs) to improve mobility. PPPs are often used to finance large-scale capital projects. Forward-looking jurisdictions could expand their use of PPPs by adopting pay-for-success models that specify particular mobility outcomes (for example, by setting a goal of a certain year-over-year increase in carpooling’s modal share in a particular corridor), rather than the means by which those outcomes are to be achieved. Doing so could open up new kinds of partnerships with automakers, ridesharing companies, and others exploring new mobility services and stimulate innovative methods for reducing gridlock in some of the most congested corridors. A special kind of funding mechanism known as social impact bonds, which are contracts with government agencies that are only repaid if certain social benefits are achieved, could be used to provide additional incentives for innovation within such PPPs.
- Encourage nationwide leadership in carpooling advocacy. Cities that have formal goals to increase ridesharing have higher rates of carpooling overall, suggesting that leadership plays a small but significant effect in influencing commuter transportation decisions. Yet, at present, there is no national carpooling/ridesharing alliance comparable to the National Alliance for Biking and Walking, which advocates for the interests of bikers and pedestrians in local communities. Few and far between are the federal and state government organizations that set carpooling goals for their own employees, let alone for their constituents. A nationwide ridesharing alliance and explicit public sector ridesharing goals for government employees could inspire commuters and coordinate efforts among cities, while helping local ridesharers find one another and organize grassroots interest groups.
These strategies are relatively cheap compared to infrastructure, and are likely to offer significant returns on investment for state and local transportation officials.
To explore further our projections for ridesharing’s potential and current rideshareing policy and infrastructure, we invite you to view our interactive map.
Bike commuting: Unleashing its economic, health, and safety benefits
Any American who visits European cities such as Amsterdam, Copenhagen, and Stockholm cannot help but marvel at the thousands of bike commuters streaming past them on the morning commute, in all types of weather. In these cities, up to half of all commuters bike to work each day, more than those who drive or take public transport.40
The story is very different in the United States, of course. Only 0.6 percent of commuters currently bike to work in the urban areas we study here. The good news is that bike commuting in America is growing by about 7.5 percent annually.41
Even so, given such low participation rates, it’s unsurprising that biking is far from the top of the list of transportation planners’ congestion reduction strategies. After all, most communities lack good biking infrastructure, and US commutes tend to be longer than those in other nations, which can discourage bike commuters.42 Our pervasive car culture also makes persuading Americans to give up the comfort of their cars daunting.
That said, the number of potential commuters in America’s metropolitan areas who could bike to work with relative ease is much higher than one might expect. A recent MIT analysis of several large cities, including Washington, DC, Philadelphia, and San Francisco, indicates that biking would be the fastest way to reach large portions of each city’s areas during rush hour.43
The economic potential of bike commuting
To estimate the potential economic returns of increased bike commuting, we created a geospatial model based on the assumption that anyone who works five or fewer miles from home could reasonably commute by bike, at least sometimes, given improved infrastructure, better commuter benefits, and sufficient societal encouragement. We chose five miles because that distance comprises 75 percent of all bike trips from the most recent nationally representative survey of commuting patterns.44 We reduced our projections to account for well-known determinants of bike commuting frequency such as trip-chaining, weather, and climate (for details of our modeling techniques, see appendix B).
Based on these assumptions, we estimate that a little less than a quarter of current commuters (28.3 million out of 108.4 million) could switch to bike commuting as one of their main modes of commuting if barriers to biking were substantially reduced. To be sure, an increase of this magnitude won’t happen anytime soon in America, but even much smaller increases would have large impacts on traffic congestion and health and wellness.
According to our analysis, the economic potential from increased bicycle commuting is almost as high as that from increased ridesharing. The potential annual VMT reduction from new bikers (13.1 billion VMT) would amount to almost 1/2 of 1 percent of all vehicle miles driven last year (2,950,402 million), according to the Federal Highway Administration. (see figure 4).

We recognize that few, if any, bike commuters will bike to work every day of the year. In fact, hours of daylight, weather, and climate will keep many from cycling as far or as often. We therefore apply a conservative annual frequency factor of 96 days per year to arrive at our predicted total mobility savings from biking of $27.6 billion.
As with our projections of savings from increased rideshare, projected bike commuting savings will come from several sources. New bike commuters would reap direct benefits of $7.7 billion through fuel savings and reduced vehicle ownership costs. Taking more cars off the road would benefit commuters nationwide, who stand to reap $17.1 billion in indirect savings due to reduced congestion-related fuel and time wastage. Cities stand to gain $2.6 billion annually in indirect savings based on lower road construction costs, reduced accidents, and lower carbon dioxide emissions (see appendix B for details of savings calculations).
Figure 4 shows the potential savings from increased bike commuting for the 10 largest metro areas in terms of number of potential new bike commuters.
It’s important to again underscore that these figures represent an idealized future state, a theoretical ceiling we could reach with improved biking infrastructure, technological changes, and societal forces that promote bike commuting. The barriers to bike commuting are substantially different from those affecting other alternate forms of transportation. We’ve already mentioned distance, climate, weather, and trip-chaining. Other factors that potential bike commuters often cite as keeping them out of the saddle include perceived and actual safety considerations, lack of dedicated bike lanes and infrastructure, fear of traffic, lack of daylight, and inconvenience.45
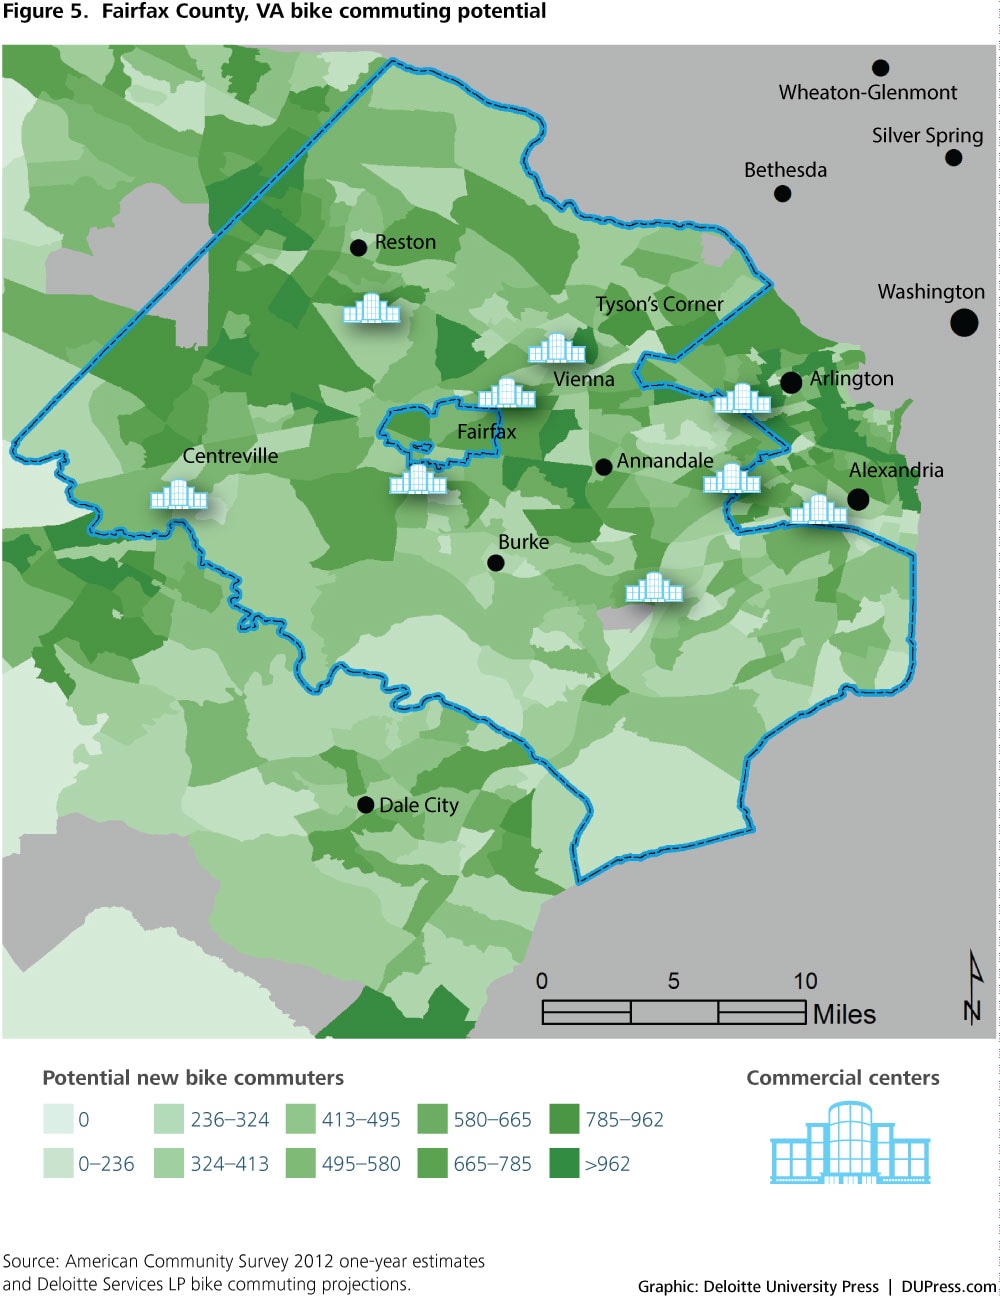
Bike commuting potential in Fairfax County, VA
The map in figure 5 shows bike commuting potential in Fairfax County, VA, located just outside of Washington DC; darker shades indicate areas with greater potential.
The areas with higher concentrations of potential bike commuters cluster around suburban “edge cities” containing commercial centers such as Reston, Tysons Corner, Herndon, Manassas, and Woodbridge. The identity of some of the “hot spots” may be counterintuitive, particularly Tysons Corner, which used to be a national symbol of car-friendly and congested development. But these areas are typical of what we found in our nationwide study, and “bikeability” now forms a major part of Tysons Corner’s long-term development plan.46
Medium-density suburban neighborhoods located one to three miles away from thriving commercial developments offer surprisingly good opportunities for increasing bike ridership. Further down the I-267 Dulles Tollway is Reston Town Center, another car-friendly suburb that has begun planning for 13 bikeshare stations to sustain its economic growth and attract younger residents.47
Which neighborhoods offer the greatest potential?
Bike commuting’s potential value is not evenly distributed inside each metro area. The greatest potential benefits are likely to be in core urban centers and, perhaps surprisingly, in suburban neighborhoods near smaller commercial centers (see sidebar, “Bike commuting potential in Fairfax County, VA”).
Nine ways to accelerate bike commuting
Our research suggests nine ways in which cities can align incentives to accelerate the growth of bike commuting.
- Invest in bike infrastructure. The biggest barrier to increased bike commuting in America is road safety.48 Some European cities have addressed this problem in innovative ways. In Copenhagen, for instance, biker safety has increased significantly due to improvements in biking infrastructure, such as intersections with dedicated bicycle traffic lights, wider bike lanes in congested areas, and a comprehensive regional bike planning approach that ties the whole network of bike lanes together across municipalities.49Increasing bike safety requires investments in biking infrastructure. Continual small improvements in this infrastructure are one of the main factors contributing to bike commuting’s slow but steady growth.50 And, fortunately, a little funding can go a long way. One nationwide 2013 survey found that even the most expensive bike infrastructure costs an order of magnitude less than many roadway upgrades.For example, the average cost of a mile of bike lane is $133,170, compared with an estimated cost of $2.5 million per lane-mile for roadways.51 The first phase of Reston Town Center’s bikeshare project, including bicycles, stations, operations, and maintenance, will cost $1.2 million, some to be contributed by private partners. Cities can carry out such improvements piecemeal, without the multimillion-dollar financing packages required for other transportation infrastructure.The return on investment (ROI) for bike infrastructure improvements, moreover, is comparatively high. In 2013, for example, the Pedestrian and Bike Institute estimated that building one mile of new bike lane at a cost of $133,000 in an area of medium residential density such as Washington, DC could increase bike commuting by 30 percent.52
- Build smart biking infrastructure. As they construct new signage, bike lanes, and traffic signals, cities should also take advantage of emerging technologies to improve their biking infrastructure. In 2013, the city of Chicago announced it would begin using micro-radar to count passing cyclists on some of its transportation routes to improve its transportation planning.53 Arlington, VA uses real-time bike counters on several of its trails.54 In Copenhagen, LED lights have been embedded in the pavement to alert cyclists to maintain their speed; this helps them catch green lights at upcoming intersections. Currently in development are sensors that could detect groups of cyclists riding together and keep intersection lights green longer.55
- Encourage bikesharing programs. Economists and planners know that there’s a tipping point for transportation safety. As more new bikers join, safety—and the perception of safety—improves for all. Growing numbers of bikeshare stations can encourage enough new bikers to start riding in an area to jumpstart this virtuous cycle. For those who haven’t tried them, bikeshares are programs where members and casual users can rent bikes by the hour, picking them up and dropping them off at convenient bikeshare stations around the city. The community-building effect of bikesharing has been observed in Portland, OR, Chicago, and Washington DC, and is beginning to materialize in suburban satellite communities as well.56
- Create PPPs to fund infrastructure improvements. PPPs can fund infrastructure improvements and generate new demand. Alta Bikeshare, the commercial partner of Washington DC’s Capital Bikeshare, had 567,997 total members as of November 2014, with membership growth of around 2 percent monthly.57 Alta Bikeshare plans to partner with Fairfax County, VA and Reston-area developers to bring 13 bikeshare stations to Reston Town Center.58 Social impact bonds, described earlier in this paper, could be used to provide additional incentives for innovation within such PPPs.
- Build biking infrastructure where it can have the biggest impact. Studies of numbers of potential new bike commuters, such as this one, can help determine where investments in new bike infrastructure should be made. Communities should consider physical and geographic factors such as the number of parallel direct routes to a centralized business district (which facilitate new bike routes) or the presence of large highways transecting bike corridors (which hamper flows). Micro-targeting outreach efforts to such neighborhoods can help maximize the growth of bike commuting. Similarly, households with fewer vehicles or fewer drivers, as well as commuters who rent their homes, show a greater preference for biking.59 Geographic variations are important to understand as well; the West and Midwest have higher biking rates than the South and Northeast.60 Geographic variation includes both cultural factors and weather. In fact, climate has a weak relationship with biking patterns, according to the Alliance for Biking and Walking, which finds that excessive heat, cold, and rainfall only slightly deters some bike commuters.61The German city of Wiesbaden provides an ingenious way to ensure that bike paths are built where they’re most needed. As cyclists pedal around city streets, an app traces each route they take and adds it to a huge crowdsourced map of proposed bike paths in the city.62 Data from the thousands of bike rides is aggregated onto the map, which shows the most popular routes.
- Develop regional bike plans. Most of the 79 cities examined in this study have municipal biking plans, but few have regional biking plans extending across the metropolitan region. Salt Lake County is an exception, encouraging bike commuting through a regional transportation plan that connects cities within the contiguous metropolitan area.Salt Lake County’s plan is intended to ensure that roads and trails throughout the region connect sensibly, so that bikers can commute reliably and without disruption as they pass through different jurisdictions. This makes sense not only in terms of the plan’s expected environmental and public health impacts, but in economic terms as well. For the cost of a single interstate overpass, Salt Lake County estimates it can instead build out a comprehensive, integrated active transportation system that spans the entire county.63 In so doing, metro areas like Salt Lake County are building on academic research showing that cyclists are encouraged to bike more when infrastructure is continuous.64
- Link bike commuting to public health. Governments can promote bike commuting by linking it explicitly to health outcomes in outreach efforts to private citizens and to employers. For individuals, governments can highlight a demonstrated correlation between bike commuting and health. A study of Danish adults, for instance, shows that cycling to work lowers mortality rates by 28 percent after normalizing for differences in occupation, smoking, leisure time activities, and body mass index.65 When the audience is employers, governments can highlight health insurance savings for companies that promote bike commuting.One Minneapolis company offering financial incentives to employees who commute by bike found that its health insurance costs during the trial period fell by 4.4 percent.66 The UK government and business community is promoting biking initiatives through a cycle-to-work scheme. The initiative allows employers to loan bicycles and related accessories to employees as a tax-free benefit that saves employees 42 percent on associated costs.67
- Use big data to encourage bike commuting. In the future, personal mobility data will feed into central statistical databases that will be used to track citywide progress in health, commuting efficiency, and trail conditions. Anonymized biking data from both public and corporate repositories will improve overall bike planning and provide incentives to the private sector to support more biking.Strava, an app used to track cycling activity, is a good example. Strava allows bikers to upload GPS data about their bike rides to a central portal where they can compare their distances and speeds with other cyclists’ training regimens. In the process, a new trove of geospatial data is collected that can allow transportation planners to see which bike trails are most popular.68 Similarly, the “Copenhagen Wheel” partnership between the city of Copenhagen and the MIT Media Lab is collecting anonymized data on bike commuters’ speed and distance and combining it to disseminate real-time information on bikeway conditions to all riders.69
- Expand tax incentives to encourage bikesharing and bike commuting. The federal Bicycle Commuting Act of 2008 allowed employers to deduct up to $20 per employee from their own taxable incomes when offering bike commuting benefits. This is a useful start, but one that compares poorly to the $115 per employee deductible available for transit benefits.70 Extending greater pre-tax benefits to bikesharing and bike commuting programs could increase its appeal to employers.
Carsharing: Extending the benefits of automobility without the attendant costs
Carsharing programs are changing how urbanites across the country get around. These services give consumers all the benefits of automobile ownership without the attendant high fixed costs (including purchase, insurance, maintenance, and parking costs).
In its most basic form, carsharing is car rental by the hour. Providers include commercial entities such as car2go, owned by Daimler Benz; DriveNow, owned by BMW Inc; and Zipcar, owned by Avis. They also include private individuals who participate in peer-to-peer (P2P) carsharing programs, renting their personal vehicles for use (e.g., through avenues such as Getaround, RelayRides). These P2P programs can serve less dense and lower-income areas than their commercial counterparts, which require a certain level of population density and a certain demographic profile to be commercially viable.
The expansion of carsharing is visibly changing the transportation landscape in urban areas. While these programs have existed since the '90s, they have grown impressively in recent years, achieving a sizeable consumer base and prompting major automakers to acquire carsharing companies.
Last year, commercial carsharing membership in the United States rose by 34 percent to more than 1.3 million members, up from less than a million in the previous year. The nation’s commercial carshare fleet grew to more than 19,000 vehicles in 2014, an increase of more than 2,300 vehicles from 2013.71
The growing popularity of carsharing should come as no surprise, since autos are unlikely to be replaced anytime in the foreseeable future as the “personal vehicle” of choice. As Chris Borroni-Bird, co-author of Reinventing the Automobile: Personal Urban Mobility for the 21st Century, explains, “No other means of transportation offers the same valued combination of safety, comfort, convenience, utility, and choice of route and schedule.”72 More than 75 percent of US consumers still see the personal car as their preferred mode of transport, although this preference is lower among younger consumers.73 For Generation Y consumers, in particular, affordability and high operational and maintenance costs are enough to dissuade many from owning a vehicle, making carsharing programs an attractive alternative.74
Growth and trends
Carsharing’s steady growth has been accompanied by a corresponding increase in studies of the phenomenon. The trends that will determine carsharing’s future thus are becoming clearer. Here are some highlights.
Carsharing services are a niche transportation option for certain demographic groups. Today’s typical carsharing participants live in urban neighborhoods with medium to high household densities and have relatively high education levels; a large proportion of them rent their homes. For carsharing services to be commercially viable, a new carshare “pod”—that is a fixed parking area for one or more carshare vehicles—needs a minimum of households from the target demographic within a half-mile.75
Carshare members eventually reduce the number of cars they own. While many members are already carless when they join carsharing programs, research shows that overall participants eventually reduce their average vehicle ownership from 0.47 to 0.24 vehicles per household, with one-car households that become carless constituting most of this shift.76 This shift typically takes place over several years.
Carsharing services are leading more Americans to forego vehicle purchases. As more Americans come to view carsharing as a viable alternative, they will forego the purchase of a vehicle. One analysis found that carsharing services led Americans to forego the purchase of 500,000 new or used cars between 2006 and the end of 2013.77
The congestion-relief potential of carsharing rises with the number of carsharing services. Studies show that carsharing significantly reduces the number of cars on the road. According to one estimate, each carsharing vehicle reduces the need for 9 to 13 private automobiles.78 At the same time, the average number of vehicle-miles traveled by carsharing members is also reduced, with estimates of the reduction ranging from 26.9 to 32.9 percent.79
The evolution and growing ubiquity of carsharing services should fuel continued growth. Previously, carsharing was limited to neighborhoods within half a mile of an available parking lot. This is no longer the case. Business models have evolved to include both point-to-point and round-trip systems, while parking options have expanded to include both on-street and dedicated spaces in an increasing number of new developments, increasing the flexibility and convenience of carsharing. As carsharing networks become denser and more ubiquitous, their attractiveness to vehicle-holding households will increase.
Changing consumer preferences will facilitate the growth of carsharing services. A recent global Deloitte survey of consumer attitudes and preferences revealed that, among 23,000 consumers in 19 countries (in both developed and developing markets), an average of about 50 percent of respondents did not consider personal cars as their preferred mode of transportation.80 The study showed that the views of younger Americans are often in line with those of their peers overseas. In the United States, just 64 percent of Generation Y consumers view the personal car as a preferred mode of transport.81 This shift in consumer preferences will further broaden the appeal of carsharing.
Estimating carsharing potential
As with ridesharing and bicycle commuting, we modeled the maximum potential benefits of carsharing (see appendix B for details). Our method was simple. We identified neighborhoods nationwide where carsharing is likely to be feasible, using established criteria for where carsharing works and where it doesn’t.82 (We relaxed those criteria slightly to account for ongoing improvements to carsharing’s business models and efficiency that are increasing its reach.) Then we calculated the likely potential carsharing members in each of those neighborhoods, and estimated how many of their cars they would shed and how many fewer miles they would drive daily and annually once they join a carshare program.
In the United States, we estimate that carsharing could reduce nationwide vehicle ownership by nearly 2.1 million, or slightly more than 1 percent of the total number of vehicles in the United States in 2013, according to the Census Bureau. Academic research suggests that new carshare members would reduce their daily travel by 1.87 vehicle miles each over time, allowing us to calculate savings from congestion reduction, carbon emissions, and safety improvements.83
We project the potential annual savings from carsharing to reach a ceiling of $4.3 billion annually. These savings would come from different sources. Drivers who become carshare members would eventually save $1.4 billion in direct vehicle maintenance and upkeep costs as they reduce their own driving. Commuters nationwide would benefit from reduced congestion, avoiding $185 million worth of wasted fuel and $2.2 billion in time delay.
We project cities would save $366 million in annual deferred road construction costs, $77 million in accident avoidance, and $36 million in savings from almost 1 million metric tons of reduced carbon dioxide emissions.
As with real-time ridesharing and bike commuting, not all cities would benefit equally from carsharing. Figure 6 displays our estimates by metro area.

Figure 6 shows that the largest, most densely populated cities have the most to gain from increased carsharing. The New York City metro area could reduce its vehicle population by almost 3 percent if carsharing were fully implemented, and could potentially see carsharing membership as high as 13.2 percent of all commuters. VMT reductions from these new carsharers could lead to $1.4 billion in annual savings to New York City and its commuters, including $127 million in deferred annual road construction costs. Chicago, San Jose, San Francisco, Oakland, Washington, DC, Baltimore, and Boston are not far behind in their carsharing potential.
Figure 7 shows neighborhoods of the New York metropolitan area where carsharing is feasible, and where the predicted vehicle reductions from carsharing would be concentrated.

As figure 7 indicates, carsharing offers high potential benefits for cities such as Jersey City and Union City. Some New York-area cities are already moving in this direction. Hoboken rolled out its Corner Cars municipal carshare program in 2010 in partnership with Hertz, and saw immediate reductions in car ownership among members.84 White Plains, NY saw its first three Zipcar pods go live in 2012.85
Small college towns are fertile ground for vehicle reductions as well. Moscow, ID is a typical example of a college town with a high potential vehicle reduction from carsharing. For small towns in rural areas, carsharing’s most important benefit may be its role in attracting and retaining a young, educated workforce. A recent study of what makes communities desirable for Millennial workers found that 31 percent wanted a combination of trains, light rail, buses, carpooling, carsharing, ridesharing, bicycling, bike sharing, and walking as their primary ways of getting around. Between 23–39 percent of respondents, depending on where they lived, said they wanted their primary method of transportation in the future to be something other a personal car.86
Five ways to accelerate carsharing
- Assist providers with startup costs. The startup costs associated with launching a new carshare pod are considerable: the vehicles themselves, the associated technology, the acquisition of parking spaces, and the costs to market the new service. Normally, a new pod requires about six months to achieve financial viability.87Financial assistance from city governments and public transportation agencies can facilitate the expansion of carsharing to new locations where the market is not yet established. Such investments can offer attractive returns: Paris invested $47 million in its Autolib electric carsharing program in 2011, expecting that its investment would be returned through subscriptions by 2018. Recently, however, Autolib announced that the investment would be paid off in less than half of the time originally anticipated.88
- Build awareness of carsharing as a less-expensive alternative to car ownership. Transportation agencies can help market carsharing as one of a number of transportation alternatives available to their residents as part of a long-term strategy to build greater public awareness of multimodal options. Portland, ME, which leads the nation in declining vehicle ownership, has begun to market itself to young professionals as a city where living without a car is not only possible, but even preferable.89
- Provide public parking spaces for carshare vehicles. The rates carsharing providers pay for parking range from free (as dedicated spaces included in developments or other partnerships) to market prices. To facilitate the expansion of carsharing, cities could opt to discount the price for public parking or to provide spaces for free.90When compared with the cost of investing in other means of congestion reduction, such as expanding roadway infrastructure, some cities have found that making public parking spaces available for carshare vehicles yields a comparatively good return on investment. In 2012, for example, Washington, DC provided universal parking passes for 200 carshare vehicles to promote one-way carsharing in the District. The lost revenue from parking fees is offset by annual fees paid by the service provider.91A 2010 University of California at Los Angeles study found that the university’s cost per carsharing vehicle was $1,500 per year in user subsidies and lost parking revenue, but this could be offset by costs for building new parking structures, which were estimated at $37,030 per space, adjusted for inflation.92State and regional governments can help this trend by encouraging municipalities to include long-term social goods in their ROI calculations for carshare projects.
- Consider development requirements that support carsharing. Cities can encourage carsharing by requiring developers to include dedicated carshare spaces in new projects. Montgomery County, MD aims to nurture alternative transportation by giving developers a range of options concerning what parking they must include in new projects.93 A city councilor in Portland, ME—who himself does not own a car—stated in 2012 that Portland’s decision to reduce the number of parking spaces required for new developments has lowered development costs and increased the pace of new development.94
- Support carsharing through fleet sharing. State and local governments can support the expansion of carsharing in areas with a government presence by developing fleet-sharing agreements with commercial carshare providers. Government entities could save money by replacing a portion of their fleets with vehicles managed by a carshare provider. The guaranteed revenue provided by the agreement would, in turn, benefit carsharing providers by helping them cover the capital costs of expanding service in the area. These agreements could also even allow carshare vehicles to be used by private citizens members during non-business hours, when the demand for such vehicles is greatest.95
On-demand ride services: Disrupting and complementing taxi service
On-demand ride services (also called ridesourcing or ride-hailing services) like Uber, Lyft, and Sidecar are creating new business models and reshaping transportation markets by allowing private individuals to sell rides to eager customers.
Many issues concerning on-demand transportation are being widely debated today, from their potentially disruptive impact on taxicab companies to their impact on reducing drunk driving. Because our focus here is on congestion and economic benefits, we focus more narrowly on traffic reduction.
The market for on-demand rides is relatively new and evolving rapidly. Substantive studies of it are rare. We have nevertheless identified some general trends likely to affect the future paths of these service providers.
Uber’s and Lyft’s ridership rose rapidly during the past two years. One study sifted through Uber and Lyft transaction records to find 25 percent monthly growth in ridership at both firms at the beginning of 2013.96 That growth declined to a still-impressive 10 percent monthly rate by the beginning of 2014, however, and most analysts seem to agree that on-demand services face significant new headwinds as competition stiffens, markets become saturated, and calls for regulation increase.97
The US Census Bureau does not distinguish on-demand ride services from other transportation modes when it collects statistics about commuting patterns.98 The Bureau of Labor Statistics lumps Uber and Lyft drivers together with taxi drivers in its national surveys of employment and wages.99 Uber, however, has recently signaled a new openness to releasing trip data.100 As data from on-demand providers and government increase, we’ll get a better sense of how these services fit into the broader mobility ecosystem.
Estimating the economic potential of on-demand ride services
The release of several years of complete data on New York City cab rides offers the possibility that, in the near future, we will be able to calculate nationwide potential economic benefits of on-demand car services to the extent that such services substitute shared rides for some taxi trips.
Further data will be needed, however. On-demand ride service providers recently began piloting programs that allow customers traveling similar routes to link up and share their ride.101 Uber estimates that such pooled services could remove up to a million vehicles from New York City streets, although the company has not specified its methodology.102
A recent study of New York City cab trips found that cumulative trip length could be cut by 30 percent with little inconvenience if passengers were willing to share their trip with another passenger traveling the same way.103 Another study found the average length of a trip in San Francisco in 2008 was just 4.2 kilometers.104 Yet another study counted taxi rides in New York City and found that passengers logged 3.4 million trips per week, while a separate dataset recorded 173 million trips in the city between January and December 2013, with an average distance of 8.3 miles.105
Such findings allow us to estimate that, if on-demand ride service providers could facilitate trip sharing for 30 percent of New York City’s trips, the total number of trips would be reduced by almost 52 million a year, leading to a rough estimate of 431.2 million VMT eliminated. A reduction of that magnitude implies congestion savings to commuters of $495 million annually with 14 million hours in delay saved, and infrastructure savings to New York City of $959 million on road construction over 25 years. We further estimate a 139 thousand-metric-ton annual reduction in carbon dioxide emissions and 350 fewer annual traffic accidents.
It’s worth noting that this estimate does not take into account the potential congestion reductions that would come from lower car ownership due to increased mobility provided by on-demand ride services. We await empirical studies of the magnitude of this effect.
Seven ways to increase the public value of on-demand ride services
- Ensure that government data collection captures on-demand services. If national economic and transportation data collection programs captured distinctions about on-demand ride services, it would be far easier to understand their benefits and potential downsides. For example, the Census Bureau could include on-demand ride services as one of the options for journey-to-work questions in its American Community Survey. The Bureau of Labor Statistics could include on-demand ride services in relevant surveys on employment and wages, while the Federal Highway Administration could include similar categories in its National Household Travel Survey. Specific information in these national datasets would greatly aid transportation planners in assessing the impact of on-demand ride services.
- Encourage cities to release taxi trip and fare data online. New York City’s decision to release a year’s worth of taxi trip data in response to a Freedom of Information Act request set off a flurry of research activity that allowed for real progress in charting the potential benefits of shared transportation.106 Now imagine that all of the nation’s major cities posted anonymized taxi trip data on an open portal. The benefits to transportation research and planning would be enormous. Encouraging private providers to open up their trip data, as Uber has done in Boston, would confer additional benefits.
- Support pilot partnerships between government agencies and on-demand mobility providers. These projects could test whether the purchase of mobility services from on-demand providers could help government achieve mobility equity and access at a lower cost.Many cities provide wheelchair-accessible “paratransit” services to their residents. Several others, including Atlanta, considered outsourcing paratransit in 2014, although concerns were raised about the reliability and quality of private providers.107 Wait times for paratransit often exceed one hour, according to the Disability Rights Education and Defense Fund.108 Both private and public paratransit operators suffer from high turnover rates, inadequate compensation, and low morale, according to a study by the Transportation Research Board.109Cities should consider whether purchasing on-demand mobility services from the private sector can fill this same need more reliably and less expensively. Helsinki’s long-range transportation plan includes such a provision.110 In 2014, Uber launched a similar pilot program in Chicago, including having third-party-owned wheelchair-accessible cabs in its ride dispatching service.111
- Fund studies and pilots to determine the optimal position of on-demand ride services within mobility ecosystems. Adding on-demand ride services to the list of priority topics for major transportation-related research grants would help researchers answer basic questions about how on-demand ride services can function most efficiently within a robust multimodal system.
- Enlist private partners to achieve ridesharing targets. As discussed earlier, governments should explore partnerships that leverage the reach of companies such as Uber and Lyft to further the policy goal of increasing ridesharing. Many cities already partner with carsharing companies, allowing them unlimited on-street parking at meters in exchange for a yearly payment. Helsinki’s long-range transportation plan envisions the city purchasing transportation from providers such as on-demand ride service providers, and then offering that service while allowing citizens to do the same using their own vehicles.112
- Contract with on-demand ride services to provide guaranteed rides home. Governments should consider partnering with on-demand ride service providers to operate guaranteed-ride-home programs, if doing so could improve service while marketing the program’s existence more effectively.
- Craft thoughtful regulation to encourage the spread of on-demand mobility. Public officials are beginning to look for ways to legitimize on-demand ride services. In September 2013, for instance, California’s Public Utilities Commission unanimously authorized peer-to-peer transportation in the state, assigning a new legal label—transportation network companies, or TNCs—to distinguish these vehicles from taxis.113 TNC companies and community members worked with regulators for months leading up to the decision, clarifying business practices while ensuring safety and quality service.
Expanding mobility ecosystems by reconsidering transportation investments
Innovations within the transportation sector are being driven by the growing recognition that cars, once synonymous with freedom and mobility, have become victims of their own success. Today, traffic congestion limits and undermines mobility in metro areas across America and the world, imposing huge costs on individuals and society as a whole.
The basic problem confronting transportation planners is that adding new infrastructure to relieve congestion is a notoriously slow and costly process. This doesn’t mean that new roads, bridges, and tunnels aren’t needed in America—they are. However, given environmental issues, land acquisition, permits, eminent domain issues, and construction, such projects can take years, if not decades, to go from conception to delivery.
The arrival and increasing popularity of dynamic, smart mobility services offer promising new possibilities for making more efficient use of existing infrastructure. At a fraction of the cost of new roads, smart mobility ecosystems can help reduce gridlock, lower accident rates, improve air quality, and shrink the urban footprint required for parking.
A whole menu of services and transportation modes is becoming available to cities willing to use them to tackle congestion and access problems. Carsharing works best in dense urban cores. On-demand ride services are most effective in extending taxi service to underserved city areas. Ridesharing can often provide the greatest returns in a ring 10 to15 miles outside the city center. Bike commuting typically offers the greatest benefits in neighborhoods within the urban core and in clusters around suburban commercial centers.
We’ve shown how transportation agencies and governments can encourage each of these options. Cultivating and expanding smart mobility ecosystems will require us to rethink our transportation investments, shifting our focus from simply maximizing vehicle throughput to moving users as efficiently as possible through any of a variety of modes.
Appendix A: Four modes of alternative mobility defined
- Ridesharing (including carpooling, vanpooling, and real-time or “dynamic” ridesharing services): Classic ridesharing is simply what an earlier generation called the carpool: two or more travelers sharing common, pre-planned trips made by private automobile or van. In recent years, thanks to GPS and mobile technologies as well as managed high-occupancy lanes, ridesharing has evolved into a dynamic service that can match drivers with riders in real time without advance planning. This ride-matching process is conducted through mobile apps that connect drivers with passengers traveling similar routes, in real time, at pre-designated pickup locations (commonly called casual carpooling or “slugging”).
- Bike commuting: Bike commuting refers to trips made to work by bicycle.
- Carsharing (round-trip, one-way, and personal vehicle sharing): In its most basic form, carsharing is car rental by the hour. Providers include commercial entities (such as car2go, Zipcar and DriveNow) as well as private individuals who rent out their own vehicles through peer-to-peer carsharing programs. These services give consumers all the benefits of car ownership without its attendant costs, including purchase cost, insurance, maintenance, and parking.
- On-demand ride services, called ridesourcing or ride hailing services: These are online platforms developed by transportation network companies (such as Uber, Lyft, and SideCar) that allow passengers to “source” or “hail” rides from a pool of drivers that use their personal vehicles.
Appendix B: Methodologies used in estimating economic benefits of alternative mobility modes
Increasing ridesharing, bike commuting, and carsharing will result in substantial economic savings for commuters as well as cities. Commuters would realize direct savings from lower vehicle operating costs, and they would also benefit from reduced time delays and fuel wastage. Cities would save on the infrastructure costs associated with constructing roads to handle increases in congestion. Cities would also benefit from fewer road accidents and lower carbon emissions. Our general methodology for calculating different types of savings is shown in figure 8 and described in detail below.

Units of analysis
Our calculations of alternative mobility savings use two different units to represent metro areas: Combined Statistical Areas (CSAs) and Metropolitan Statistical Areas (MSAs), both defined by the Office of Management and Budget in 2013.114 CSAs are the units most often used by transportation planners to capture regional transportation phenomena. To the list of 166 (excluding Puerto Rico) CSAs delineated by the OMB, we added the five largest additional prominent metropolitan statistical areas (MSAs) that were not classified as CSAs: Phoenix-Mesa, AZ; Richmond, VA; San Antonio, TX; San Diego, CA; and Tampa, FL. The result is our list of 171 metro areas, which we use to calculate national totals for urban and suburban commuters and which cover approximately 77 percent of the 2013 total population of the United States.
Metropolitan Statistical Areas (MSAs) are generally slightly smaller than CSAs and are useful for comparing metro areas to one another. We analyzed the top 99 largest MSAs by 2013 population to derive city rankings.
We use GIS tools to aggregate commuting and other demographic information from the census tracts within each CSA or MSA. We then calculate the projected new members and expected reduction in vehicle miles traveled (VMT) for each of the alternative modes of transportation as described below.
Potential new ridesharers and projected VMT savings from ridesharing
To calculate potential new ridesharers and projected VMT savings from ridesharing, we use the 2006–2010 Census Transportation Planning Products (CTPP), which reports commuter flows from all census tracts to every other. We also use the 2012 American Community Survey (ACS) five-year estimates—specifically, the questions from Tables B08301 and B08302 on transportation mode and departure time for the journey to work. We combine these two sources of data to estimate the number of pairs of commuters in the tract that are travelling to the same other tract, leave for work within 30 minutes of one another, and live one mile or less from one another.115 The one-mile trip deviation constraint and the 30-minute constraint on joint time of departure for work follow Amey (2010).116
- For each census tract, we start with the number of tract residents who work in every other census tract (workplace/destination) from CTPP.
- We multiply this commuter flow by the ACS estimate of the proportion of the tract commuting by car, truck, or van, yielding an estimate of the number of car/truck/van commuters between the residence and workplace.
- For each 30-minute time slot between 5 a.m. and 10 a.m., we multiply the estimated tract-tract car/truck/van commuters by the ACS estimate of the proportion of tract commuters who leave for work during that time slot, yielding an estimate of the expected number of pairs of commuters from that tract who work in the same tract, drive to work, and leave within 30 minutes of each other.
- We multiply each of these estimates by a factor for the estimated residential density of the tract to identify the number of expected pairs of drivers who meet the conditions in step 3 above and are likely to live within one mile of each other. For simplicity’s sake, we assume a uniform random spatial distribution of residences throughout the tract, which is certainly false. But because the tracts are small, located in or near urban areas, and densely populated, this assumption should not seriously bias our estimates.
- We sum the results for all departure time slots and destination tracts, and then subtract the current carpoolers as reported in the 2012 ACS to yield the total potential new carpoolers for the census tract.
- Because trip chaining (stopping along the way to or from work to carry out other business) has been shown to affect propensity to carpool, we reduce our estimate of new carpoolers by 16 percent. The most recent National Household Transportation Survey found that, nationwide, 84 percent of tours from home to work or work to home had no stops, while 16 percent included trip chaining.
- For each pair of residence-tract and workplace-tract, we also sum the intercentroid distance, multiply by the number of expected new ridesharers, and divide the result by two (assuming a two-person carpool) to calculate the expected reduction in VMT if those individuals begin ridesharing.
- Finally, we multiply projected morning VMT reductions by 1.76 to estimate the daily (morning + afternoon) projected VMT reductions for ridesharing. We derive the 76 percent factor for afternoon ridesharing from the 2009 National Household Transportation Survey, a nationally representative survey of commuting patterns. In that survey, 76 percent of commuters who carpooled in the morning also carpooled in the afternoon.
Projected new bike commuters and VMT savings from bike commuting
To calculate potential new bike commuters and projected VMT savings, we also use the 2006–2010 CTPP and the ACS 2012 five-year estimates—specifically, the questions from table B08301 on transportation mode.
- For each census tract, we find the CTPP estimate of number of commuters who work in census tracts five miles away or closer to their homes.
- We multiply this number by the proportion of commuters in that tract who drive to work, using ACS. This gives us an estimate of the number of current drivers who could reasonably bike from the residence tract to the workplace tract given perfect infrastructure.
- We then subtract an estimate of the number of commuters between those two tracts who currently bike to work.
- Because commuters who make stops on their way to and from work are less likely to bike to work, we reduce our projection of new bike commuters by 16 percent. (The most recent National Household Transportation Survey found that 16 percent of home-to-work or work-to-home tours included stops.)
- We sum this estimate for all workplace (destination) tracts, yielding our estimate of the number of potential new bike commuters living within each tract.
- We also sum up the intercentroid distances between the residence and workplace tracts to yield the expected daily reduction in VMT if all the potential new bike commuters switched to that transportation mode.
- Following recent studies on the determinants and frequency of bike commuting in America, we assume that each new bike commuter will commute 96 days per year by bike—the median value in a survey of bike commuters in Vermont in 2012, and hence a conservative estimate of seasonal and weather-related effects on bike commuting frequency.117
Potential new carshare members and projected VMT savings from carsharing
We calculate potential new carshare members and projected VMT reductions from increased carsharing using a three-stage process. First, we identify census tracts nationwide where carsharing is feasible. Then, we estimate the potential maximum number of new carshare members in those neighborhoods. Finally, we estimate the likely reduction in VMT for the new carshare members.
- To identify neighborhoods where carsharing is feasible, we rely on a body of academic research which finds that carsharing is likely to succeed in neighborhoods with high residential density and good existing transit options, as well as on university campuses.118 The same body of research identifies demographic patterns that correlate with carsharing operations, including higher-than-average educational attainment, a high percentage of renters, a high percentage of one-person households, high transit use, and a low percentage of households with children. We therefore use GIS tools to select census tracts that either 1) contain a college or university or 2) match the demographic profile, commuter mode share, vehicle ownership rates, and neighborhood physical characteristics identified by the Transportation Research Board as supporting successful carsharing operations. We classify all such selected census tracts as feasible for carsharing.119 Together, these criteria yield a total of 4,098 out of 74,001 census tracts where carsharing should be feasible.
- We then estimate the maximum reasonable number of residents of those tracts who could participate in carsharing. We apply the findings from the 2014 Deloitte Mobility Survey, which found that 42 percent of individuals in Generation Y or younger report they are willing to join a carsharing or carpooling program, compared with 28 percent willingness among older generations.120 We apply a national age profile from ACS assuming that 38 percent of householders are aged 44 or younger, and 62 percent are older than 44. This yields two estimates of the number of potential carshare members: those in Generation Y or younger, and those among older individuals. We add these estimates to yield the total projected carshare members for the tract.
- Finally, we generalize the results of Cervero, Golub, and Nee (2005), who finds that carsharing members in the San Francisco Bay area over four years reduced their total daily VMT by 1.87 miles.121 We multiply this by the projected number of new carshare members to yield a total daily VMT reduction for the tract, and corresponding annual reductions assuming 365 potential travel days.
Calculating personal savings and congestion reduction savings from VMT reductions
Below, we describe how we calculate each component of the mobility savings in figure 8 from the projected VMT reductions.
Car operating costs saved. Commuters who drive their personal vehicles less can expect savings in expenses like maintenance, gas, oil changes, parking, and toll charges. To calculate personal savings to commuters who switch to ridesharing, bike commuting, or carsharing, we use the Internal Revenue Service 2015 reimbursement schedule for the average cost of operating a personal vehicle for a work commute: 56 cents per vehicle-mile.
Time delay saved. If many commuters switch to alternative modes of transportation, then overall congestion is expected to decrease and all commuters will save time. We estimate these time savings by fitting a regression model to the city-level congestion results provided by the Texas Transportation Institute’s (TTI’s) 2012 urban mobility report. We model TTI’s reported time delay per commuter (Y) as a function of VMT per commuter and dummies for CSA or MSA population size group—categorized as small (< 0.5 million population), medium (0.5–1 million), large (1–3 million), and very large (> 3 million). The regression results shown in figure 9 indicate that all variables are significant and explain 63 percent variance of the dependent variable. The model accuracy of 82 percent is fair. In the model, delay rises by 1.1 hours as average VMT per commuter rises by two miles.
We assign a dollar value to the time delay saved using a national average wage of $16.79, following TTI’s methodology.122

Fuel saved. If commuters in a city waste less time idling in traffic, they will waste correspondingly less fuel. We again model the results presented in the TTI 2012 urban mobility report to estimate how much fuel would be saved if commuters wasted less time stuck in traffic. TTI city-level figures for fuel consumption per commuter in gallons (Y) is estimated by regressing it against delay per commuter in hours. The regression result shows a strong model fit with adjusted R-squared of 91 percent and model accuracy of 92 percent.
The dollar value of fuel saved is obtained using the average gas price by CSA or MSA from the Bureau of Labor Statistics Current Prices Index.123

Calculating carbon emissions savings from VMT reductions
Carbon emissions reduced. We estimate carbon dioxide emissions reductions using standard carbon emissions factors published by the World Resources Institute.124 For bike commuting and carsharing, we multiply the expected reduction in VMT by the standard WRI emissions factor for passenger vehicles, 0.38420902 kilograms of CO2 per VMT, assuming 3 percent diesel fuel vehicles. For ridesharing, we use the same WRI emissions factor but reduce it slightly to account for the additional weight of the passenger in the carpool car, which reduces its efficiency slightly. Accordingly, we use the WRI emissions factor for freight, 0.297 kilograms CO2/short ton mile, assuming an average passenger weight of .075 short tons. We also assume 10 percent extra distance for the trip overall to pick up the passenger and reduce our estimate of VMT savings accordingly. To calculate the overall societal savings from reduced carbon dioxide emissions, we use the Office of Management and Budget estimate of $37 per metric ton of CO2.125
Calculating accident reductions from VMT reductions
Road accidents reduced. Taking cars off the road means reducing the number of traffic accidents. A nationwide federal study of accidents found an average of 0.8114 accidents per million vehicle-miles traveled, with the following distribution of accident types:126

A separate study by the National Safety Council found that the average economic cost of traffic accidents in 2012 was $1,410,000 for fatal crashes, $78,900 for non-fatal injury crashes, and $8,900 for property damage-only crashes.127 We apply these accident rates and savings projections to our VMT reduction projections to yield the expected reduction in traffic accidents and associated cost savings. We recognize that the dollar value of savings reported here somewhat underestimates the comprehensive value that individuals are willing to pay to preserve their life and health.
Calculating road construction and maintenance savings from VMT reductions
Road construction cost saved. Removing cars from the road by reducing VMT will generate savings for cities by allowing them to avoid road construction costs. A recent study by the Reason Foundation estimates the cost of providing additional road capacity to relieve severe congestion. The study predicts the travel time index will increase by 65 percent in very large cities over 25 years. To relieve severe congestion in America’s 403 urban areas, 104,000 lane-miles of capacity will be needed at a cost of $533 billion over 25 years, or $21 billion per year. Translating those estimates into infrastructure costs per hour of congestion delay yields $2.76 as the cost to address an hour of delay.128 We multiply this factor by the expected reduction in delay per commuter by the number of commuters to arrive at city-level estimates of infrastructure savings.
Explore our collection of research on smart mobility at the links below.
- Key findings from the smart mobility study
- The promise of smart mobility
- Ridesharing
- Bike commuting
- Carsharing
- On-demand ride services
- Alternative transportation atlas (interactive map)
- Impact by metropolitan area (interactive table)
- FULL REPORT—Smart mobility: Reducing congestion and fostering faster, greener, and cheaper transportation options
© 2021. See Terms of Use for more information.
