Income inequality takes a step back as compensation rises for a changing workforce
Employee earnings have gone up sharply after 2020 while more businesses are ramping up their contributions to employee benefits.


Strong growth in employment and wages has been a defining feature of the US labor market over the last two years.1 It has perturbed the Fed, because without a weakening of the labor market, and therefore the economy, monetary policy loses its power to bring down inflation.2 Jobs growth in the economy is still strong—about 260,000 per month on average this year—and unemployment is low at 3.8% despite 525-basis-point policy rate hikes since March 2022.3 Nevertheless, what may be worrisome to the Fed is welcome news to many workers since wages are also rising at a fast pace: Average hourly earnings are up 4.4% year over year so far in 2023, following a 5.3% annual rise last year. Contrast this to just 2.4% average annual growth in 2010–2019. Employer-provided benefits are also expanding fast, a trend that intensified after the pandemic. Businesses are not only offering higher wages to attract workers; they are also increasing their contributions to employee benefits such as health insurance and paid leave.
Demand-driven shifts in the workforce and supply conditions are increasingly impacting relative wages across occupations and distribution of employer-sponsored benefits. For example, the share of high-wage occupations (for more on this, see Appendix, “Accounting for employment by occupation is different from accounting for employment by industry”) in total employment in the economy has gone steadily to 26.1% in 2022 from 19.9% in 1999. This increase in share has come from the reducing of the share of low-wage occupations—the proportion of median-wage jobs has remained constant. Wages, however, are following a trend different from employment. Median hourly wages have increased at a faster pace for low-wage occupations since the last decade compared to their high- and medium-wage counterparts. This trend intensified after 2020, due to difficulties in finding workers to fill the job openings in low-wage occupations, particularly those in the contact-intensive sectors that bore the brunt of COVID-19. Benefits too have been growing faster for low-wage occupations. With low-wage earners enjoying faster growth in wages and benefits than others, inequality has lessened—not only on the income side, but also from a standard-of-living perspective as more people receive benefits from their employers compared to two decades back.
Composition of the workforce has changed
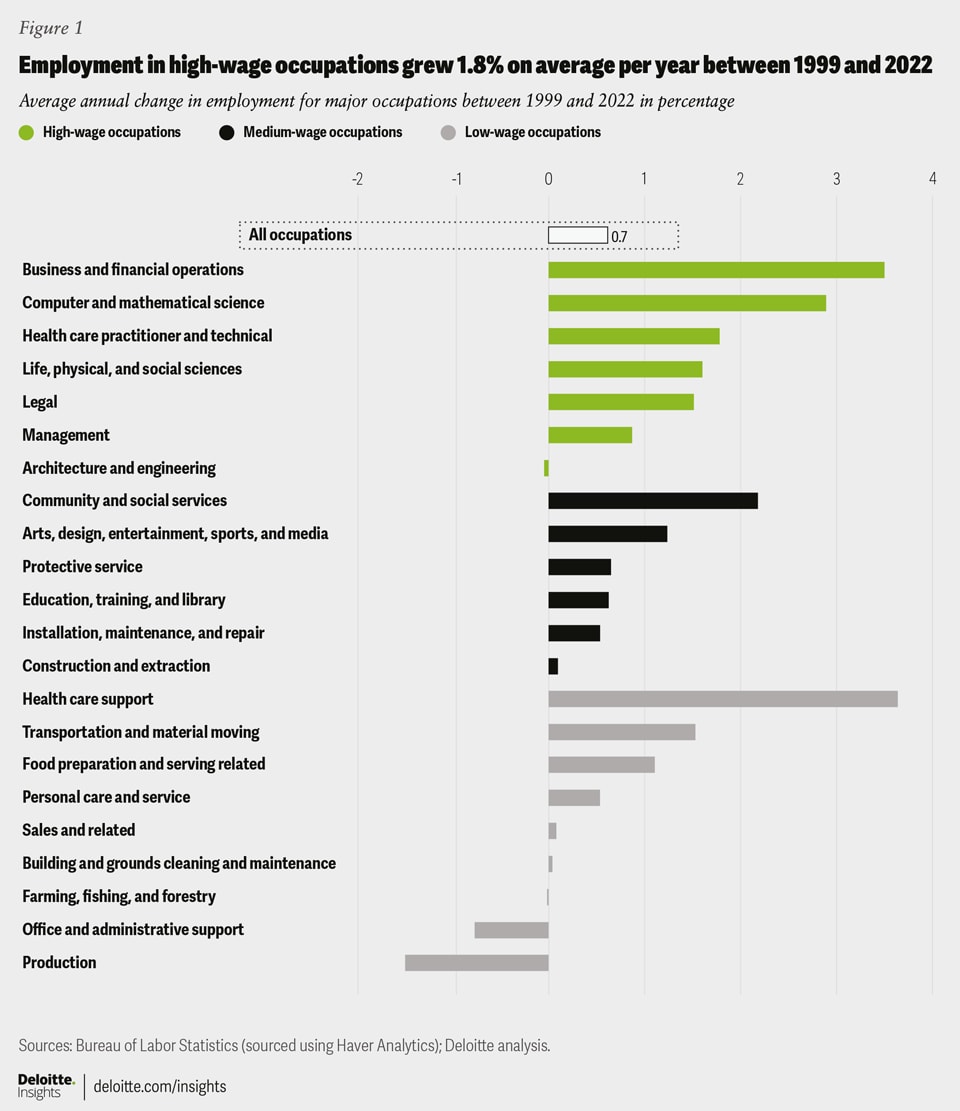
The American workforce today is different from what it was two decades ago. According to the Occupational Employment and Wage Statistics program, between 1999 and 2022, employment in high-wage occupations grew at an average annual rate of 1.8%, much higher than the corresponding rise in medium- (0.6%) and low-wage occupations (0.2%). Consequently, the share of high-wage occupations in total employment in the economy has gone up steadily, while the proportion of low-wage ones has declined; the share of medium-wage occupations has remained relatively flat over this period. Within high-wage occupations, employment in six out of seven occupations witnessed faster rates of growth than overall employment during 1999–2022 (figure 1). Contrast this to the low-wage category where only three occupations had higher rates of growth than the national average. In fact, employment fell over this period for three low-wage occupations—office and administrative support; production; and farming, fishing, and forestry.
Because it covers a longer period, figure 1, however, doesn’t fully reveal the impact of the onset of COVID-19 in 2020 on low-wage occupations. Employment in food preparation and serving, for example, almost halved between February and April 2020, while employment in personal care fell 44.1%. Overall, total employment in low-wage occupations fell 22.2% during this two-month period, much worse than the 5.1% decline in high-wage occupations. While things started improving after May 2020, the recovery was uneven. Sectors such as professional services, which mostly employ high-wage occupations, could easily shift to remote work compared to food services and drinking places that mostly employ low-wage workers. By the end of December 2022, employment in low-wage occupations was still 3.9% lower than prepandemic levels; in contrast, employment was up 4.4% for high-wage and 0.6% for medium-wage occupations. Hence, the share of low-wage occupations in total employment fell significantly between 2020 and 2022.

Wages have been rising faster for low-wage wage occupations
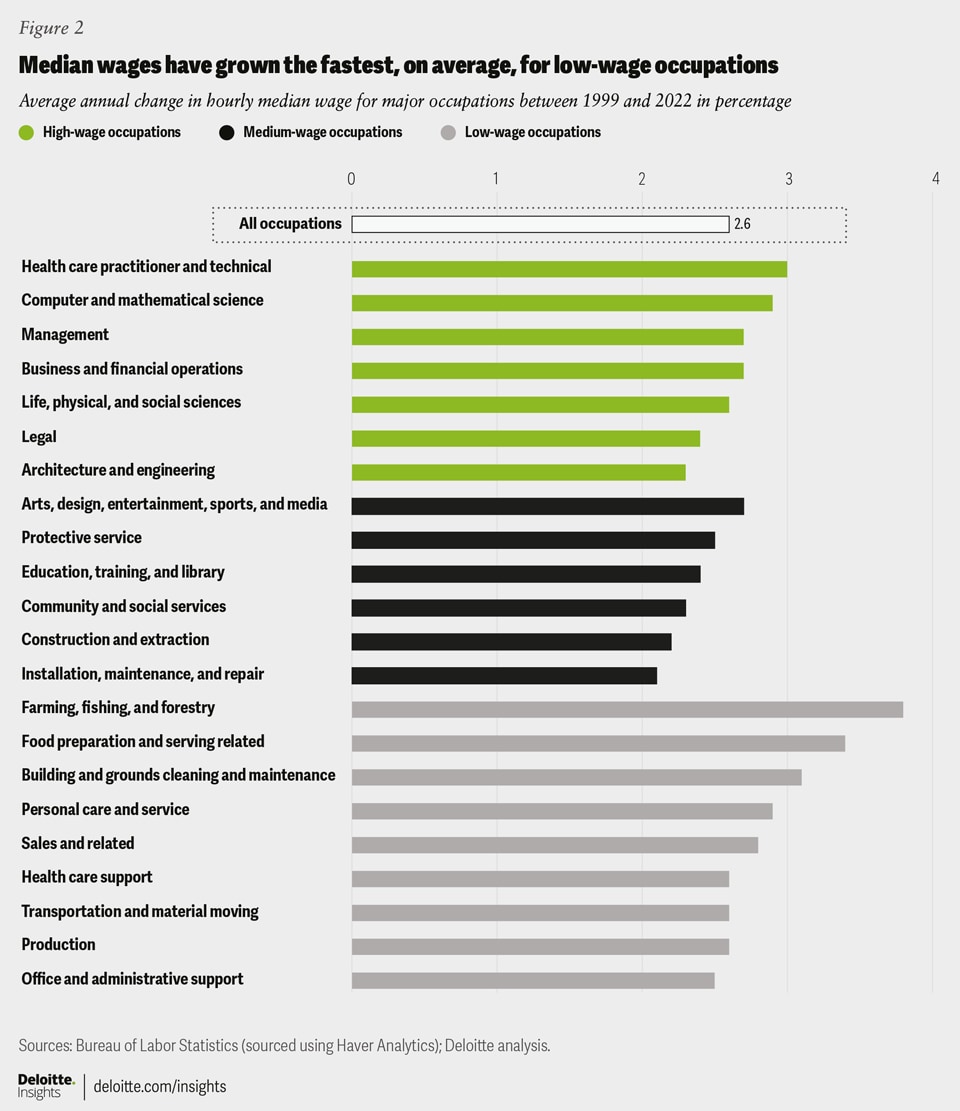
Although low-wage occupations’ share in the workforce has been declining, their wages have been rising at a faster pace than that for high- and medium-wage occupations since the middle of the last decade. Between 1999 and 2022, wages have grown the fastest for farming, fishing, and forestry; and food preparation and serving—two occupations with the lowest median wage (figure 2).
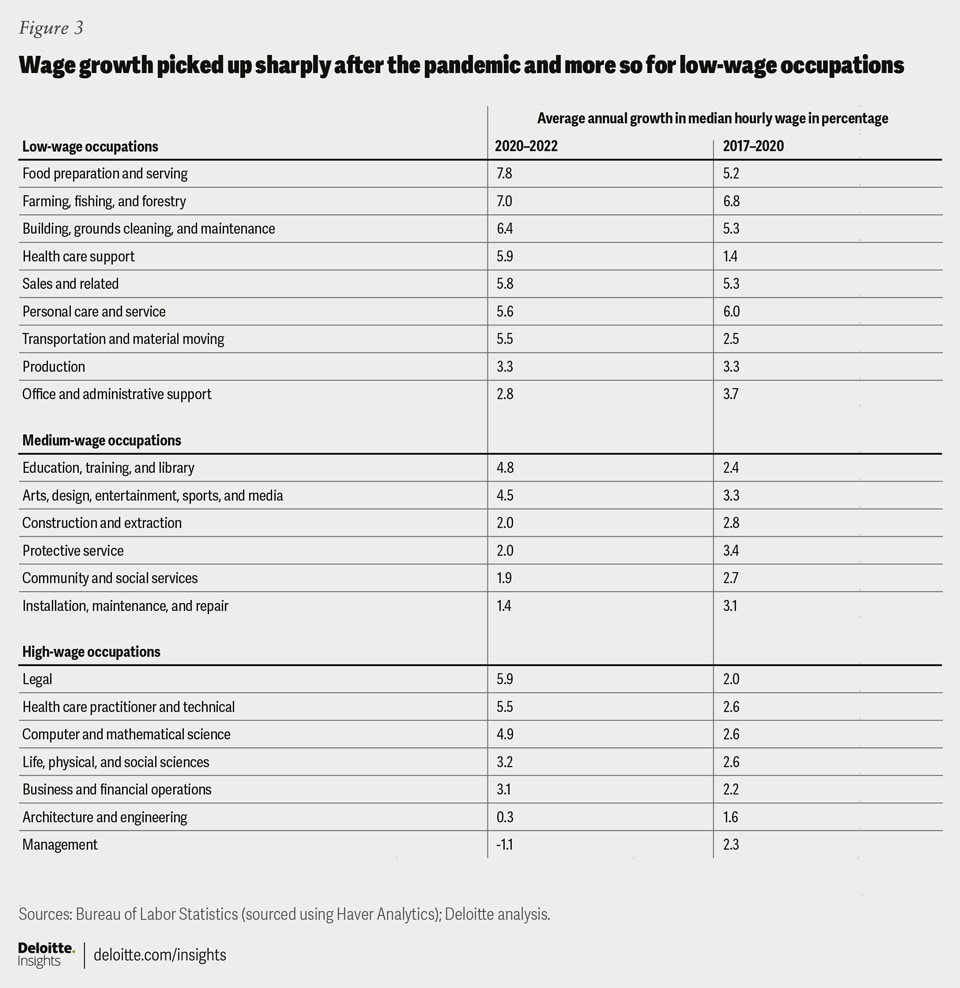
Figure 2, however, hides the variation in wage trends within this 23-year period. Between 1999 and 2009, it was high-wage occupations that were driving wage increases. Hourly median wage for management occupations, for example, grew 4.5% on average per year during this early period, much higher than the fastest growth for low-wage occupations, which was 3% (for production). Things started changing in 2010. First, average annual wage growth slowed for all occupations, before picking up pace in the latter part of that decade. This time around, it was low-wage occupations whose wages grew the fastest. This rise in pace intensified after 2020 with low-wage occupations again leading others (figure 3).
What’s behind the sharp rise in wages for low-wage employees after the pandemic? The primary reason is that the pool of potential workers shrank and remained lower than prepandemic levels even as business hiring demand returned. For example, the labor force participation of those with only a high school diploma—an important source of workers for many low-wage jobs—dropped from over 58% to 55.5% during the two years following April 2020.4 Even though the participation rate has gone up since then, it has been hovering around 56.5% since the beginning of 2022, lower than prepandemic levels. We should note that labor force participation for this group has been on a long-term downward trend, indicating that supply-related issues been a force supporting the broad increase in wage growth for low-wage occupations over the years.


Figures 2 and 3 show a few deviations from the dominant trends. First, some high-wage occupations have also enjoyed healthy wage growth. Second, wages are not growing strongly for all low-wage occupations.
A good example of fast-growing wages in high-wage occupations is computer and mathematical science. This occupation accounts for more than 80% of the tech workforce.5 That’s hardly surprising given proliferation of technology, rapid digitization, expansive use of data analytics, and exploration of new technologies such as generative AI. The pandemic, in fact, has given a further boost to such changes as firms scrambled to adjust to remote work, thereby increasing demand for computer and mathematical science skills.
In contrast, employment in office and administrative support—a low-wage occupation—has been on a downward trend for decades. It fell at an average annual rate of 0.8% in 1999–2022. Not surprisingly, a key reason behind this is technological advancement, which has reduced office and administrative workload. Wage growth in this occupation, therefore, hasn’t been high compared to other low-wage occupations.
Employers are adding benefits in addition to increasing wages to attract workers
In addition to higher wages, employers have steadily increased benefits to lure workers. Data from the BLS’s employment cost index (ECI) suggests that employer benefits offered to workers—defined as paid leave, supplemental pay, insurance, retirement and savings, and legally required benefits—have gone up since the middle of the last decade as firms strive to increase employee productivity and organizational performance.
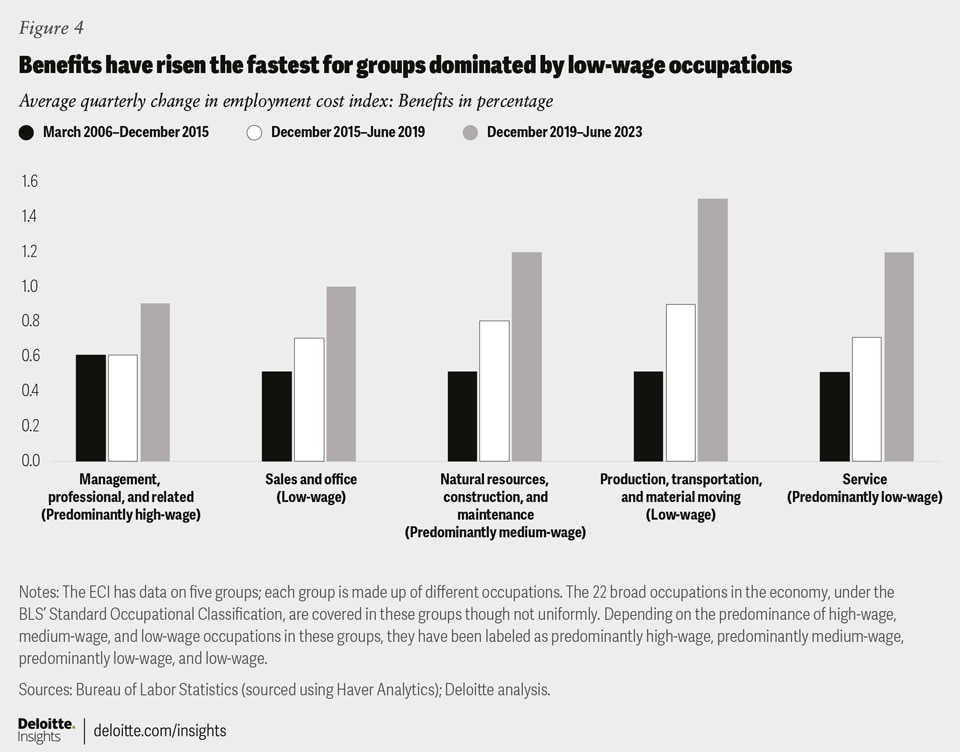
The pandemic further accelerated this trend. Benefits as measured in the ECI grew 1.1% per quarter on average between December 2019 and June 2023, higher than the corresponding 0.7% rise in the four years till December 2019. The proportion of workers receiving access to retirement benefits went up to 70% from 67% in the three years to March 2023, while the share of those with access to health benefits increased to 72% from 69%. Access to paid sick leave grew as well during this period by 3 percentage points to 78%. These increases weren’t seen just for full-time employees; part-time workers too made gains, but although the benefits gap has narrowed with their full-time counterparts, it remains wide.6
Figure 4 shows a trend similar to that for wages: Low-wage occupations have experienced faster growth in benefits than high-wage ones since about 2015 with the pace increasing after 2020.

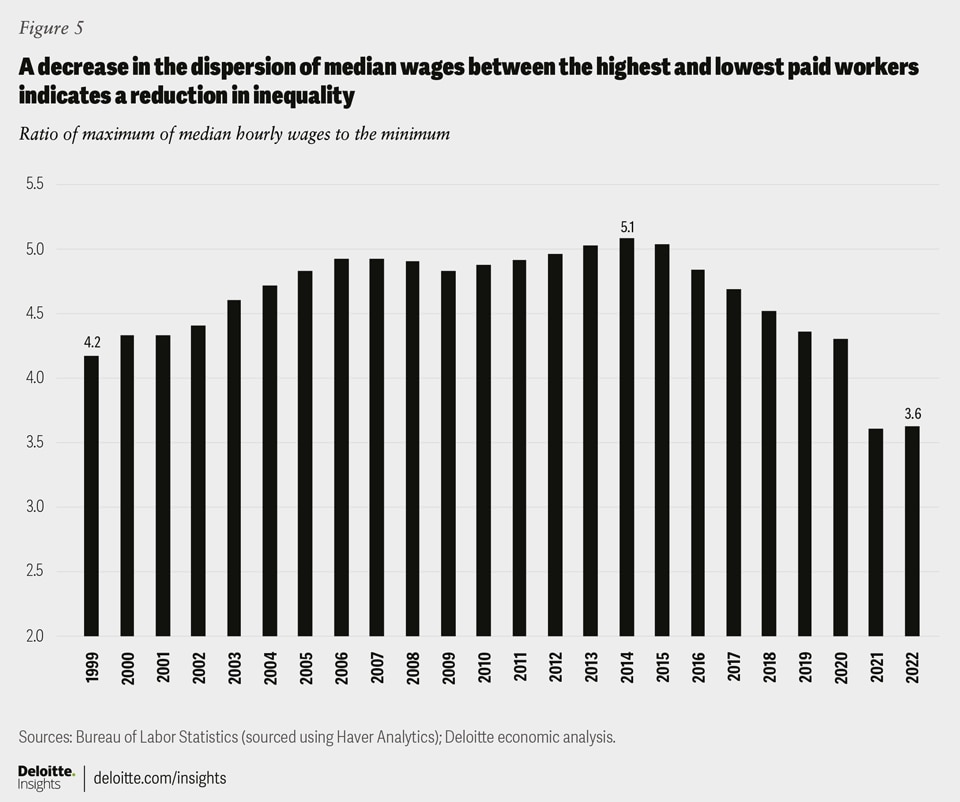
The net result has been a lessening of income inequality
As low-wage occupations have seen a higher rise in wages and benefits than others, income inequality has come down. The ratio of the highest median hourly wage to the lowest—a measure of income inequality—has declined steadily since 2014 as wage growth picked up for low-wage occupations, with the decrease in inequality being particularly striking in 2021 and 2022 (figure 5). Over this period, the ratio of the 75th percentile of wages with the bottom 25—a measure of within-occupation inequality—also fell for most occupations other than some high-wage ones (computer and mathematical science; architecture and engineering; health care practitioner and technical; and life, physical, and social science).

While not directly addressing income inequality, the lessening of the skewing of employer costs for the provision of benefits from higher-paid occupations toward lower-paid occupations does improve living standards. Having more employers contribute to their employees’ retirement and health care and by providing benefits such as paid leave and disability insurance go a long way to increasing income security.
The impetus leading to rising wages is insufficient supply to meet demand. This is illustrated by the example of the declining numbers of workers and potential workers without a college degree needed to fill lower-wage jobs. This shortage is causing those wages to rise more rapidly compared to the past. Similarly, the high wage increases going to specific highly skilled groups such as tech workers are in response to businesses striving to meet their growing needs amid inadequate supply. The occupational aggregates discussed in this article mask a host of differently moving trends underlying the topline numbers—for example, the demand for some tech skills falls out of favor, while for others (think generative AI) the demand appears to increase exponentially. From a societal standpoint, these shifts might be heading us in a good direction.
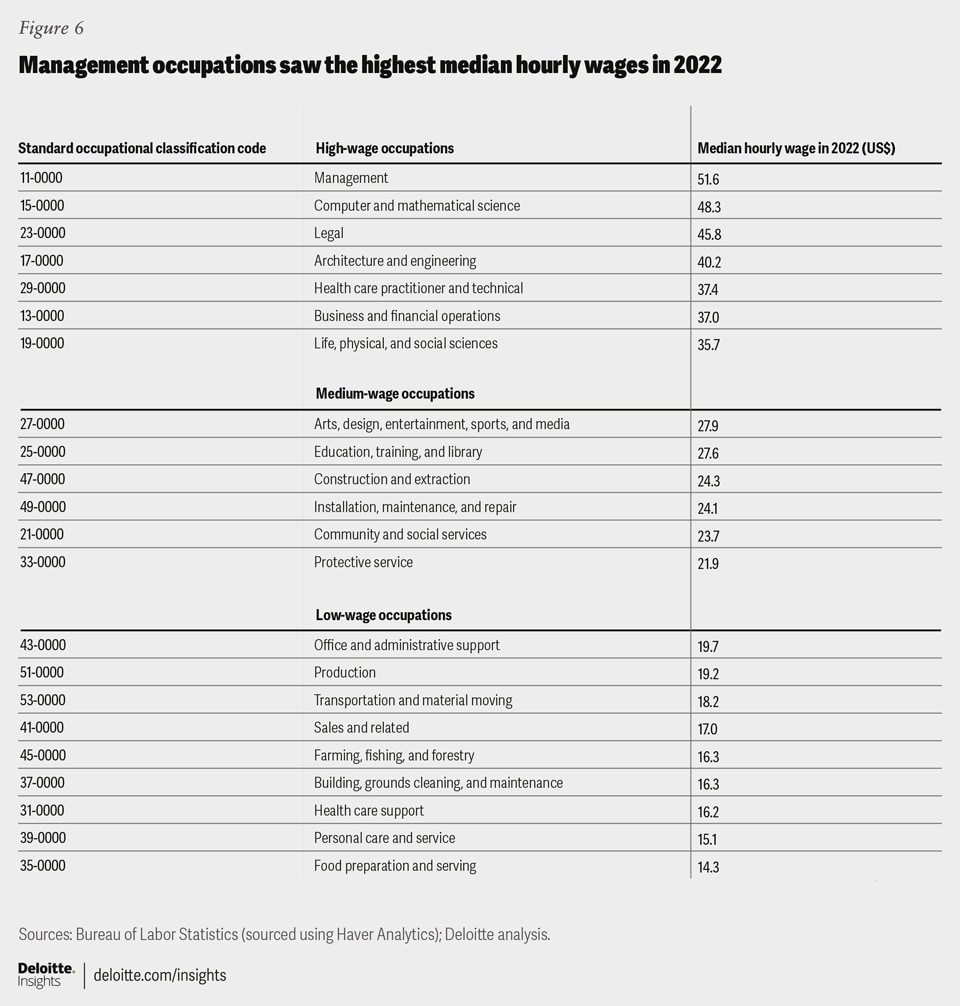
Appendix: Accounting for employment by occupation is different from accounting for employment by industry
The Occupational Employment and Wage Statistics from the Bureau of Labor Statistics have annual data on employment and wages for 22 broad occupations—and suboccupations within each of them—in the economy. These occupations are defined using the Standard Occupational Classification (SOC). Based on the hourly median wage of each of these 22 occupations from 1999 to 2022, we classified them as high-wage, medium-wage, or low-wage occupations. The figure below lists all these occupations and their hourly median wage in 2022.


