


The US housing market recovery: The past is not prologue has been saved

The US housing market recovery: The past is not prologue Issues by the Numbers, November 2016
16 November 2016
Amid a general housing market recovery, two counterintuitive trends stand out: Homeownership rates are declining, and new construction is more heavily weighted toward multifamily homes. If they continue, these trends could influence policy discussions on topics as diverse as tax reform and transportation planning.
Introduction
It’s been seven years since the end of the Great Recession. The economy has picked up pace, the labor market is strong, and the Federal Reserve (Fed) is on the verge of raising rates again. Amid these positive signs, it may seem odd at first that the housing sector is on a slower recovery path. In the heyday of 2005–2006, the sector contributed, on average, 33.4 percent to nominal fixed investment in the economy and 6.3 percent to nominal gross domestic product (GDP). Those figures fell sharply after 2008 before edging up to 23.3 percent and 3.8 percent, respectively, this year, still lower than the average for the last 35 years. The failure of these figures to reach pre-recession levels, however, is likely due more to the scale of the housing bubble leading up to the Great Recession than to an unnaturally slow pace of recovery.
Learn More
View the related infographic.
Notwithstanding the housing sector’s declining prominence in the economy, key indicators point to improvement. Housing starts and permits, for example, have been going up, and so has housing-sector employment. House prices at the national level are back to pre-crisis levels, while historically low mortgage rates continue to aid demand.
That said, not everything is going back to the way it was. Two trends have emerged that differentiate the current situation from the pre-bubble period: Homeownership rates remain on the decline, and new construction is more heavily weighted toward multifamily buildings. If they continue, these trends could influence the outcome of important policy discussions on topics as diverse as tax reform and transportation planning.
A long road to normalcy
Figure 1 shows the buildup of the housing bubble in the early to mid-2000s and its subsequent bursting in early 2006. Since reaching its trough in April 2009, housing starts—an indicator of current housing activity—have gone up by 138.9 percent to 1.14 million units (seasonally adjusted annual rate [SAAR]). This figure is still 49.8 percent below the January 2006 peak, clearly indicating the scale of the bubble. Housing permits, a key indicator of future activity in the sector, show a similar trend.

The problems generated by overbuilding in the residential sector pre-2006 were made more severe because prices were rising rapidly and a growing proportion of buyers was using alternative financing (including subprime, interest-only, no-doc, and adjustable rates with very low teaser rates) to get into homes they would not have been able to afford otherwise. When unemployment began rising in 2007, it led to a perfect storm in which many people could no longer afford to pay their mortgages or find buyers for their homes at prices sufficient to cover their mortgages. Prices began to plummet and foreclosures began to rise (figure 2).
Coming out of the recession, home prices began to rise again and foreclosures began to fall as the economy recovered and mortgage rates remained very low. The Standard & Poor’s CoreLogic Case-Shiller National Home Price Index is close to its pre-recession peak, while the Federal Housing Finance Agency’s (FHFA’s) House Price Index has now surpassed its early 2007 highs.1 On the foreclosure front, the number of homes foreclosed per 10,000 has fallen to about 0.9 in August 2016, far lower than the peak of 10.3 in October 2010.2 Similarly, according to New York Fed Credit Panel data, the number of consumers with new foreclosures was about 82,840 in Q2 2016 compared to a peak of 566,180 in Q2 2009.3 In addition, the loan delinquency rate for all residential real estate loans from commercial banks is now heading down toward pre-crisis levels from a peak of 11.3 percent in Q1 2010.4
With consumer finances improving and house prices up again, the proportion of homes in negative equity has fallen. For example, the share of single-family homes with mortgages in negative equity has fallen from 31.4 percent in Q1 2012 to 12.1 percent in Q2 2016.5 This is good news for the housing sector as well as for household wealth.

But two trends have not reverted to past patterns. Both steadily declining homeownership and a rising demand for multifamily homes represent new factors in the housing equation with potentially widespread implications.
Homeownership has been going down
Long regarded as the hallmark of the American dream, homeownership rose steadily from 1940 until 2004 before stabilizing. Since then, however, it has been faltering.6 After reaching a high of 69.4 percent in Q2 2004, the homeownership rate decreased to 63.1 percent in Q2 2016.7 What is remarkable is that the homeownership rate has continued to decline even as other indicators of economic recovery have returned to pre-crisis levels (figure 3).
A look at homeownership data by age of householder shows that homeownership rates have fallen in all age categories, but have fallen the fastest for the two youngest cohorts—those where the householder is under 35 years of age, or is 35 to 44 years old (figure 4).


The continued decline in homeownership rates likely reflects a combination of factors. In the immediate aftermath of the housing crash, residential real estate went from being an asset that could be relied upon to constantly increase in value to a more risky, speculative venture. The security of the American Dream transformed into the nightmare of foreclosure for many (figure 2). For example, by Q2 2009, the number of consumers with new foreclosures had shot up to 566,180, the highest on record and about 3.2 times the corresponding figure three years prior to that.8
Even as foreclosures put a brake on homeownership dreams for many post the housing bubble, rising home prices of late have not helped either. According to data from the National Association of Realtors (NAR), median sale prices of existing homes—both total and single-family—started reversing their downward trend in 2012–2013.9 As of August 2016, prices for both are now at their respective peaks. With prices going up, affordability has gone down. The Housing Composite Affordability Index10 has been declining from its peak in early 2013 and was at an eight-year low in June 2016 before going up slightly in July.11
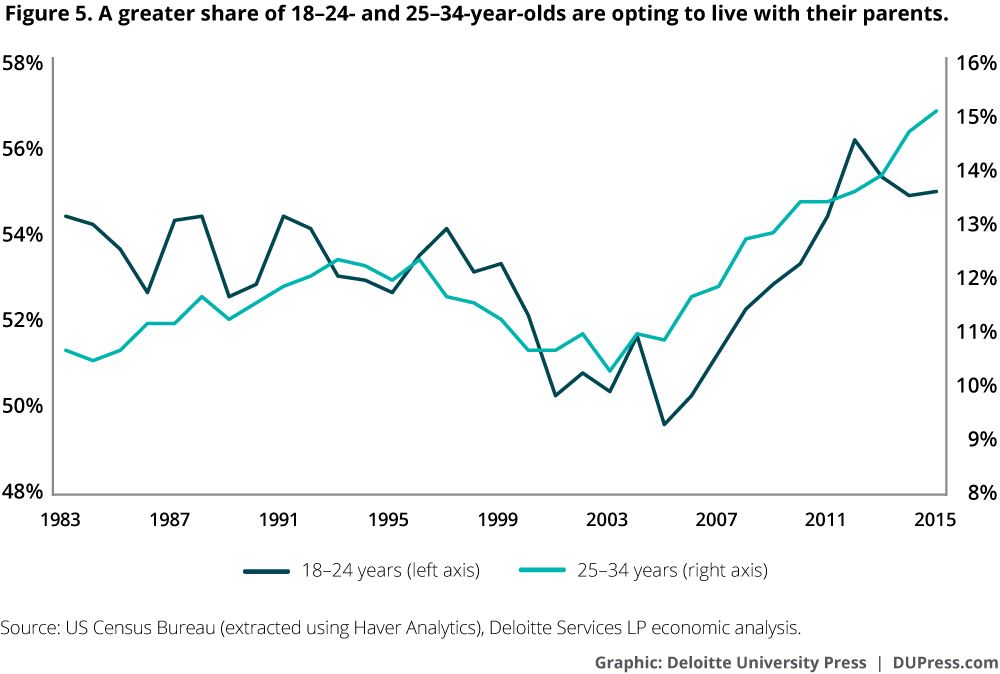
A slower pace of household formation is also likely impacting homeownership, as homeowners are a subset of householders. Between 2005 and 2015, for example, the total number of households in the country grew at an average annual rate of 1.0 percent, lower than the 1.4 percent rise between 1995 and 2005. The trend is similar for younger cohorts, especially among households headed by those under 35 years of age. This is likely due to the Great Recession’s disproportionate impact on young people, in many cases compounded by high levels of student debt.12 With household formation slowing down and homeownership declining among those under 35, an increasing number of them are now opting to live with their parents (figure 5).
As homeownership declines, renting has increased
Given the declining affordability of a new home—which was also an issue back in 2005–2006 due to high house prices—and reduced confidence in the financial return of homeownership, it is perhaps not surprising to see more people renting rather than buying. In the 10 years prior to Q2 2016, for example, the number of renter-occupied housing units increased by 26.8 percent. In contrast, the number of owner-occupied units fell by 2.0 percent (figure 6). As a result, the share of renter-occupied homes in total occupied homes went up by 5.8 percentage points during this period to 37.1 percent, close to the highs of 1965 (when records started).13 Along with this trend of increasing demand for rental housing has come a decline in rental vacancy rates. For example, between their respective peaks in 2008–2009 and now, the rental vacancy rate has gone down by 4.4 percentage points, while the homeowner vacancy rate is lower by just 1.2 percentage points.14

Increasing demand for rental homes, in turn, has forced rents up. Since Q1 2013, the median asking rent has gone up by about 21.9 percent.15 Interestingly, the data also reveal that the median asking rent for multifamily homes has gone up by more than the asking rent for single-family homes in recent years, unlike in previous periods (figure 7). This perhaps suggests that the demand for multifamily homes is growing faster than the demand for single-family units among renters. A quick analysis of the pace of decline in rental vacancy rates for both single- and multifamily homes also hints at the same (figure 8).
Given rising rents, one may wonder as to why people are not opting to buy their own home instead of renting. One answer may lie in the strong pace of growth in home prices. Between 2011 and now, median home value inflation has outpaced median rent inflation (except during a small period in 2015), thereby denting home affordability.16


Multifamily homes are more in demand
As demand for multifamily homes rises among renters, the segment is making a comeback in the housing market. In 2005, when permits for single-family homes had reached their peak, they accounted for about 78.0 percent of all new building permits. That fell to 63.9 percent this year as demand for multifamily homes has risen over the last few years (figure 9). The growing demand for multifamily homes is also evident from the value of private construction put in place. Between December 2010 and August 2016, for example, the value of construction put in place for multifamily homes went up by 353.4 percent, much higher than the corresponding figure for single-family homes (120.3 percent).17

Declining homeownership and rise in multifamily homes: Evidence from the cities
One explanation for an increase in multifamily homes could be an increased movement of people from suburbs or rural areas into cities. At first glance, this seems unlikely: At the national level, central cities continue to experience net outflows of people and suburbs net inflows, although the pace for both has slowed down since 1999 (figure 10). But the national-level data masks some important trends, as it combines data from cities losing population with data from cities gaining population.

An examination of the cities that are experiencing population gains provides a fuller explanation of housing trends at the national level—declining homeownership, growth in renting, and the rise of multifamily homes. In this section, we consider housing trends in the 15 cities in the United States with the largest absolute increases in population between July 1, 2014 and July 1, 2015.18
Housing metrics within these cities show some interesting similarities to the national averages. For example, in many of these cities, house prices and rents have risen in a manner similar to the pattern at the national level between 2012 and 2016, as measured by Zillow’s Home Value and Rental Indexes (table 1). In all 15 cities, except New York and Charlotte, house prices have outpaced rent inflation, like the national average.

A look at housing prices across the 15 cities reveals that these cities fall into two broad groups. In cities like Phoenix, Los Angeles, and San Francisco, home prices rose quickly in 2012–2016 only after a prolonged period of slump due to large housing bubbles. That is to say, a key reason for fast home price growth in these cities is a relatively lower price base after the bursting of the housing bubble. In contrast, cities like Houston, Austin, Dallas, Fort Worth, and San Antonio (all in Texas) and Denver (in Colorado) were not affected much by the bubble to start with (figure 11). It is likely that home prices in these latter cities have continued to surge mainly due to rising population and a growing economy. This, in turn, has raised rental demand, thereby pushing up median rents as well, though not as much as home prices.


A growing population and high house prices have dented homeownership in many of the above cities. For example, in all but 2 of the 15 cities, the homeownership rate is below the national average (San Antonio and the Washington-Arlington-Alexandria metropolitan area are the two exceptions). Homeownership has also declined by more than the national average in many of these cities as well (table 2). And in keeping with the average trend for the United States, rental vacancy rates in these cities have fallen faster than the homeowner vacancy rate, highlighting that more people have been preferring to rent than buy over the past few years.19
Trends in these 15 cities—declining homeownership coupled with a greater rise in median house prices than in rental prices—also help us understand the growing demand for multifamily homes. However, the monthly data on building permits for these cities are non-seasonally adjusted and, hence, volatile. Looking at annual data instead, we find that the number of permits for multifamily homes has risen faster than for single-family ones in many of these cities during 2012–2015, with the New York-Newark-Jersey City metropolitan area standing out in this regard. However, there are notable exceptions. For example, key metropolitan areas in Texas, like San Antonio and Austin-Round Rock, have witnessed declines in permits for multifamily homes during the above period, thereby bucking the national trend. This could be because, despite declining affordability, people may be opting to buy single-family homes due to better economic prospects. But there is also likely a correction factor involved during this period. For example, in Austin-Round Rock, the decline in permits for multifamily homes in 2012–2015 comes after a huge surge in multifamily home permits in the previous two years (584.3 percent in 2010–2012). The same holds true for Denver-Aurora-Lakewood, Charlotte-Gastonia-Concord, Jacksonville, and Washington-Arlington-Alexandria.
Policy implications
The choices we make as to where and in what circumstances we live have important implications for many aspects of American life, covering everything from public policy decisions to individual retirement planning, as well as impacting other sectors that rely on household demand. As a nation, we invest a significant amount to support the American dream of home ownership. Tax expenditures from the mortgage interest deduction are the fourth-largest category of expenditures ($75.3 billion in 2015), following the exclusion of employer contributions for medical insurance and care, capital gains, and the exclusion of net imputed rental income.20 As fewer people choose or are able to purchase a home, this deduction might come under increased scrutiny in tax reform discussions.
The decline in homeownership also has implications for household wealth. A house often comprises a large share of household wealth, especially among middle-class households.21 While not holding a mortgage may reduce risk in the near term for households, this important asset, which underpins many current retirees’ economic security, may be missing from the portfolios of a growing number of future retirees. Furthermore, with the shift to more multifamily homes and more renters, producers of goods and services relating to housing will likely be impacted, including everything from insurance to appliances and lawn equipment and even the demand for personal automobiles.
On a more local basis, communities need to assess how their localities are evolving. Areas such as Seattle and San Diego may need to consider how to serve the increased density that comes with large increases in multifamily homes, while communities such as Charlotte, Jacksonville, and Austin may need to continue to deal with fast-growing single-home developments. As people are increasingly looking to work, live, and play within their communities, local policymakers and planners should carefully weigh the types of amenities they need to provide in order to attract the businesses and people needed to keep their communities vibrant.
© 2021. See Terms of Use for more information.
