


The geography of jobs, part 2: Charting wage growth has been saved
The geography of jobs, part 2: Charting wage growth
26 September 2014
Job growth finally appears to be on a sustained upswing, but how are variations in growth among and within industry segments impacting wage growth at the national and state level?
Job growth finally appears to be on a sustained upswing, but what does that mean for wage growth? This report explores how variations in growth among and within industry segments are impacting wage growth at the national and state level.
Our first “Geography of jobs” report explored how job creation shifted among states and industries during the period between December 2007 and April 2014—that is, from the end of the last business cycle through the current expansion. The focus of that report was on how the long-term decline in manufacturing employment, the newer expansion in oil and gas employment, and the cyclical roller coaster of construction played out among the states. In this report, we shift to more recent trends to consider how variations among and within industry segments are impacting wage growth. This report focuses on two sectors—business and professional services and leisure and hospitality—that together comprise 24.4 percent of total nonfarm employment and account for 45.2 percent of net job growth over the past two years.1
Broad-based employment gains with mixed wage results
Over the past two years, job growth in the United States has been averaging 203,000 jobs a month, for a total of just under 5 million jobs created between July 2012 and July 2014. However, during that same period, hourly wages grew very slowly—only 4.0 percent in total.2 This slow wage growth rate exactly matched the change in prices for the same period, meaning that the real average hourly wage did not increase.
This lack of movement is sometimes broadly interpreted as a sign that wage growth is stagnant. However, a drill-down into the data shows a reality that is more complicated. The zero aggregate real wage growth at the national level masks the diversity of job creation that occurred over the last two years at the state level, as jobs were being created at all wage levels in varying patterns across the states.
Variation across industries
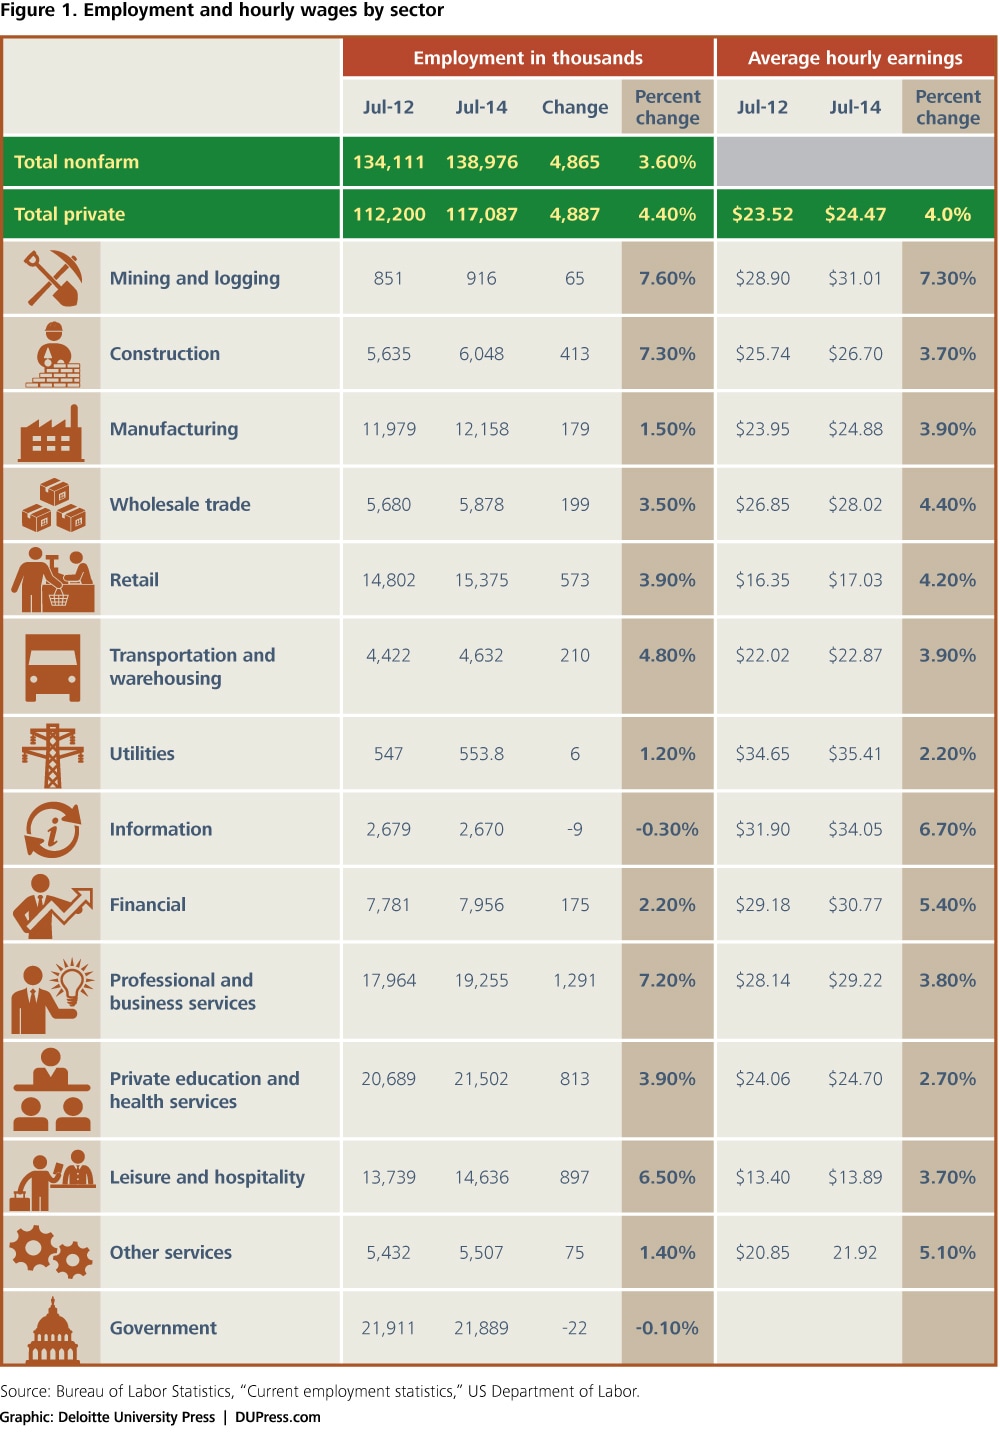
Figure 1 shows the changes in employment and hourly earnings by major sector between July 2012 and July 2014. The sectors contributing the largest number of jobs during this period were a mix of jobs that pay a higher wage on average (business and professional services and construction) and those that pay lower wages on average (leisure and hospitality, retail, and private education and health services). In some sectors—among information workers and financial workers in particular—wages grew faster on a percentage basis than average; in other sectors, such as utilities and private education and health services, wage growth was below average. While it is not possible to determine the wage experience of individuals from these data, the numbers do provide evidence that wage growth trends have offset each other in the industries where jobs were being created.
Variation across the states
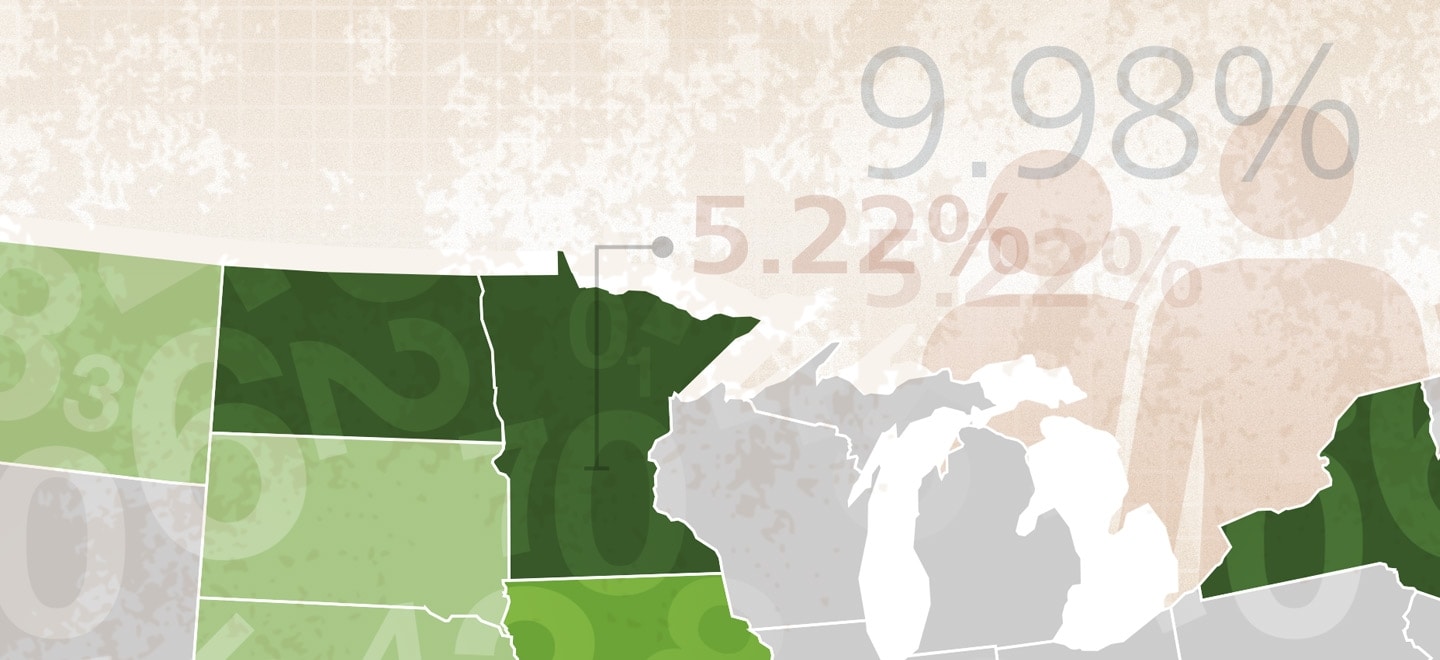
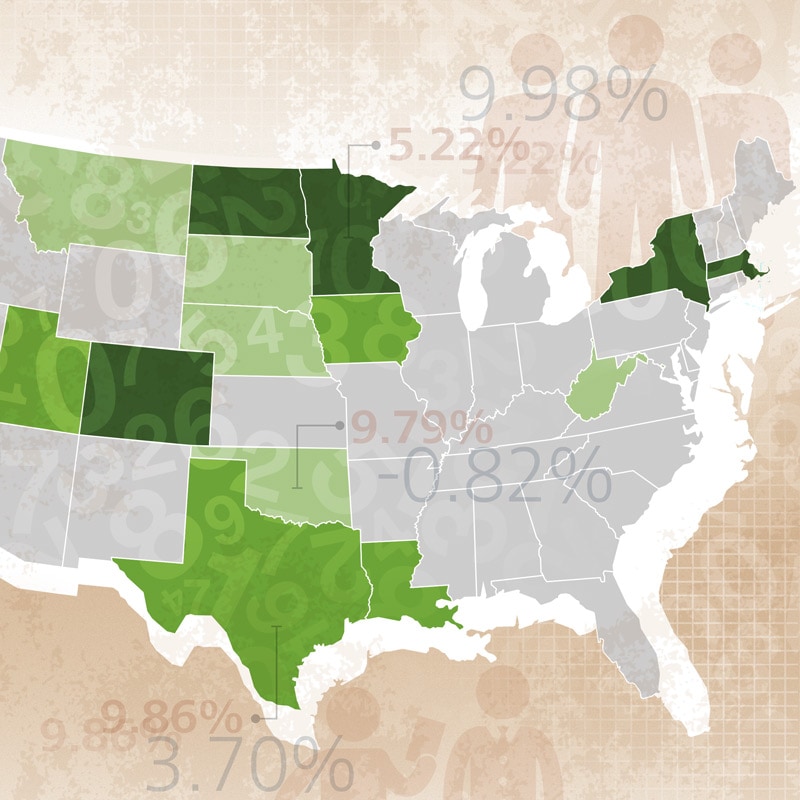
The national aggregate numbers mask another important source of underlying variation: location. States have different average hourly wages, ranging from a high of $29.01 in Massachusetts to a low of $19.34 in Mississippi. Therefore, the national average wage depends to some extent simply on where new jobs are being created. Further, the states vary widely in the distribution of jobs across industries. For instance, 15.2 percent of total Massachusetts nonfarm employment is in professional and business services, while the comparable percentage for Mississippi is 8.9 percent.
States have different average hourly wages, ranging from a high of $29.01 in Massachusetts to a low of $19.34 in Mississippi.
Overlaid on these structural issues are different growth rates. The scatterplot in figure 2 shows wide variations in employment/wage gain combinations, with employment gains and average wage gains sometimes moving in different directions.3 The color-coding denotes which states have high (green), medium (gold), and low (red) average wages.
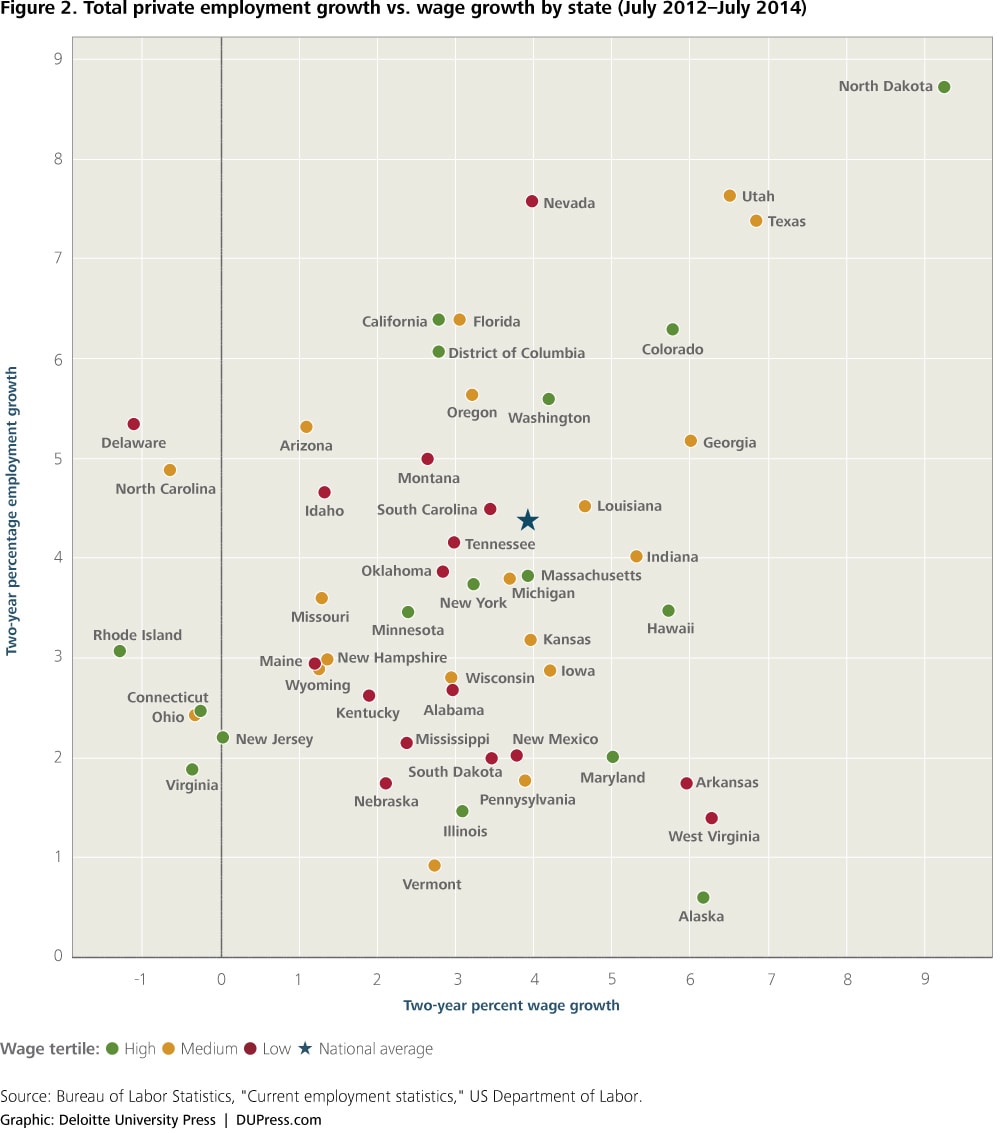
On the surface, it appears that several states are experiencing a wage decline. But while true with respect to these states’ average wage, in many cases, the situation is more likely a reflection of faster growth in some of the lower-wage industries relative to growth in the higher-wage industries or an increase in lower-wage occupations relative to higher-wage occupations within an industry—a factor not accounted for by these data. North Carolina, a medium-wage state, provides an interesting case study. Overall, the state’s economy grew rapidly during the past two years, adding more than 160,000 jobs and lowering state unemployment from 9.4 percent in July 2012 to 6.5 percent in July 2014—an amazing turnaround. However, during the same period, the state’s average total private hourly wages declined by 14 cents, from $21.74 per hour to $21.60 per hour. Rather than reflecting a decline in individual salaries, this overall decline in wages appears to stem from structural shifts in the state’s economy. North Carolina added more jobs in sectors with lower average wages during 2012–2014 than jobs in the higher-wage sectors, thus shifting the overall balance of the state’s workforce slightly toward lower-paying jobs. For example, North Carolina added nearly 23,000 jobs in the leisure and hospitality sector and 20,000 new jobs in retail—industries that have relatively low average wages. This, however, was balanced by the creation of 53,500 jobs in professional and business services.4 It is important to note that one should not characterize this phenomenon as a shift from “good jobs” to “bad jobs,” particularly in cases such as North Carolina, where the shifting patterns represent the entry or reentry of thousands of formerly unemployed workers.
Spotlight on two growing sectors
An examination of two specific sectors—professional and business services and leisure and hospitality—offers important insights as to why generalizations about the types of jobs being created and the extent to which wages are rising or falling can be misleading at high levels of aggregation. Both of these sectors have experienced large employment gains over the period (both absolutely and proportionally). However, jobs in professional and business service establishments pay higher-than-average wages, and those wages have been growing slightly more slowly than average (and thus slightly behind the rate of inflation). In contrast, jobs in leisure and hospitality establishments pay lower-than-average wages, and those wages have also been growing slightly more slowly than average.
Professional and business services
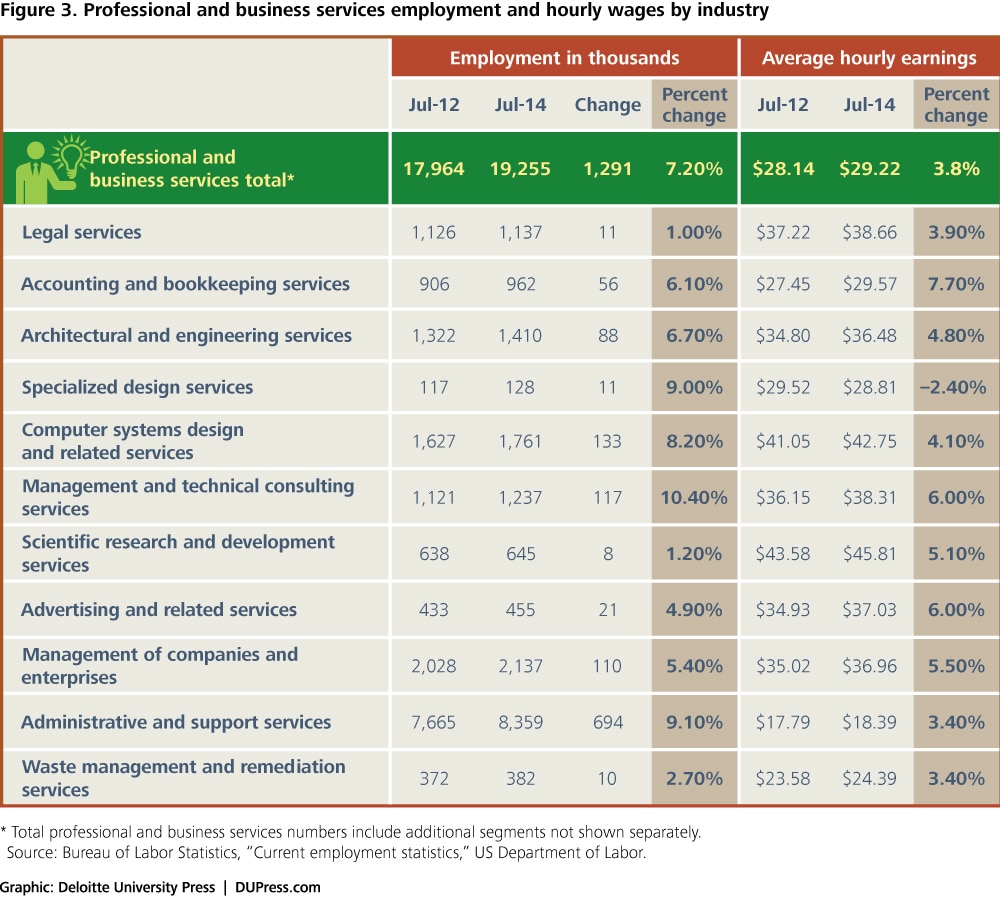
Figure 3 gives an idea of how the standard aggregations can conceal rather than illuminate. As the sector with the highest average hourly wage, professional and business services has been a major job creator since the beginning of the recovery in June 2009. Currently, this sector employs 1.2 million more people than it did when the recession started in December 20075—a substantial contribution to a US economy that only recently surpassed total prerecession employment levels.
Since professional and business services is a sector that provides services to other businesses, its health depends in large part on the health of the businesses it serves. Hence, it has benefited from the turnaround in the US economy. But other factors are also at play, including the long-term trend of outsourcing non-core functions into professional and business services by other sectors such as manufacturing and construction, as well as the rise of exports of these services. Services exports generally, and business services exports in particular, are a bright spot in US international trade, characterized by strong export growth and producing a trade surplus. For example, exports in the US Census Bureau category of “other business services” totaled $68.7 billion in the first half of this year and contributed a surplus of $18.6 billion.6
Professional and business services has been a major job creator since the beginning of the recovery in June 2009. Currently, this sector employs 1.2 million more people than it did when the recession started in December 2007.
However, when one considers the types of establishments covered by professional and business services, they are very heterogeneous, ranging from administrative and support services—which comprises 43 percent of this category and has an average hourly wage of $18.40—to the higher-paying computer and systems design services ($42.73 per hour) and scientific research and development services ($45.67 per hour).7 Figure 3 shows the breakdown of different types of services within the broader category.
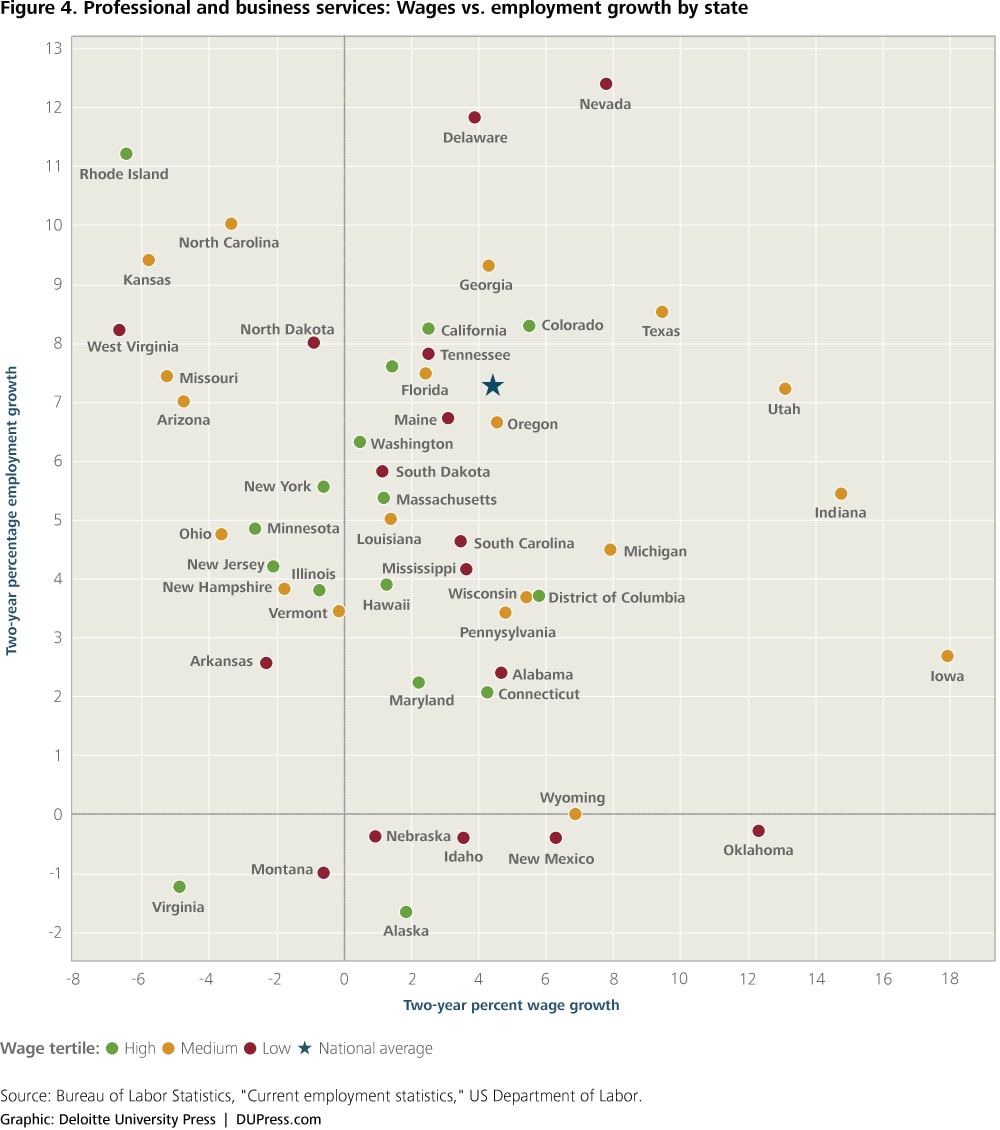
In absolute terms, only seven states experienced a reduction in employment in professional and business services between July 2012 and July 2014, with only two states, Virginia and Montana, having declines in both employment and average wages during the two-year period (figure 4). But again demonstrating that one number does not tell the whole story, Virginia and Montana have lower-than-average unemployment rates. Among the states that gained employment in this sector, the average wage change was decidedly mixed.
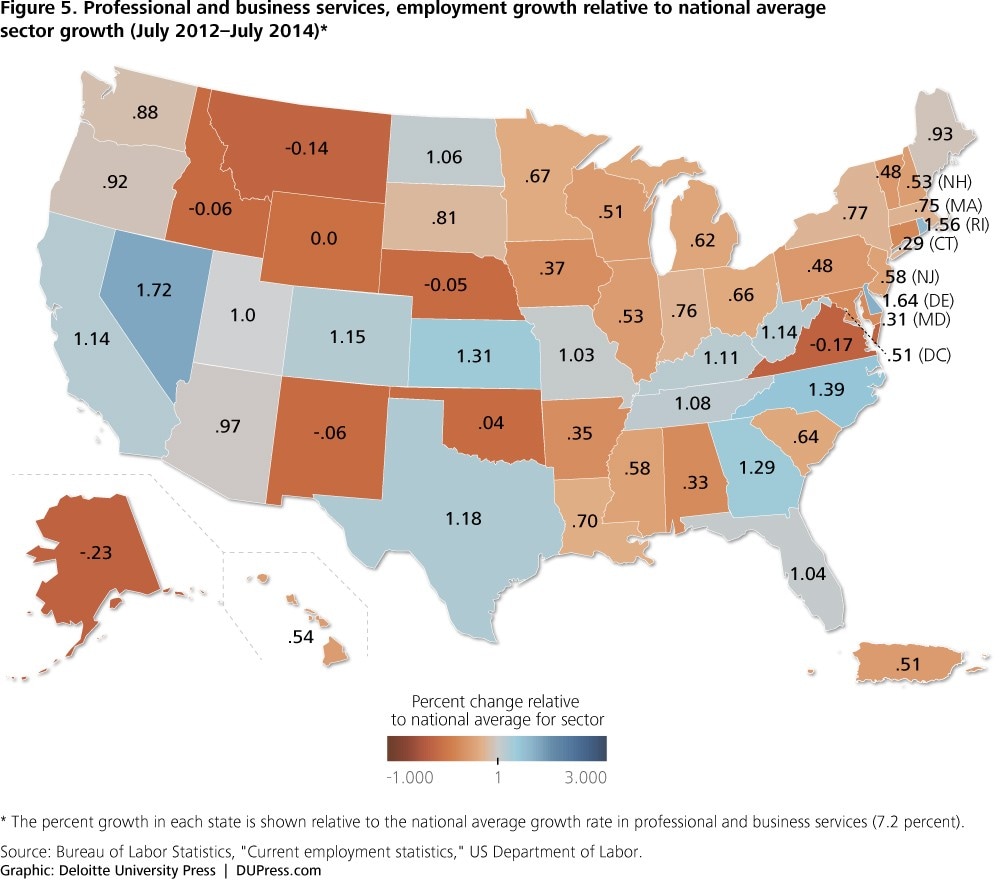
With the strong total employment growth experienced in this sector, it is not surprising that states that did well in overall growth had stronger-than-average growth in professional and business services. Of the 18 states with overall employment growth higher than the national average, nine had higher-than-average growth in this sector, which experienced 7.2 percent average employment growth across all states (figure 5). That said, Delaware is a case in point of how aggregate figures can obscure underlying trends. From July 2012 to July 2014, Delaware added 6,600 jobs in this comparatively high-paying category. However, of those 6,600 jobs, 5,200 (79 percent) were in the lower-wage areas of administrative and support and waste management and remediation services. So while Delaware experienced strong growth in this sector, the jobs it added over the period were lower-paying compared to the national average, pushing its aggregate wage figures down.
Leisure and hospitality
After taking a little longer than some sectors to recover from the Great Recession, the leisure and hospitality sector has grown about as rapidly as professional and business services—and is similarly operating with 1 million jobs more than it had when the recession started in December 2007.8 The drivers of employment growth in this sector are many, including improving general economic conditions, shifting demographics, and an increase in tourism (from both domestic and foreign travelers). Over the last three years, the increase in real travel and tourism spending has grown at almost twice the pace of overall GDP growth.9 National Restaurant Association analysis of sales at dining and drinking establishments show an increase of $2.7 billion over the past year.10
The variation in average hourly wage rates among the components of the leisure and hospitality sector is not nearly as large that in some other sectors, ranging, at last estimate, between $12.15 for employees in restaurants and other eating establishments on the low end, to $29.50 for arts and sports promoters, agents, and managers on the high end. (It goes without saying that the latter category is small—1 percent of the total.)11 Thus, it is less clear that shifting industry composition played a major part in keeping wage growth below the rate of inflation at the national level. However, fewer states experienced a decline in wages in the leisure and hospitality sector than in professional and business services (figure 6). The higher percentage of minimum-wage workers (already receiving the lowest legal wage) in leisure and hospitality might account for this difference.
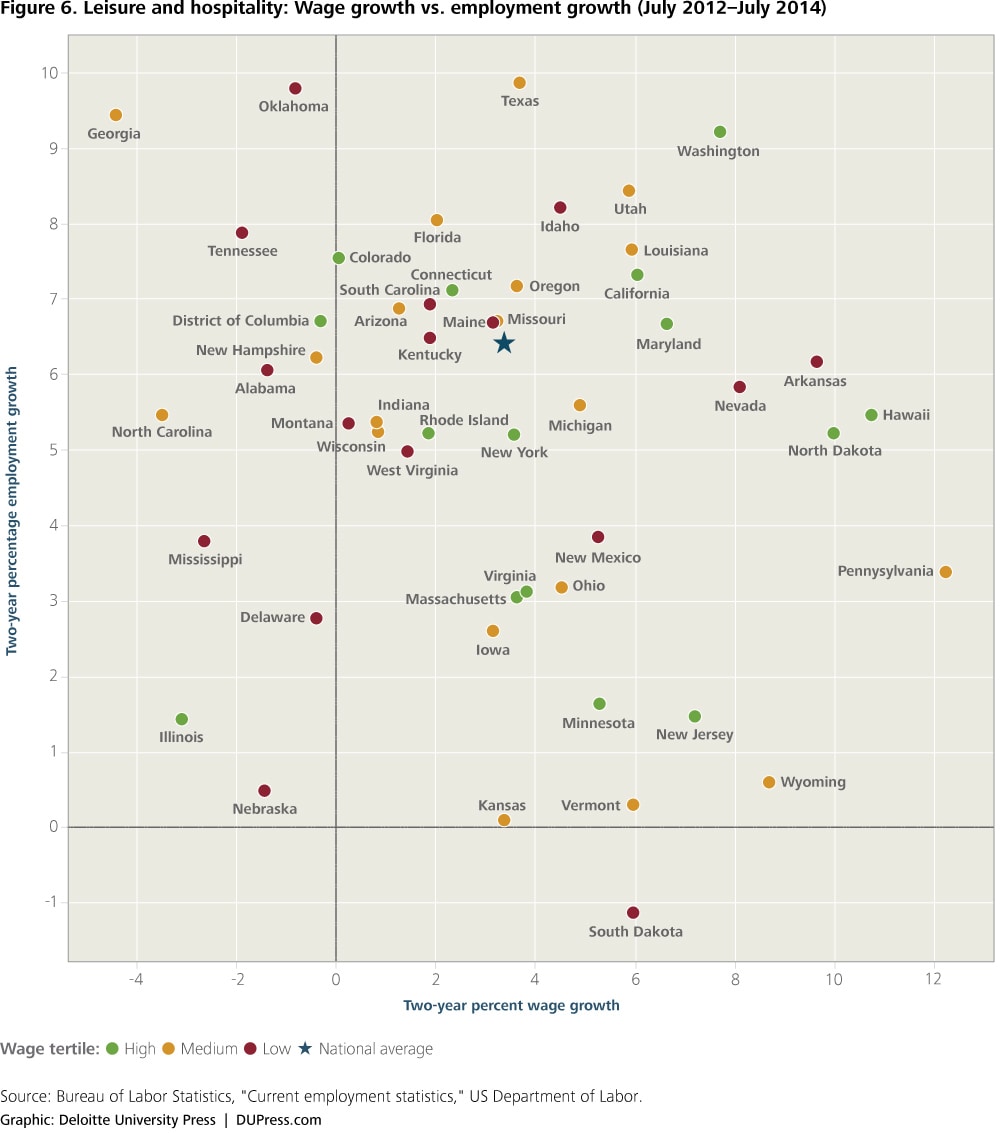
Texas is an interesting case. The state added a large number of comparatively low-wage leisure and hospitality jobs over the past two years, including 91,400 in accommodation and food services, and 15,500 in arts, entertainment, and recreation. During the same period, it also added a high number of high-paying jobs, including 46,500 in the financial industry and 57,600 in professional, scientific, and technical services. Because the state’s job growth was more even across the whole salary range, its aggregate average wage growth was a strong 6.9 percent.
The leisure and hospitality sector has grown about as rapidly as professional and business services—and is similarly operating with 1 million jobs more than it had when the recession started in December 2007.
Moral of the story: Averages aren’t everything (and maybe not anything)
The recent lack of movement in the average real wage conceals a reality that is more complicated. Different sectors are expanding at different rates in states that have very different wage structures—differences that are obscured when rolled up to the national level. Further, some of the movement or lack of movement in average hourly wages may be due to the return of formerly unemployed workers who may be entering or reentering the labor force at lower-than-average wages—a situation that will hopefully correct itself as their employment tenure increases.
Please tweet your comments @DU_Press using #Geographyofjobs. We look forward to continuing the conversation as we consider how the effects of the Great Recession are felt at the local level by citizens from across the economic spectrum.
© 2021. See Terms of Use for more information.
