More durables in the basket … and yet consumers are paying more for services
The August 2024 Economics Insider focuses on shifts in US consumer spending patterns—in durables and services—highlighting changes in nominal and real consumer spending over the years
In the United States, the money consumers shell out for services has been growing at a much faster pace than for goods, especially durables.1 This may seem strange, especially given that in “real” terms, once price changes are accounted for, consumer purchases of durable goods themselves outpace services. So, what is the reason for this dichotomy? Well, as in most economics-related questions, the answer lies in prices themselves: Prices for goods and services change at different rates, thereby affecting nominal spending and volumes consumed in different ways.
Over time, shifting prices account for changes in the quality of goods and services.2 Such quality adjustments are most apparent in durable goods, such as information and communication technology equipment.3 The ubiquitous smartphone—which allows us to stream movies and access online gaming to name a few—is the best example of this phenomenon. In contrast, the cost of services has gone up steadily: Services price changes are closely tied to wage increases, irrespective of quality. The nominal value of consumer spending on services has, therefore, increased at a faster pace than durables.
Consumers are spending more on durables … or are they?
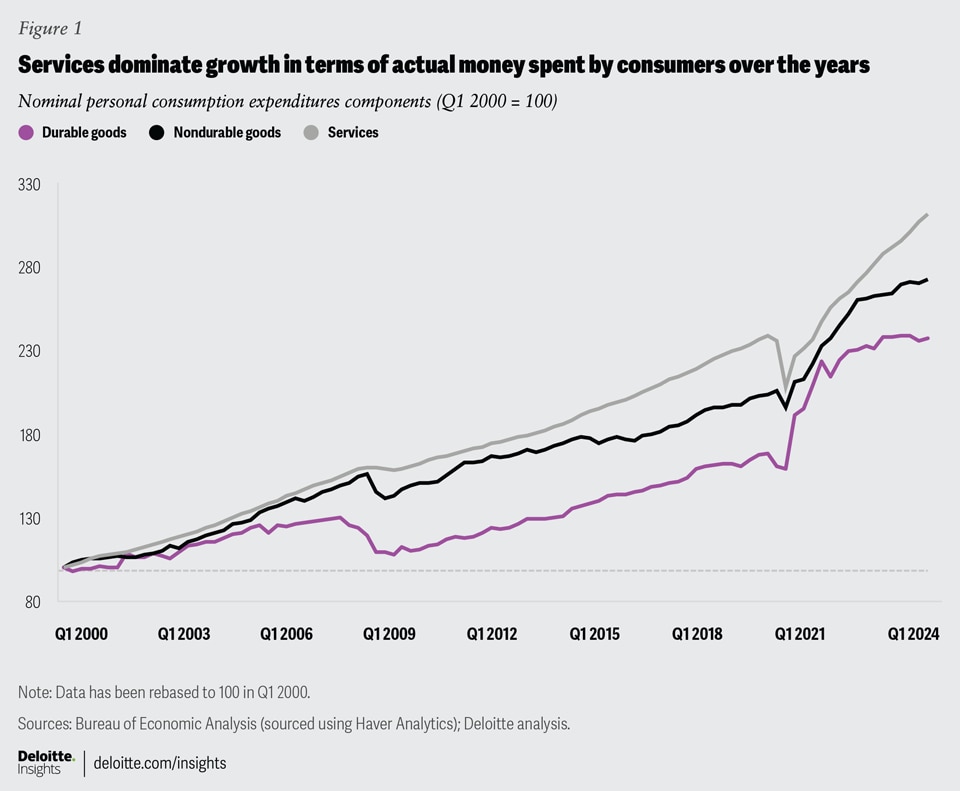
While real personal consumption expenditure (PCE) is an indicator of consumer purchase volumes, nominal PCE shows the actual amount of money that consumers are spending. Nominal consumer spending on services has gone up by 212% since the start of the new millennium—much above the 137% rise in durable goods spending (figure 1). As a result, durables’ share in total nominal spending has gone down slightly (yet steadily) over time. Between 2000 and 2019, the share fell to 10.6% from 13.5%, picked up a bit during the initial phase of the pandemic, and edged downward again mid-2021 onward.
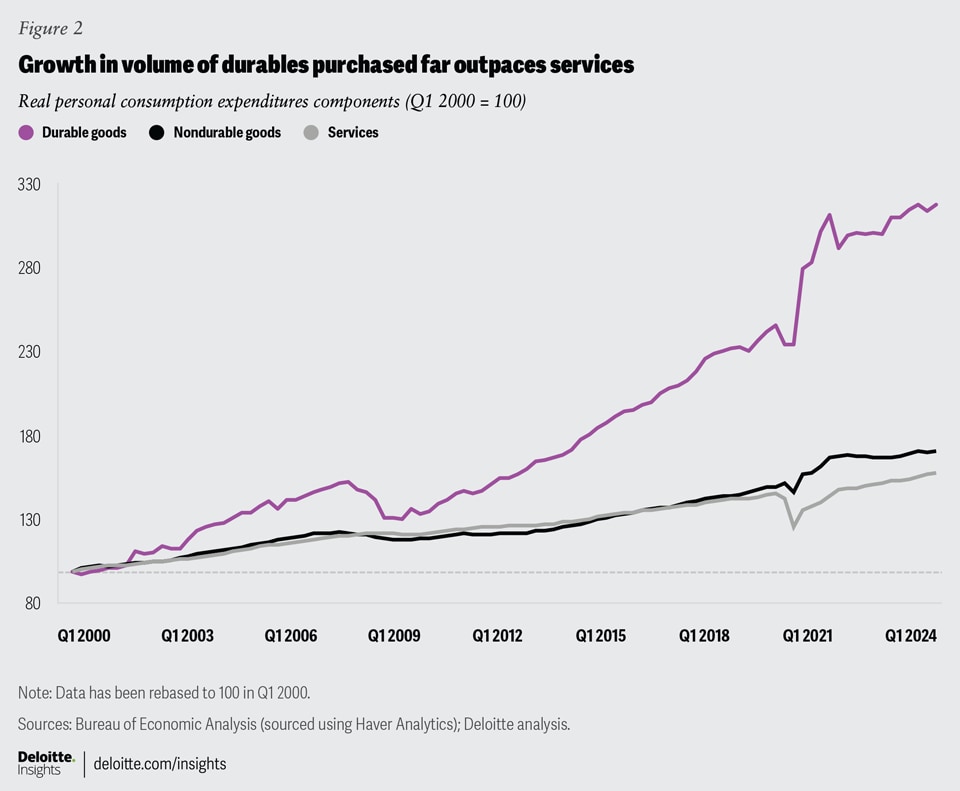
In contrast, consumer purchase volumes for durables have more than tripled since 2000, compared to a mere 58.2% rise in services over the same period. The pace diverged even more from 2020 to 2021, when the volume of service purchases fell sharply as people stayed indoors (figure 2). During that time, households lapped up more goods for home offices and gyms, along with electronic equipment, while service purchases.4 Since 2022, however, purchase volumes for both goods and services have been moving toward pre-pandemic trends.
Falling prices have made durables more affordable
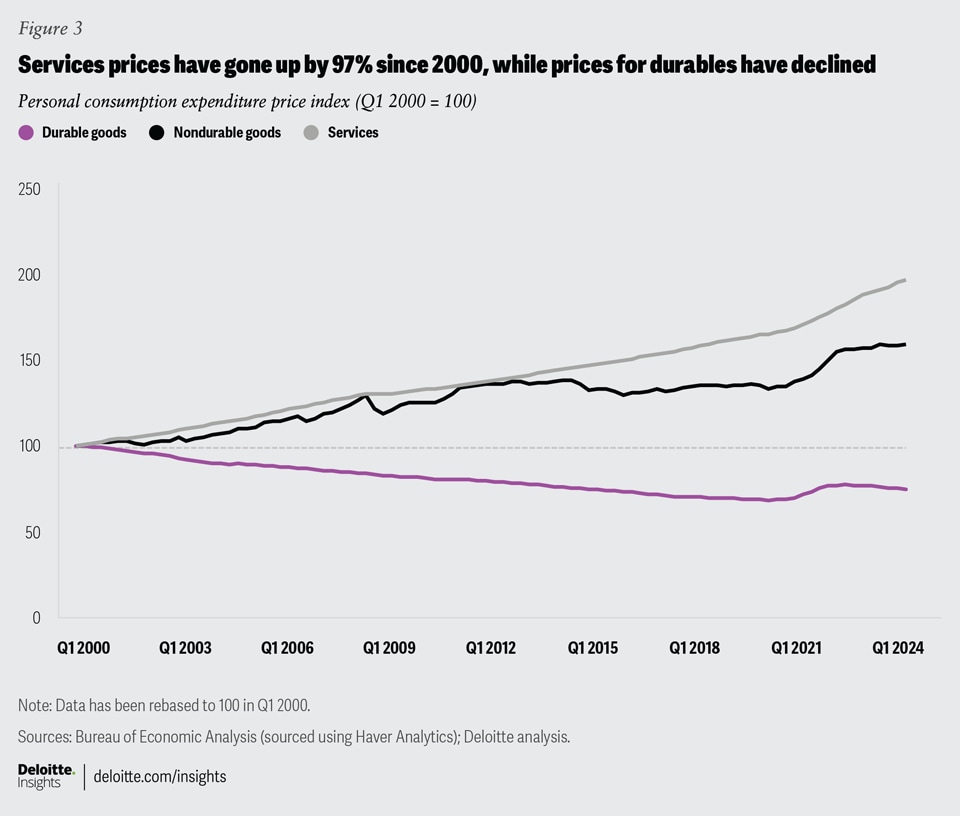
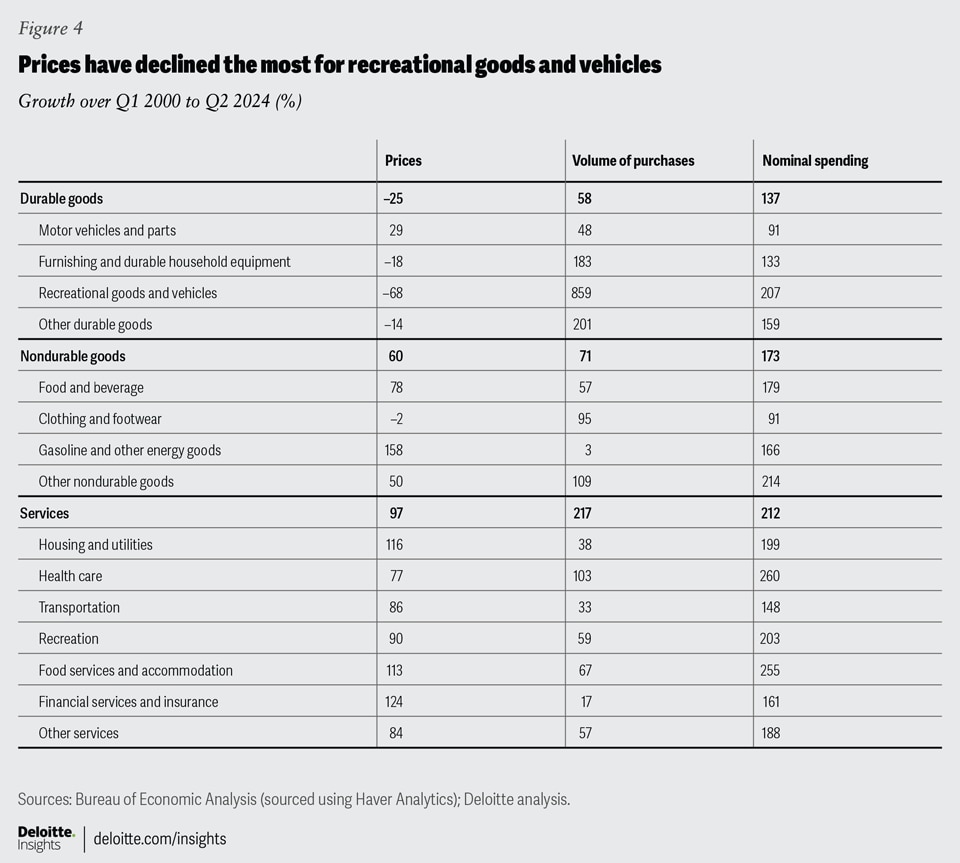
It’s not difficult to explain why durables’ purchase volumes have risen so much compared to nondurables and services—this phenomenon is driven by relative price changes (figure 3). Since 2000, durables’ prices have fallen by 25%. In fact, excluding the surge from 2021 to 2022 due to rising demand and supply chain challenges (driven by the pandemic), durable goods’ prices have mostly been declining. In contrast, prices of services are up 97% since 2000. Nondurable goods too have become more expensive, driven primarily by rising food and energy prices, with the latter being more volatile. Prices have risen for all major types of services and all nondurable goods excluding clothing and footwear (figure 4).
Nowhere is the impact of falling durables prices more evident than in recreational goods and vehicles, where prices have declined by 68% since 2000; purchase volumes have gone up by 859% in this period (figure 4). Within this category of durable goods, the trends are even stronger for video, audio, photographic, and information processing equipment and media. These goods include familiar items such as smartphones, tablets, and laptops: Prices for these are down by a staggering 86% since 2000, while purchase volumes are now more than 20 times what they were in 2000. With such a strong surge in volumes, nominal spending on these goods has increased despite lower prices: Consumers are now spending 3.4 times on video, audio, photographic, and information processing equipment and media than they used to in the year 2000.
It’s worth noting that the sharp price decline of some of these durable goods also accounts for immense improvements in their quality over time.5 Smartphones, for example, are ubiquitous nowadays, and unlike in the early 2000s, a person can use such a device to not only make calls but also access services like emails, instant messaging, online gaming, and content streaming. Studies by the Pew Research Center show that smartphone ownership in America has surged to 97% from just 35% in 2011.6 Advancements in mobile networks and internet connectivity have aided the rise of such devices.
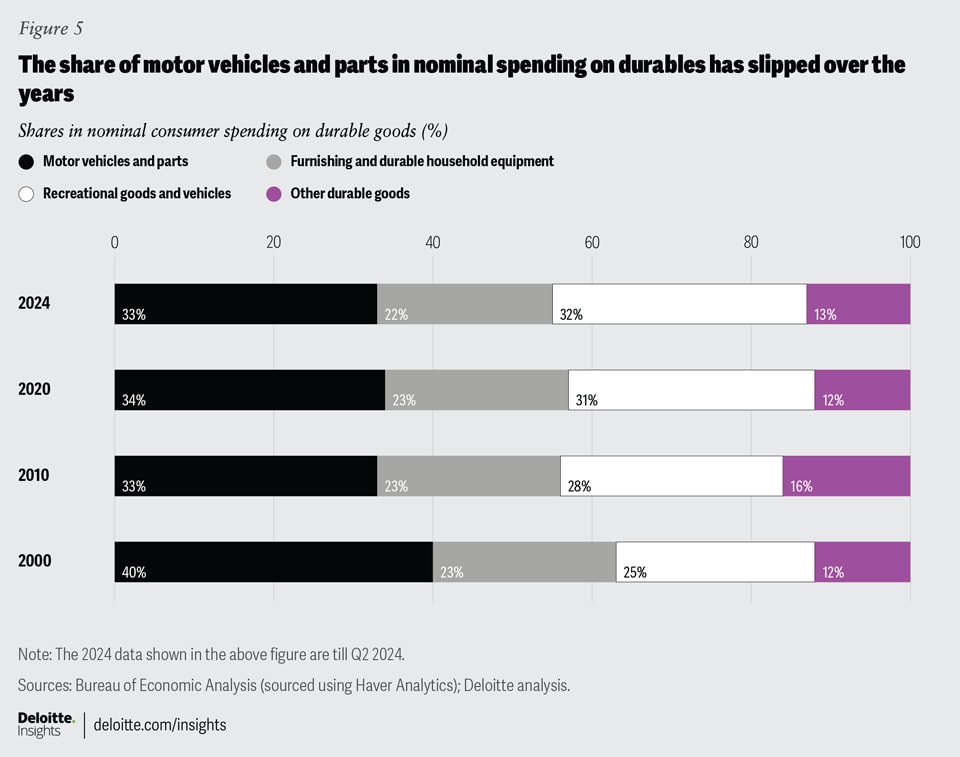
Shares in spending have shifted the most within durables
With such changes in prices and purchase volumes, shares of key goods and services in nominal consumer spending numbers have changed over time. Figure 5 shows changing shares for key categories in total nominal spending on durable goods. Motor vehicles and parts continue to have the largest share in nominal spending on durables, but only barely, with recreational goods and vehicles following right behind. In fact, the share of motor vehicles and parts has gone down steadily over the years, which is not surprising as volumes of purchases have grown the least among the four major types of durables (figure 5). This share in nominal spending on durables would have declined even more had it not been for rising prices. In fact, motor vehicles and parts are the only major durables category that has witnessed a rise in prices over time (figure 5).
Within services, shares haven’t changed substantially. While the share of health care has gone up slightly, those for financial services and insurance have edged slightly downward. Within nondurables, the share of clothing and footwear has gone down but not by much. Overall, the most overwhelming shift in spending is observable within the durable goods category itself—that too, between motor vehicles and parts and recreational goods and vehicles.
A major driver of the economy
Be it nominal or real, consumer spending plays a major role in the US economy—and is expected to continue doing so in the future. While nominal PCE accounts for nearly two-thirds of the economy, real consumer spending has been a key driver of economic growth over the years. In fact, growth in real PCE for durables led the economic recovery seen after the COVID-19 pandemic, with services growth also picking up later. By the second quarter of 2024, real PCE was 11.6% higher than year-end 2019. Deloitte economists believe that real spending will increase at a steady pace over the next few years, led by services.7 Consumers’ purchasing power will benefit from slowing inflation.8 Lower inflation, in turn, will also help the Federal Reserve to loosen monetary policy, thereby bringing down consumers’ cost of borrowing.9
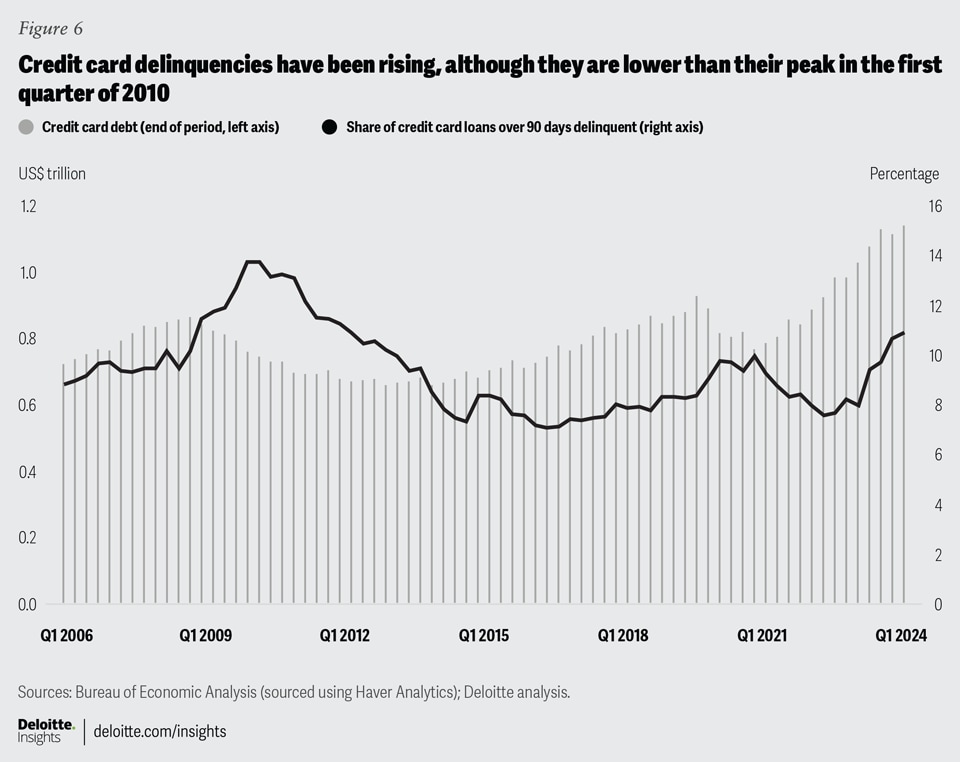
There are reasons to be cautious though. First, consumers have been dipping into their savings to fund more spending over the past two years. But the pace of savings growth has declined with the personal savings rate now standing at 3.4%—almost half of pre-pandemic levels.10 Estimates by economists at the Federal Reserve Bank of San Francisco show that American households have exhausted their pandemic-era savings this year.11 Second, consumers face rising credit card debt—more than US$1.1 trillion—while delinquencies go up (figure 6).12 Finally, any softening of the labor market will dent household finances and consumer confidence. After all, strong jobs growth and rising wages have aided consumers these last three years.