Share buybacks and dividends outshine capital expenditure Economics Spotlight, March 2019
6 minute read
27 March 2019
While US companies are borrowing more, capital expenditure hasn't increased proportionally as corporations also seem to be focusing on share buybacks and dividends.
What are US corporations doing with their record levels of borrowing?1 Are they shelling out more money on investments, or has some of this money and existing cash found their way into share buybacks and dividend payments? An analysis of key statistics for the top 500 nonfinancial companies by market value in January 2019—sourced from S&P Capital IQ2 (see sidebar, “Data description and methodology”)—reveals that capital expenditure (capex) for these companies, taken together, has gone up during the current economic recovery. Unfortunately, what the data also tells us is that this surge in capex has been overshadowed by large amounts of buybacks and dividends. In this edition of the Economics Spotlight, we take our discussion on corporate debt3 a step further by analyzing trends in companies’ investments, buybacks, and dividends, and which groups of companies and sectors are driving this trend.
Data description and methodology
For our analysis, we took annual data—financial year and not calendar year—of the top 500 nonfinancial companies by market value in 2019 from S&P Capital IQ. So, when we compare trends across 1992–2000, 2002–2007, and 2010–2017 (2018 wherever data is available), our list does not change. This is done for ease of analysis.
After arranging these 500 companies by descending order of market value, we categorized them into four sub-groups:
- Top 25: The companies ranked from 1 to 25 in descending order of market value
- 26–50: The 25 companies after the above category
- 51–100: The next 50 companies
- 101–500: The next 400 companies
We have created sub-groups so that we do not gloss over trends among smaller groups within the 500 companies. We start with the top 100 companies (given that there is a lot of focus on them) and split them into three sub-groups: top 25, 26–50, and 51–100. This way, if there are subtle differences in trends within these 100 companies, we can point these out and analyze further. The 101–500 group helps fill the gap in identifying diverging trends, if any, within the top 500 companies.
Capex did not keep pace with buybacks and dividends
For the 500 companies, taken together, capex went up by an average annual rate4 of 6.2 percent during 2010–2017,5 lower than what it was during 1992–2000 and 2002–2007. While data for 2018 is incomplete, what is available so far hints at a slight uptick in capex growth that year. The pace of growth in capex during 2010–2017, however, is lower than the corresponding growth in share buybacks and dividends (figure 1). Growth in total debt for these companies was also higher than capex during this period.


Overall, between 2010 and 2017, these 500 companies poured in about US$4.6 trillion in capex with another US$682.5 billion (recorded so far) in 2018. If that seems large, check out the rise in buybacks and dividends during 2010–2017: US$2.9 trillion and US$2.3 trillion, respectively. And buybacks shot up further in 2018 (US$582.4 billion), likely due to the passage of the Tax Cuts and Jobs Act in the previous year, which cut the business tax rate to 21 percent from 35 percent and freed up cash, a part of which companies are likely to have passed on to shareholders. Also, the rise in buybacks vis-à-vis dividends is due to the treatment of buybacks as capital gains (if stock prices rise), which is taxed at a lower rate than dividends (treated as income).
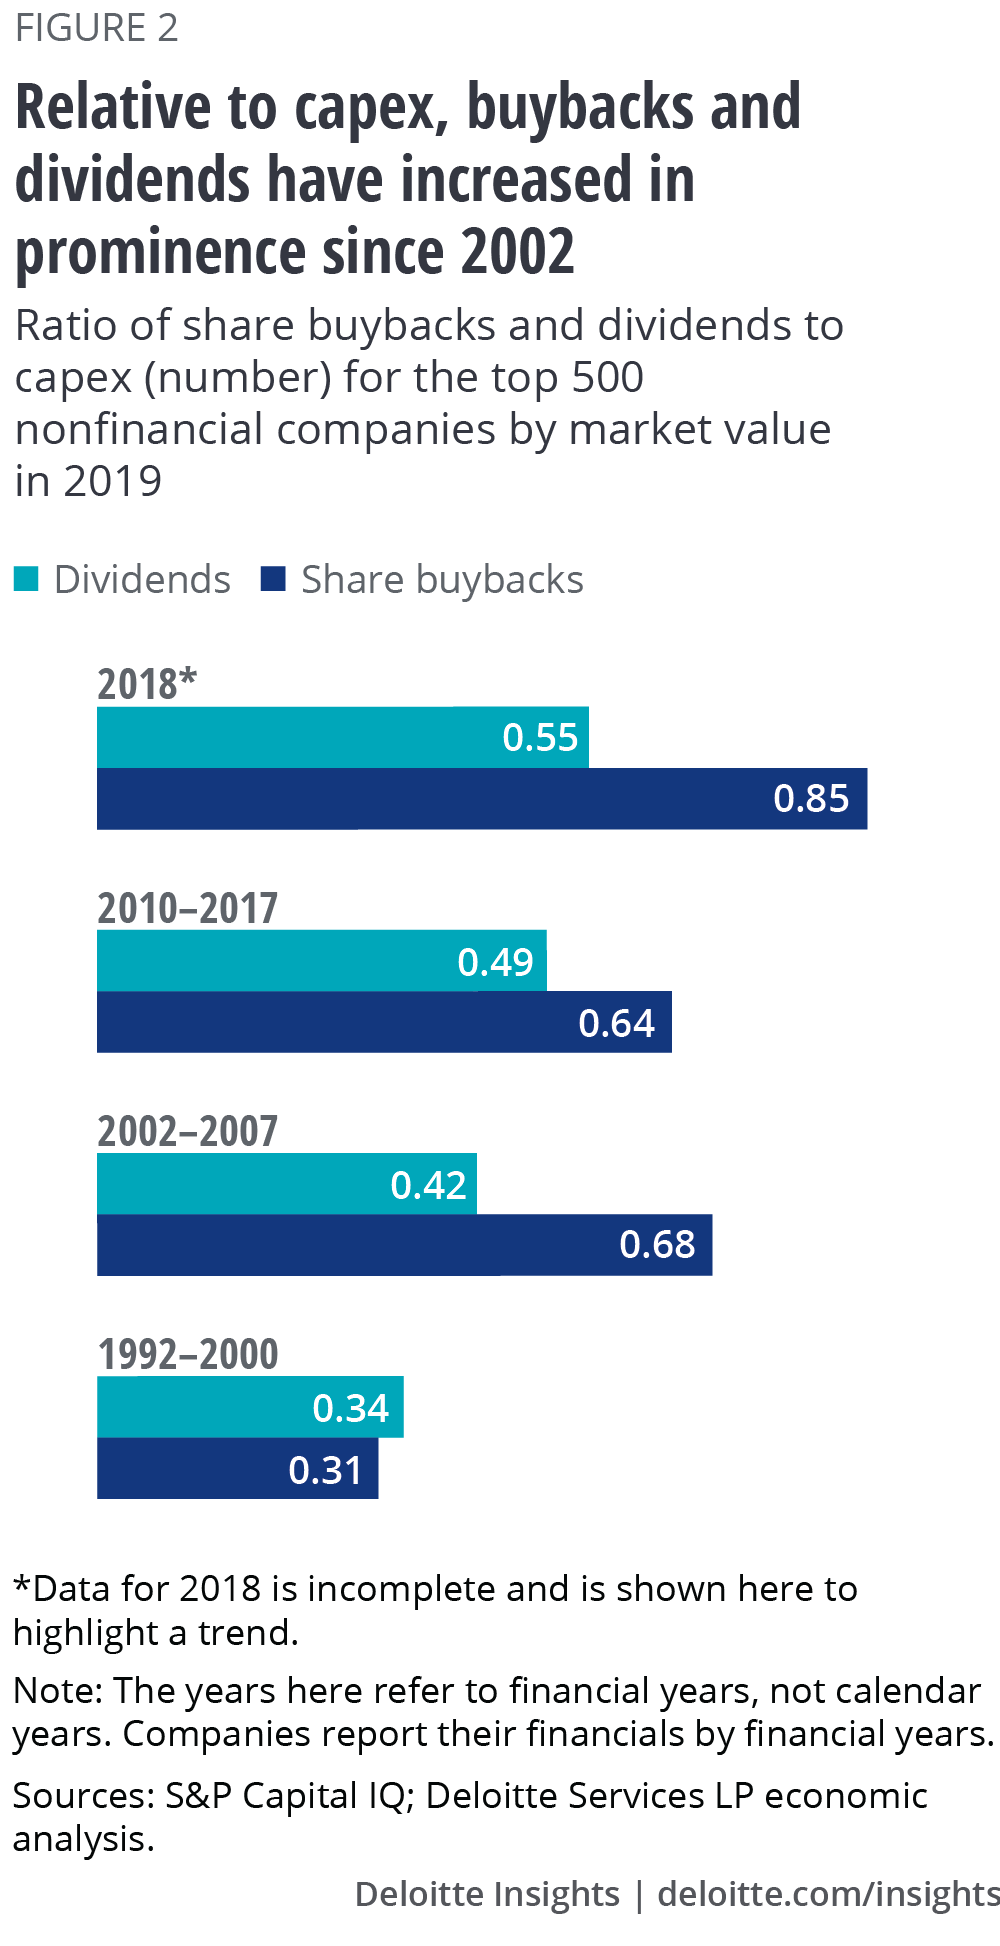
As a result, the ratio of buybacks and dividends to capex has gone up (figure 2). During the 1992–2000 recovery, for example, the ratio of buybacks to capex was about 0.31; it was 0.64 during 2010–2017 and went up further in 2018. Interestingly, figure 2 also reveals that buybacks and dividends are more in vogue in the new millennium, including the period of the current recovery, compared to the past (indeed, stock buybacks were banned by the Securities and Exchange Commission until 1982).
Who’s leading the buyback surge?
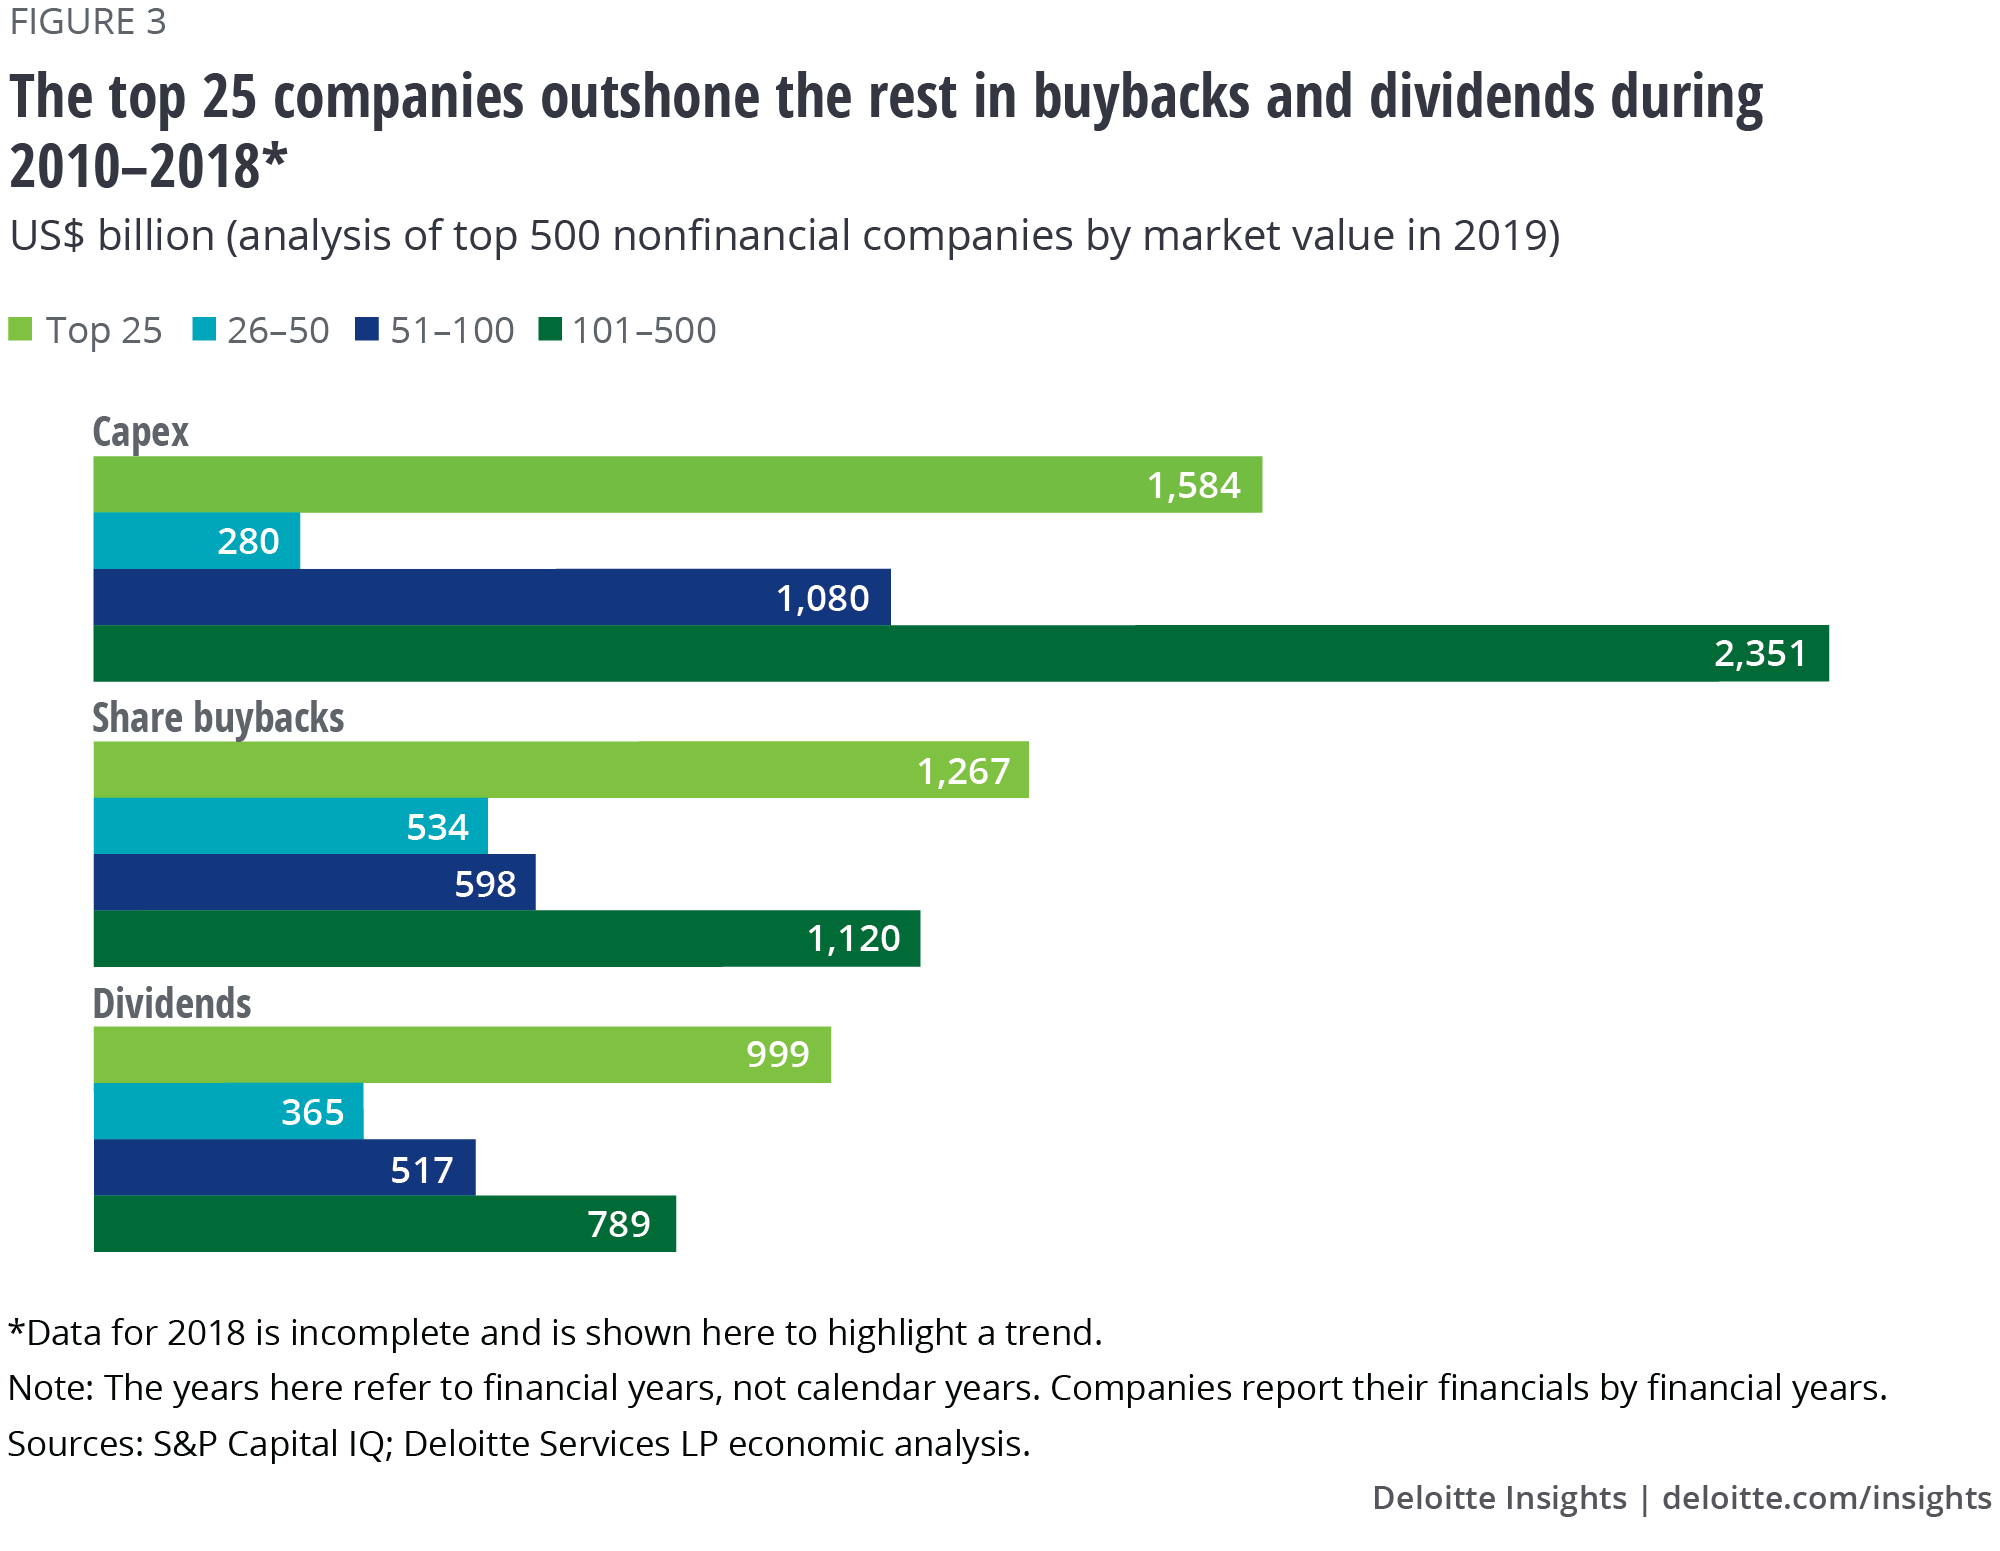
The top 25 companies stand out in terms of their contribution (more than a third) to the total value of buybacks during the current economic recovery, although the 101–500 group is not far behind. A similar trend plays out for dividends (figure 3). In terms of capex, however, the top 25 lags the 101–500 group, implying that relative to capex, the top 25 companies, taken together, have been particularly strongly focused on returning money to shareholders rather than investing during this recovery.

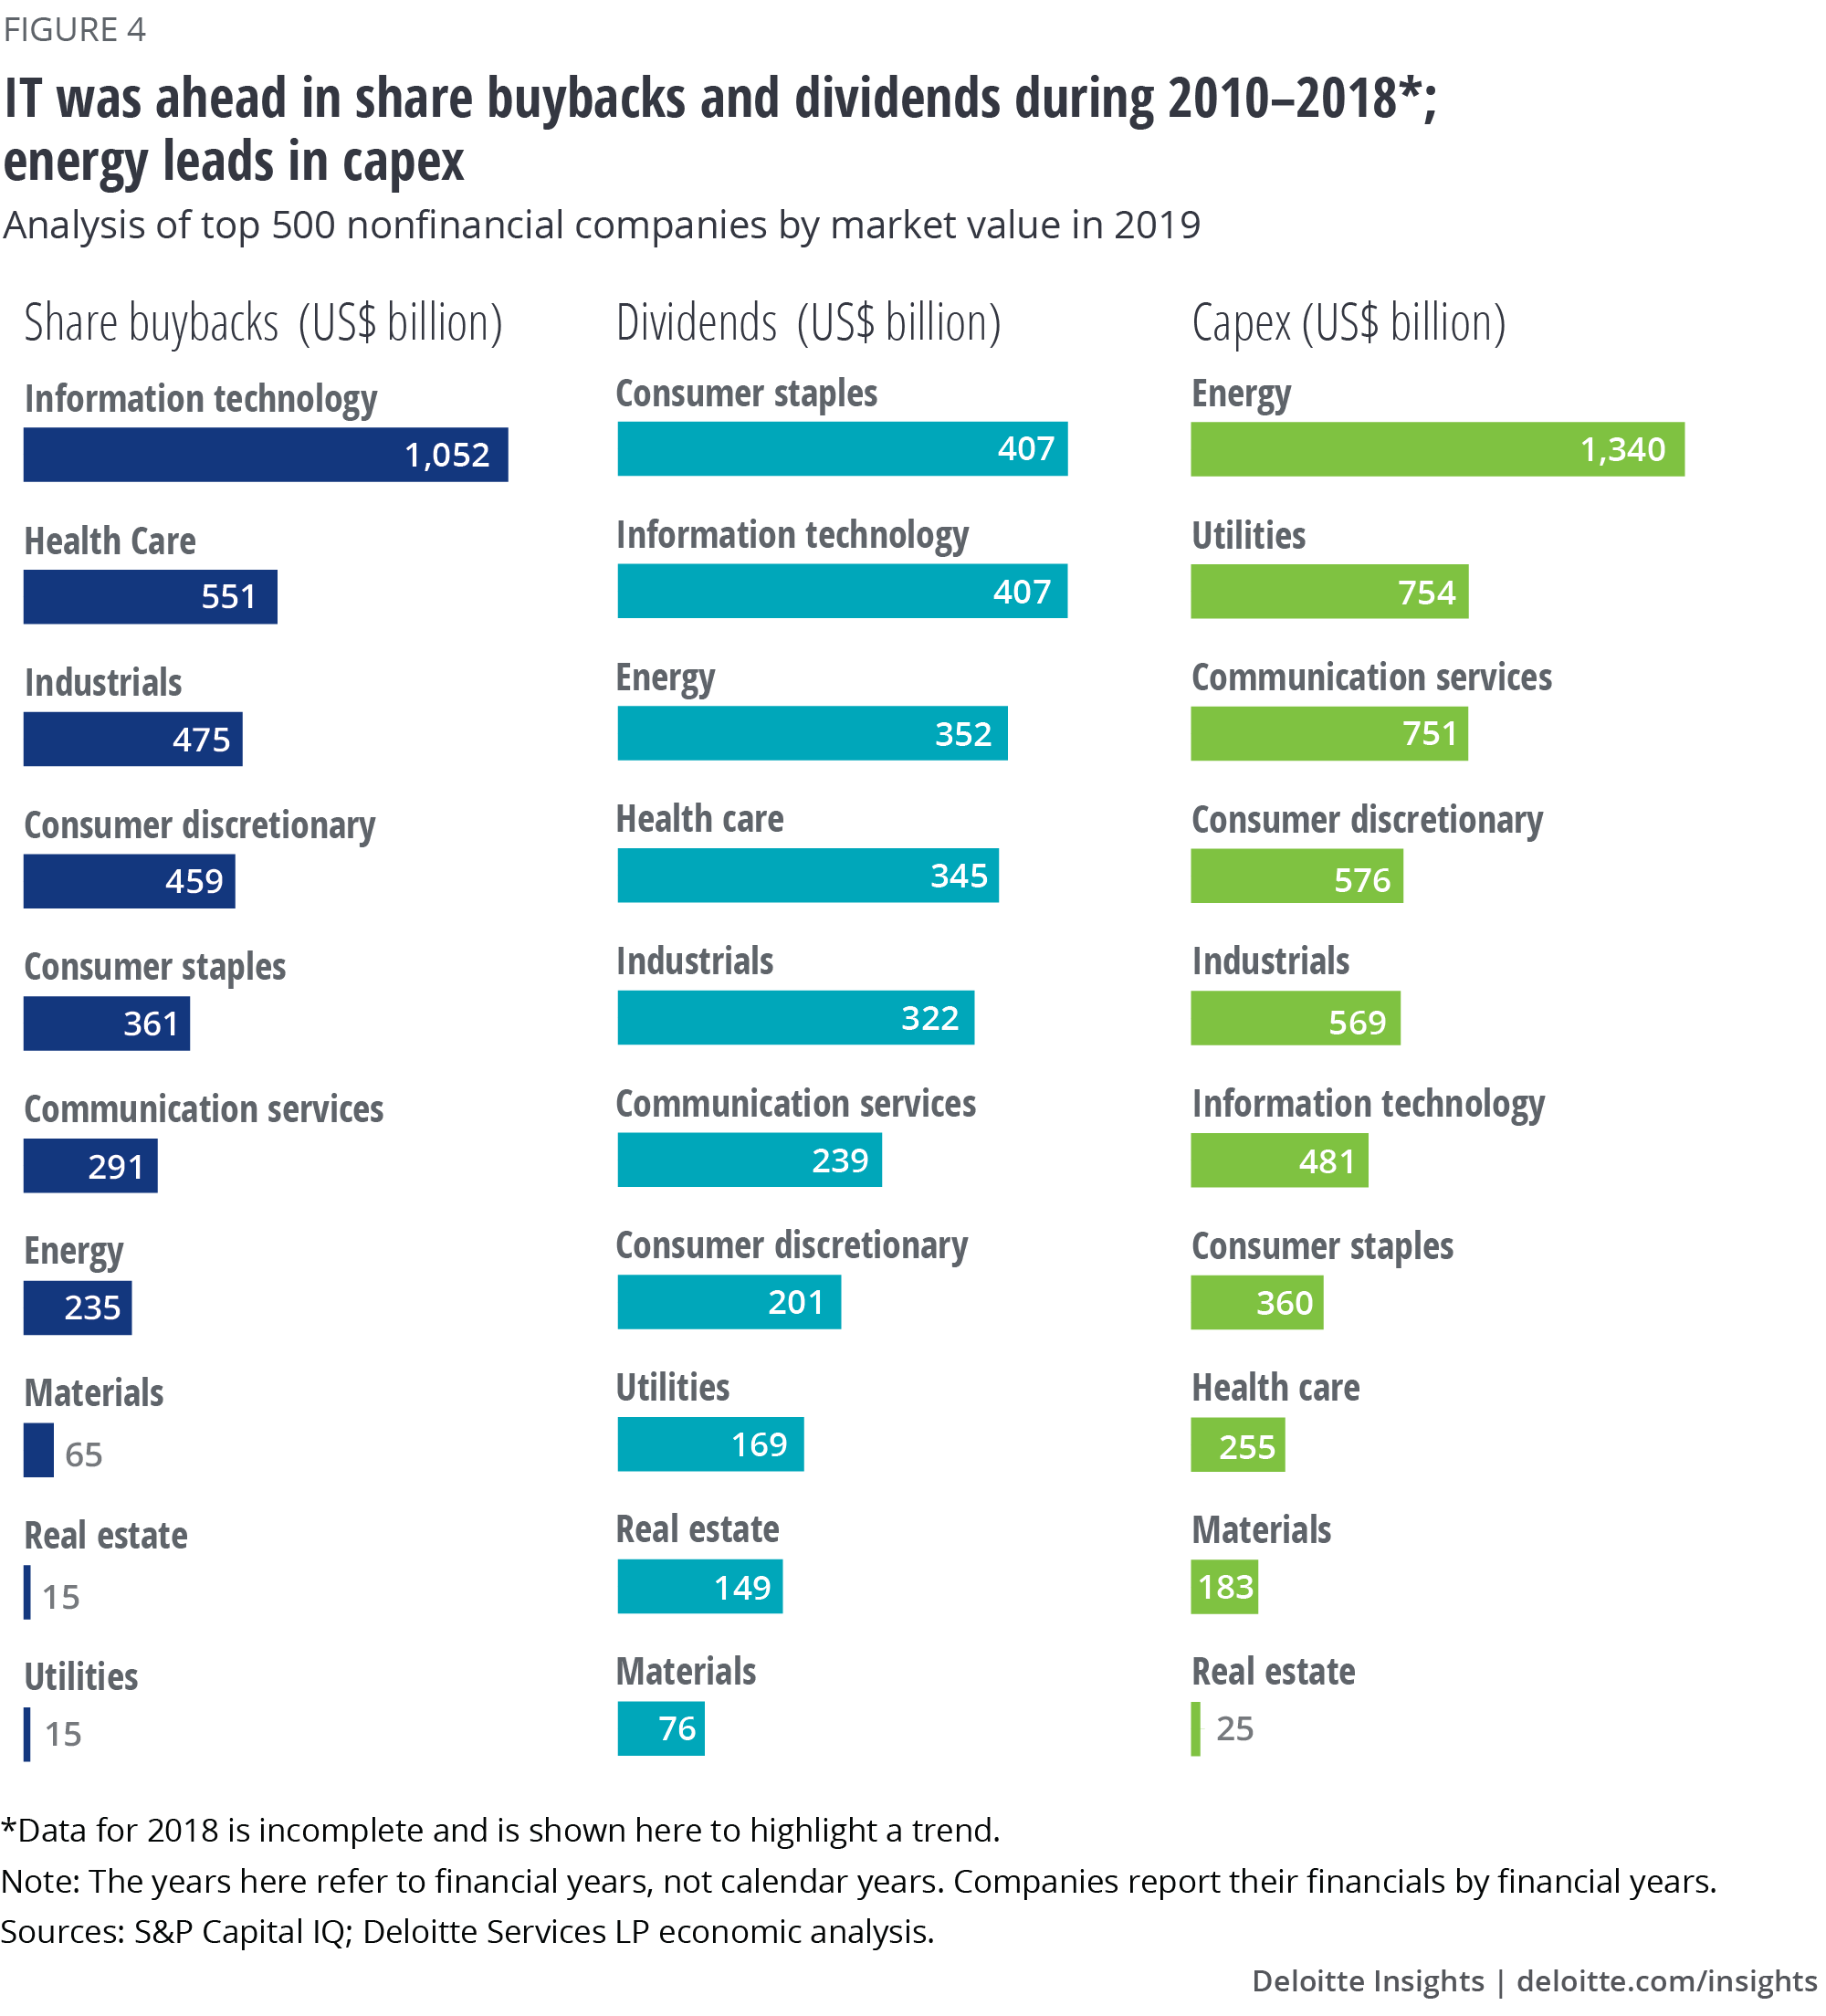
The value of buybacks during the current recovery stands out for information technology (IT). Between 2010 and 2017, companies in the IT sector in our list of 500 companies spent the most of any sector on share buybacks (US$819.7 billion), with a further US$232.3 billion in 2018. The communication services sector, however, had the highest growth (26 percent) during 2010–2017. IT also paid out the second-highest amount of dividends (after consumer staples) (figure 4). However, figure 4 also shows that IT is not a top industry in terms of capex; it’s the energy sector that leads the pack.

All’s well that ends well?
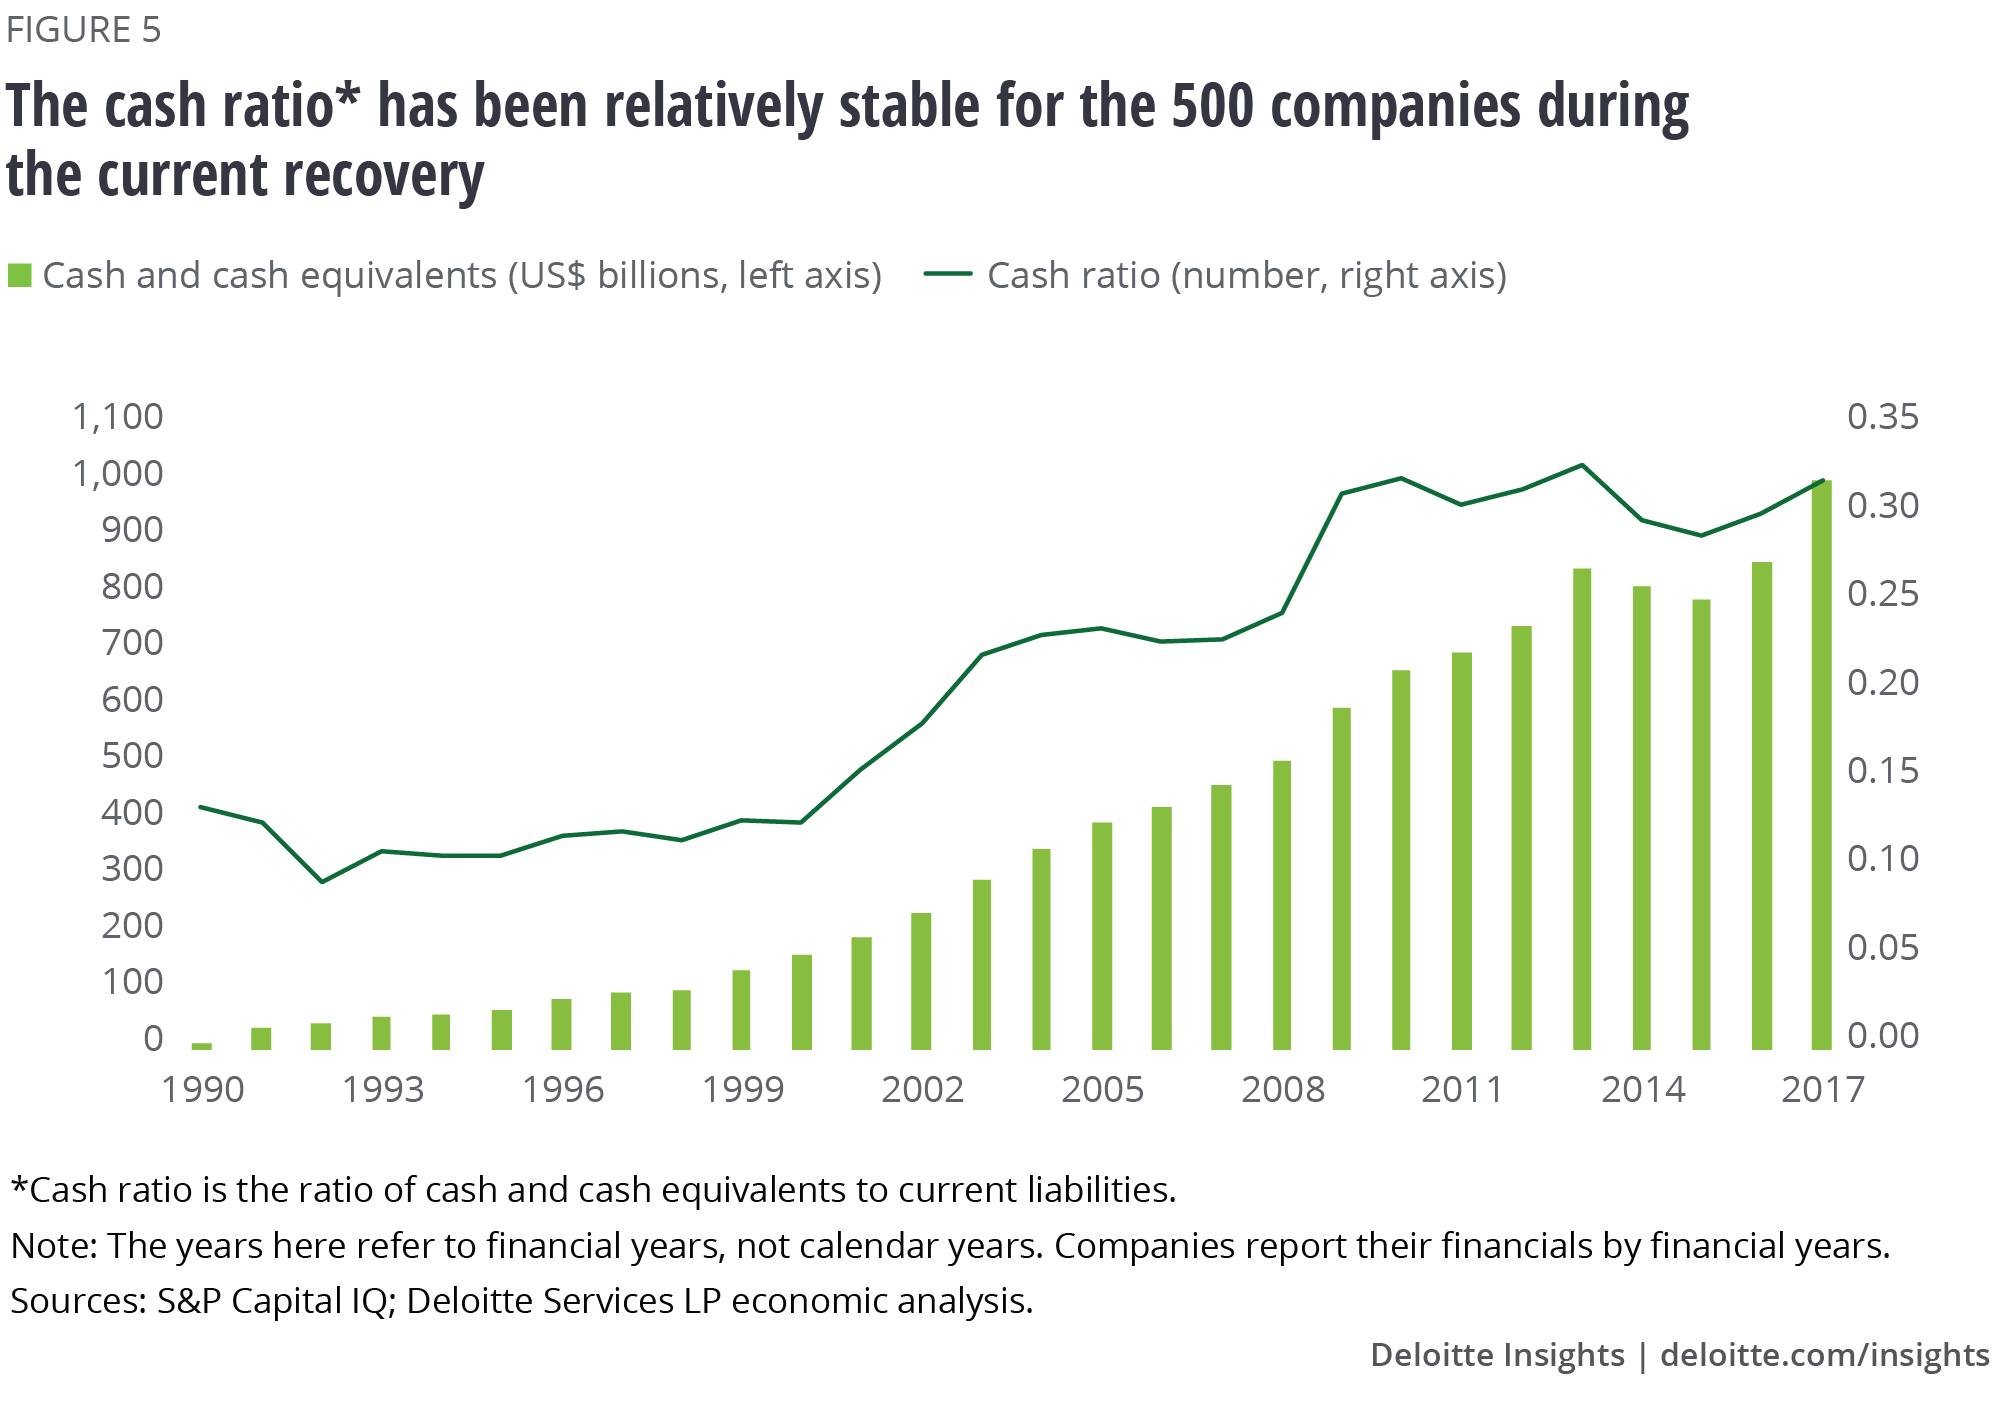
Focusing more on share buybacks and dividends relative to capex may seem a good strategy to boost earnings per share in the short term,6 but many economists are divided on its impact on productivity growth in the medium to long term. And coming as it is at a time of high leverage, companies may do well to use available funds more judiciously, especially when interest rates are rising, and economic activity is expected to slow during 2019–2020.7 Although companies’ cash reserves relative to current liabilities (including interest payments on long-term debt) has been relatively stable during the current recovery (figure 5)—cash and cash equivalents may have likely declined in 2018—previous recessions have shown how things can quickly turn for the worse.

The surge in buybacks and dividends also highlights another concern for the US economy—growing wealth inequality.8 After all, households that hold shares tend to gain more from buybacks and dividends, and the more they own such shares, the wealthier they get.9 And given recent household asset trends,10 buybacks and dividends may just serve to widen the wealth divide further.
© 2021. See Terms of Use for more information.
Explore more economics content
-
Voice of Asia Collection
-
US Economic Forecast Collection
-
Issues by the Numbers Collection
-
Economics: Asia Pacific Collection
-
Economics: Americas Collection


