Deloitte Insights and our research centers deliver proprietary research designed to help organizations turn their aspirations into action.

DELOITTE INSIGHTS

  • Home
  • Spotlight
    • Weekly Global Economic Outlook
    • Top 10 Reading Guide
    • Future of Sports
    • Technology Management
    • Growth & Competitive Advantage
  • Topics
    • Economics
    • Environmental, Social, & Governance
    • Operations
    • Strategy
    • Technology
    • Workforce
    • Industries
  • More
    • About
    • Deloitte Insights Magazine
    • Press Room Podcasts

DELOITTE RESEARCH CENTERS

  • Cross-Industry
    • Home
    • Workforce Trends
    • Enterprise Growth & Innovation
    • Technology & Transformation
    • Environmental & Social Issues
  • Economics
    • Home
    • Consumer Spending
    • Housing
    • Business Investment
    • Globalization & International Trade
    • Fiscal & Monetary Policy
    • Sustainability, Equity & Climate
    • Labor Markets
    • Prices & Inflation
  • Consumer
    • Home
    • Automotive
    • Consumer Products
    • Food
    • Retail, Wholesale & Distribution
    • Hospitality
    • Airlines & Transportation
  • Energy & Industrials
    • Home
    • Aerospace & Defense
    • Chemicals & Specialty Materials
    • Engineering & Construction
    • Mining & Metals
    • Oil & Gas
    • Power & Utilities
    • Renewable Energy
  • Financial Services
    • Home
    • Banking & Capital Markets
    • Commercial Real Estate
    • Insurance
    • Investment Management
    • Cross Financial Services
  • Government & Public Services
    • Home
    • Defense, Security & Justice
    • Government Health
    • State & Local Government
    • Whole of Government
    • Transportation & Infrastructure
    • Human Services
    • Higher Education
  • Life Sciences & Health Care
    • Home
    • Hospitals, Health Systems & Providers​
    • Pharmaceutical Manufacturers​
    • Health Plans & Payers​
    • Medtech & Health Tech Organizations
  • Tech, Media & Telecom
    • Home
    • Technology
    • Media & Entertainment
    • Telecommunications
    • Semiconductor
    • Sports
Deloitte.com
Deloitte Insights logo
  • SPOTLIGHT
    • Weekly Global Economic Outlook
    • Top 10 Reading Guide
    • Future of Sports
    • Technology Management
    • Growth & Competitive Advantage
  • TOPICS
    • Economics
    • Environmental, Social, & Governance
    • Operations
    • Strategy
    • Technology
    • Workforce
    • Industries
  • MORE
    • About
    • Deloitte Insights Magazine
    • Press Room Podcasts
    • Research Centers
  • Welcome!

    For personalized content and settings, go to your My Deloitte Dashboard

    Latest Insights

    Creating opportunity at the intersection of climate disruption and regulatory change

    Article
     • 
    7-min read

    Better questions about generative AI

    Article
     • 
    2-min read

    Recommendations

    Tech Trends 2025

    Article

    TMT Predictions 2025

    Article

    About Deloitte Insights

    About Deloitte Insights

    Deloitte Insights Magazine, issue 33

    Magazine

    Topics for you

    • Business Strategy & Growth
    • Leadership
    • Operations
    • Marketing & Sales
    • Diversity, Equity, & Inclusion
    • Emerging Technologies
    • Economy

    Watch & Listen

    Dbriefs

    Stay informed on the issues impacting your business with Deloitte's live webcast series. Gain valuable insights and practical knowledge from our specialists while earning CPE credits.

    Deloitte Insights Podcasts

    Join host Tanya Ott as she interviews influential voices discussing the business trends and challenges that matter most to your business today. 

    Subscribe

    Deloitte Insights Newsletters

    Looking to stay on top of the latest news and trends? With MyDeloitte you'll never miss out on the information you need to lead. Simply link your email or social profile and select the newsletters and alerts that matter most to you.

Welcome back

To join via SSO please click on the key button below
Still not a member? Join My Deloitte

Wealth inequality: The reasons behind the growing gap

by Akrur Barua
  • Save for later
  • Share
    • Share on Facebook
    • Share on Twitter
    • Share on Linkedin
    • Share by email
25 June 2018

Wealth inequality: The reasons behind the growing gap Economics Spotlight, June 2018

26 June 2018
  • Akrur Barua India
  • Save for later
  • Share
    • Share on Facebook
    • Share on Twitter
    • Share on Linkedin
    • Share by email
  • If a household earns more, it can add more to its wealth
  • More assets it owns, the wealthier a household can get
  • Riskier assets imply higher returns and, hence, more wealth
  • The trend is unlikely to change any time soon

The net worth gap between the top 10 percent of US households and the bottom 25 percent continues to widen. A review of the Federal Reserve’s Survey of Consumer Finances provides insight as to why this gap is expanding.

Wealth inequality in the United States may be one of the more troubling features of the current US economy. In 2016, for example, the real median net worth of the top 10 percent of households (by net worth) was about 24,000 times the corresponding value for the bottom 25 percent.1 If you find that a bit tough to digest, here likely is a bigger surprise: Wealth inequality has gone up over time; back in 1992, for example, the above-mentioned ratio was much lower (just 1,300). What explains this chasm in wealth among households? And why is the gap widening? To find out, we dip into the Federal Reserve’s Survey of Consumer Finances (SCF), which provides some of the leading information on the wealth of US households—who owns the wealth and how they invest it.

Learn More

Explore the Economics Spotlight collection

Subscribe to receive more economics content

The data from the SCF throws up multiple insights. First, the wealthiest households in the country are also the highest income earners and the gap in income between them and poorer households has gone up over the years. Second, because the wealthiest households have more assets than poorer ones, they have higher investment incomes. Third, asset portfolios of the wealthy include more of stocks and real estate—riskier than the transaction accounts that hold much of the wealth of poorer households, but, with higher returns over time. As a result, asset accumulation for the wealthiest has increased at a faster pace than that for those at the bottom of the wealth ladder.

If a household earns more, it can add more to its wealth

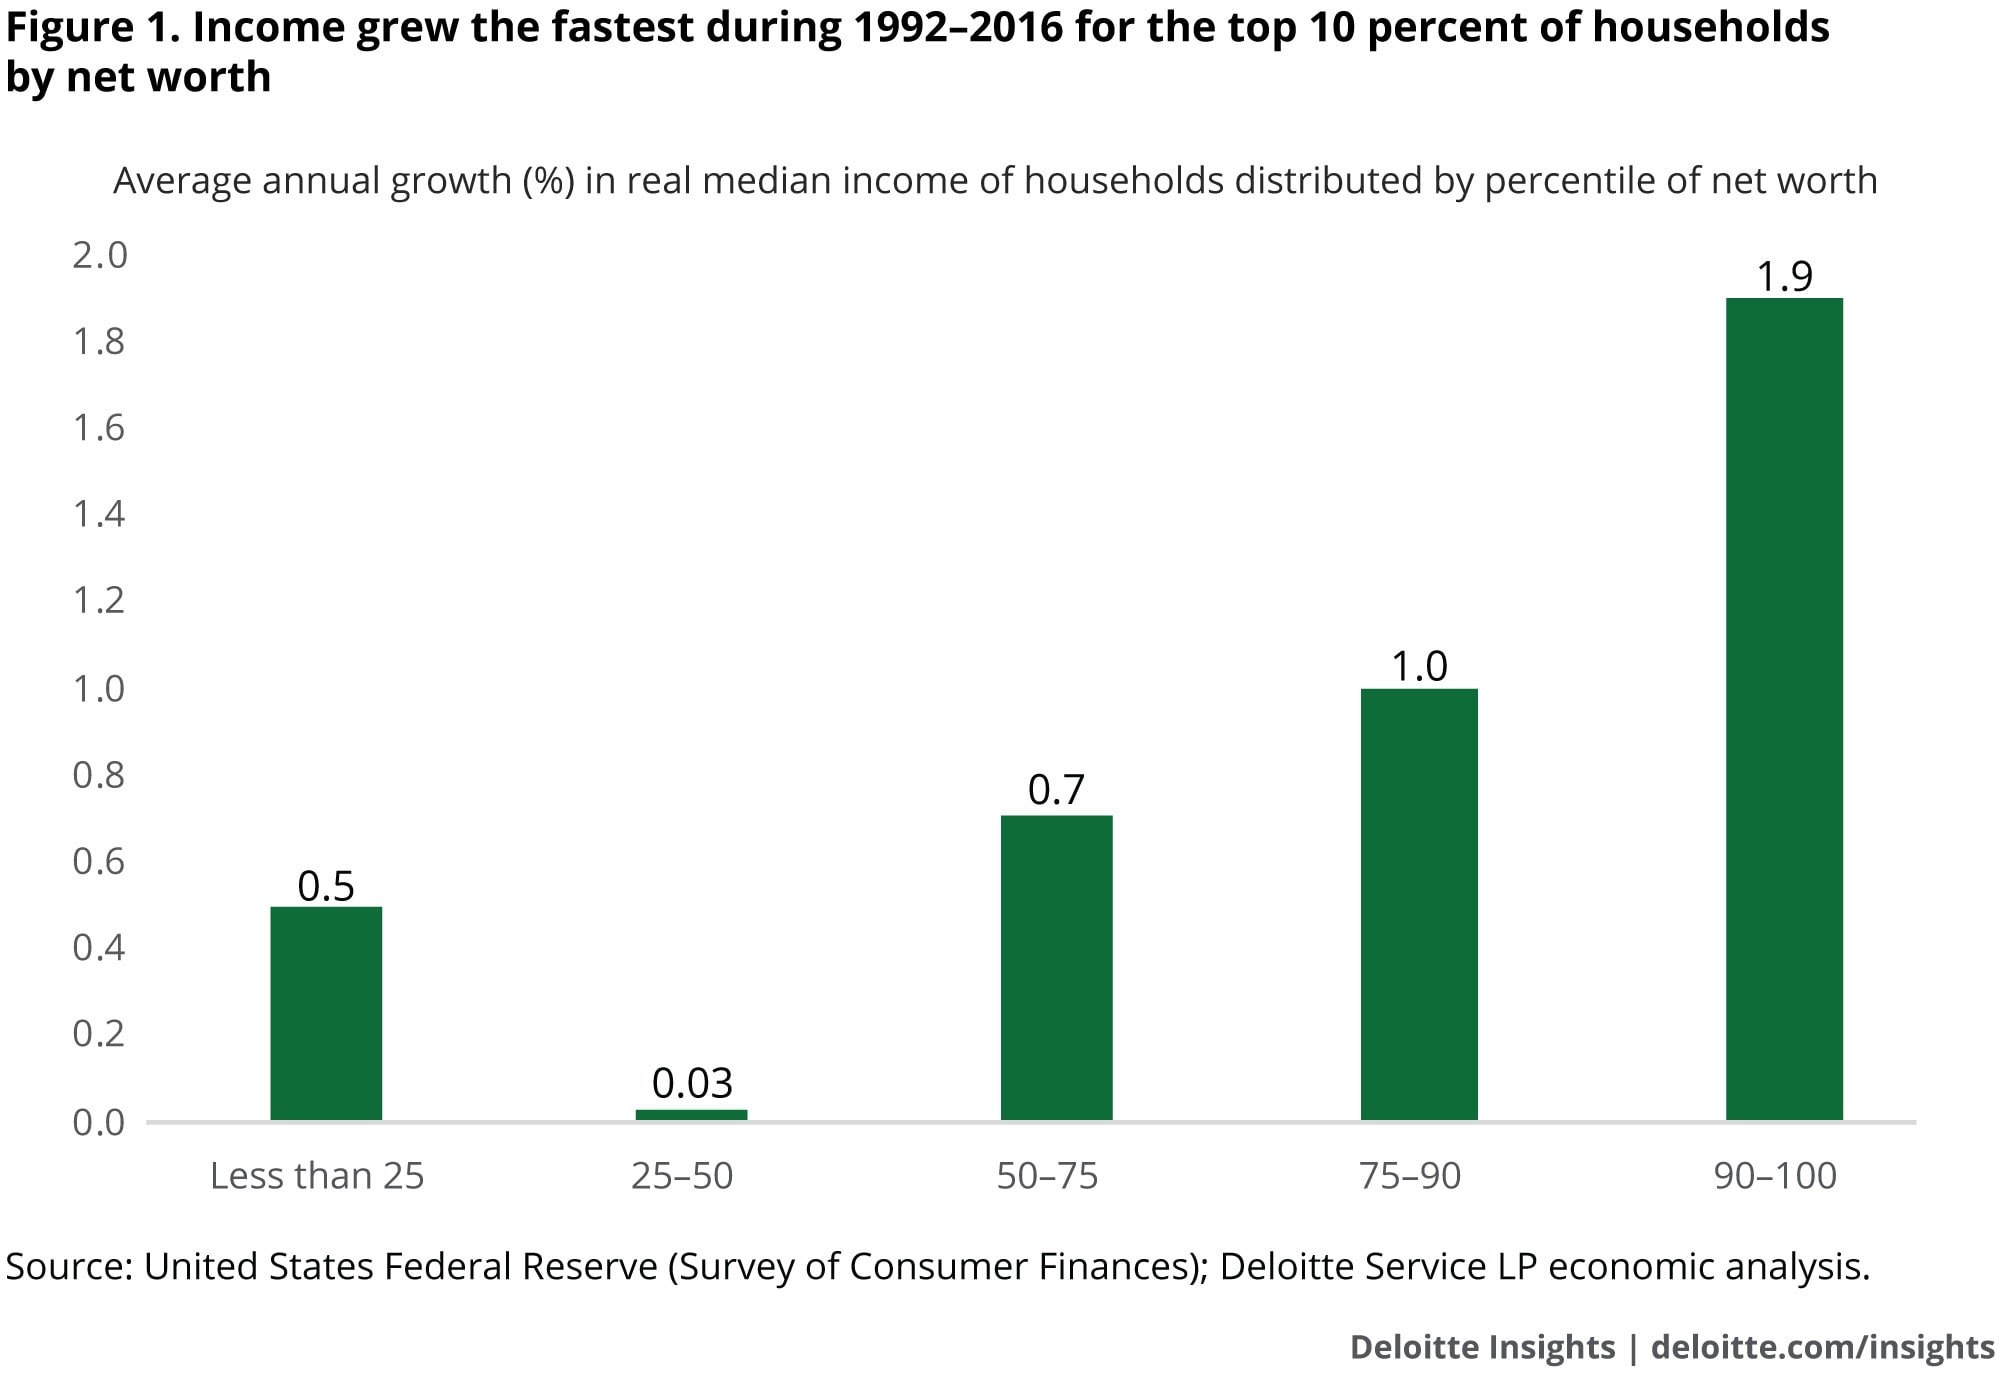
The wealthiest households not only earn more, but, their incomes have been growing faster than others. In 2016, real median income for the top 10 percent of households by net worth was $215,700, about 8.5 times the corresponding figure for the bottom 25 percent of households. Back in 1992, the ratio was lower (6.1). Between 1992 and 2016, real median income for the wealthiest 10 percent of households grew at an average annual rate of 1.9 percent; the corresponding rise for households at the bottom 25 percent was 0.5 percent. Figure 1 shows how incomes have been rising faster for wealthier households.

Income grew the fastest during 1992–2016 for the top 10 percent of households by net worth

More assets it owns, the wealthier a household can get

In 2016, the real median value of asset holdings of the wealthiest 10 percent of households who held any asset—financial or nonfinancial—was close to $2.6 million. This was 361 times the value of holdings for households in the bottom 25 percent (see figure 2). And this ratio was much higher than what it was in 1992 (192). Figure 2 also shows that the real median value of assets between 1992 and 2016 has increased the most for the wealthiest 10 percent of households. The story does not change much if we compare households against their holdings of financial and nonfinancial assets. In 2016, the wealthiest 10 percent households who held any financial asset had financial assets with a real median value of about $1.3 million; for the top-wealth households who held nonfinancial assets, the real median value of such assets was $1.2 million. In contrast, households at the bottom 25 percent of net worth, which had financial assets, owned just $1,000; and for those who owned nonfinancial assets, the median value was just $9,200.

The wealthiest households witnessed their asset values rise by the most during 1992–2016

Riskier assets imply higher returns and, hence, more wealth

An analysis of the asset portfolios of households reveals that the wealthiest households are more likely to own stocks—both direct and indirect holdings—and own relatively more stocks. Table 1 shows that of the top 10 percent of households by net worth in 2016, 50.6 percent of them held stocks directly compared to only 2.1 percent for households in the bottom 25 percent. And of those households that held stocks directly, the real median value of such holdings for the top 10 percent was $200,000, compared to just $1,700 for the bottom 25 percent.

Table 1 also reveals that the wealthiest households have relatively larger indirect holdings of stocks (such as retirement accounts, pooled investment funds, and other managed assets). The same holds true for holdings in real estate, including primary residence, other residential property, and equity in nonresidential property. And as figure 3 highlights, while the median value of key risky holdings—equity and real estate-related—has gone up over the years for the top 10 percent of households by net worth, the median value of holdings of similar assets (except for primary residence) of the bottom 25 percent of households have not made much headway.

The wealthiest households hold riskier (and higher-return) assets (2016 figures)The value of key asset holdings has not changed much for the bottom 25 percent

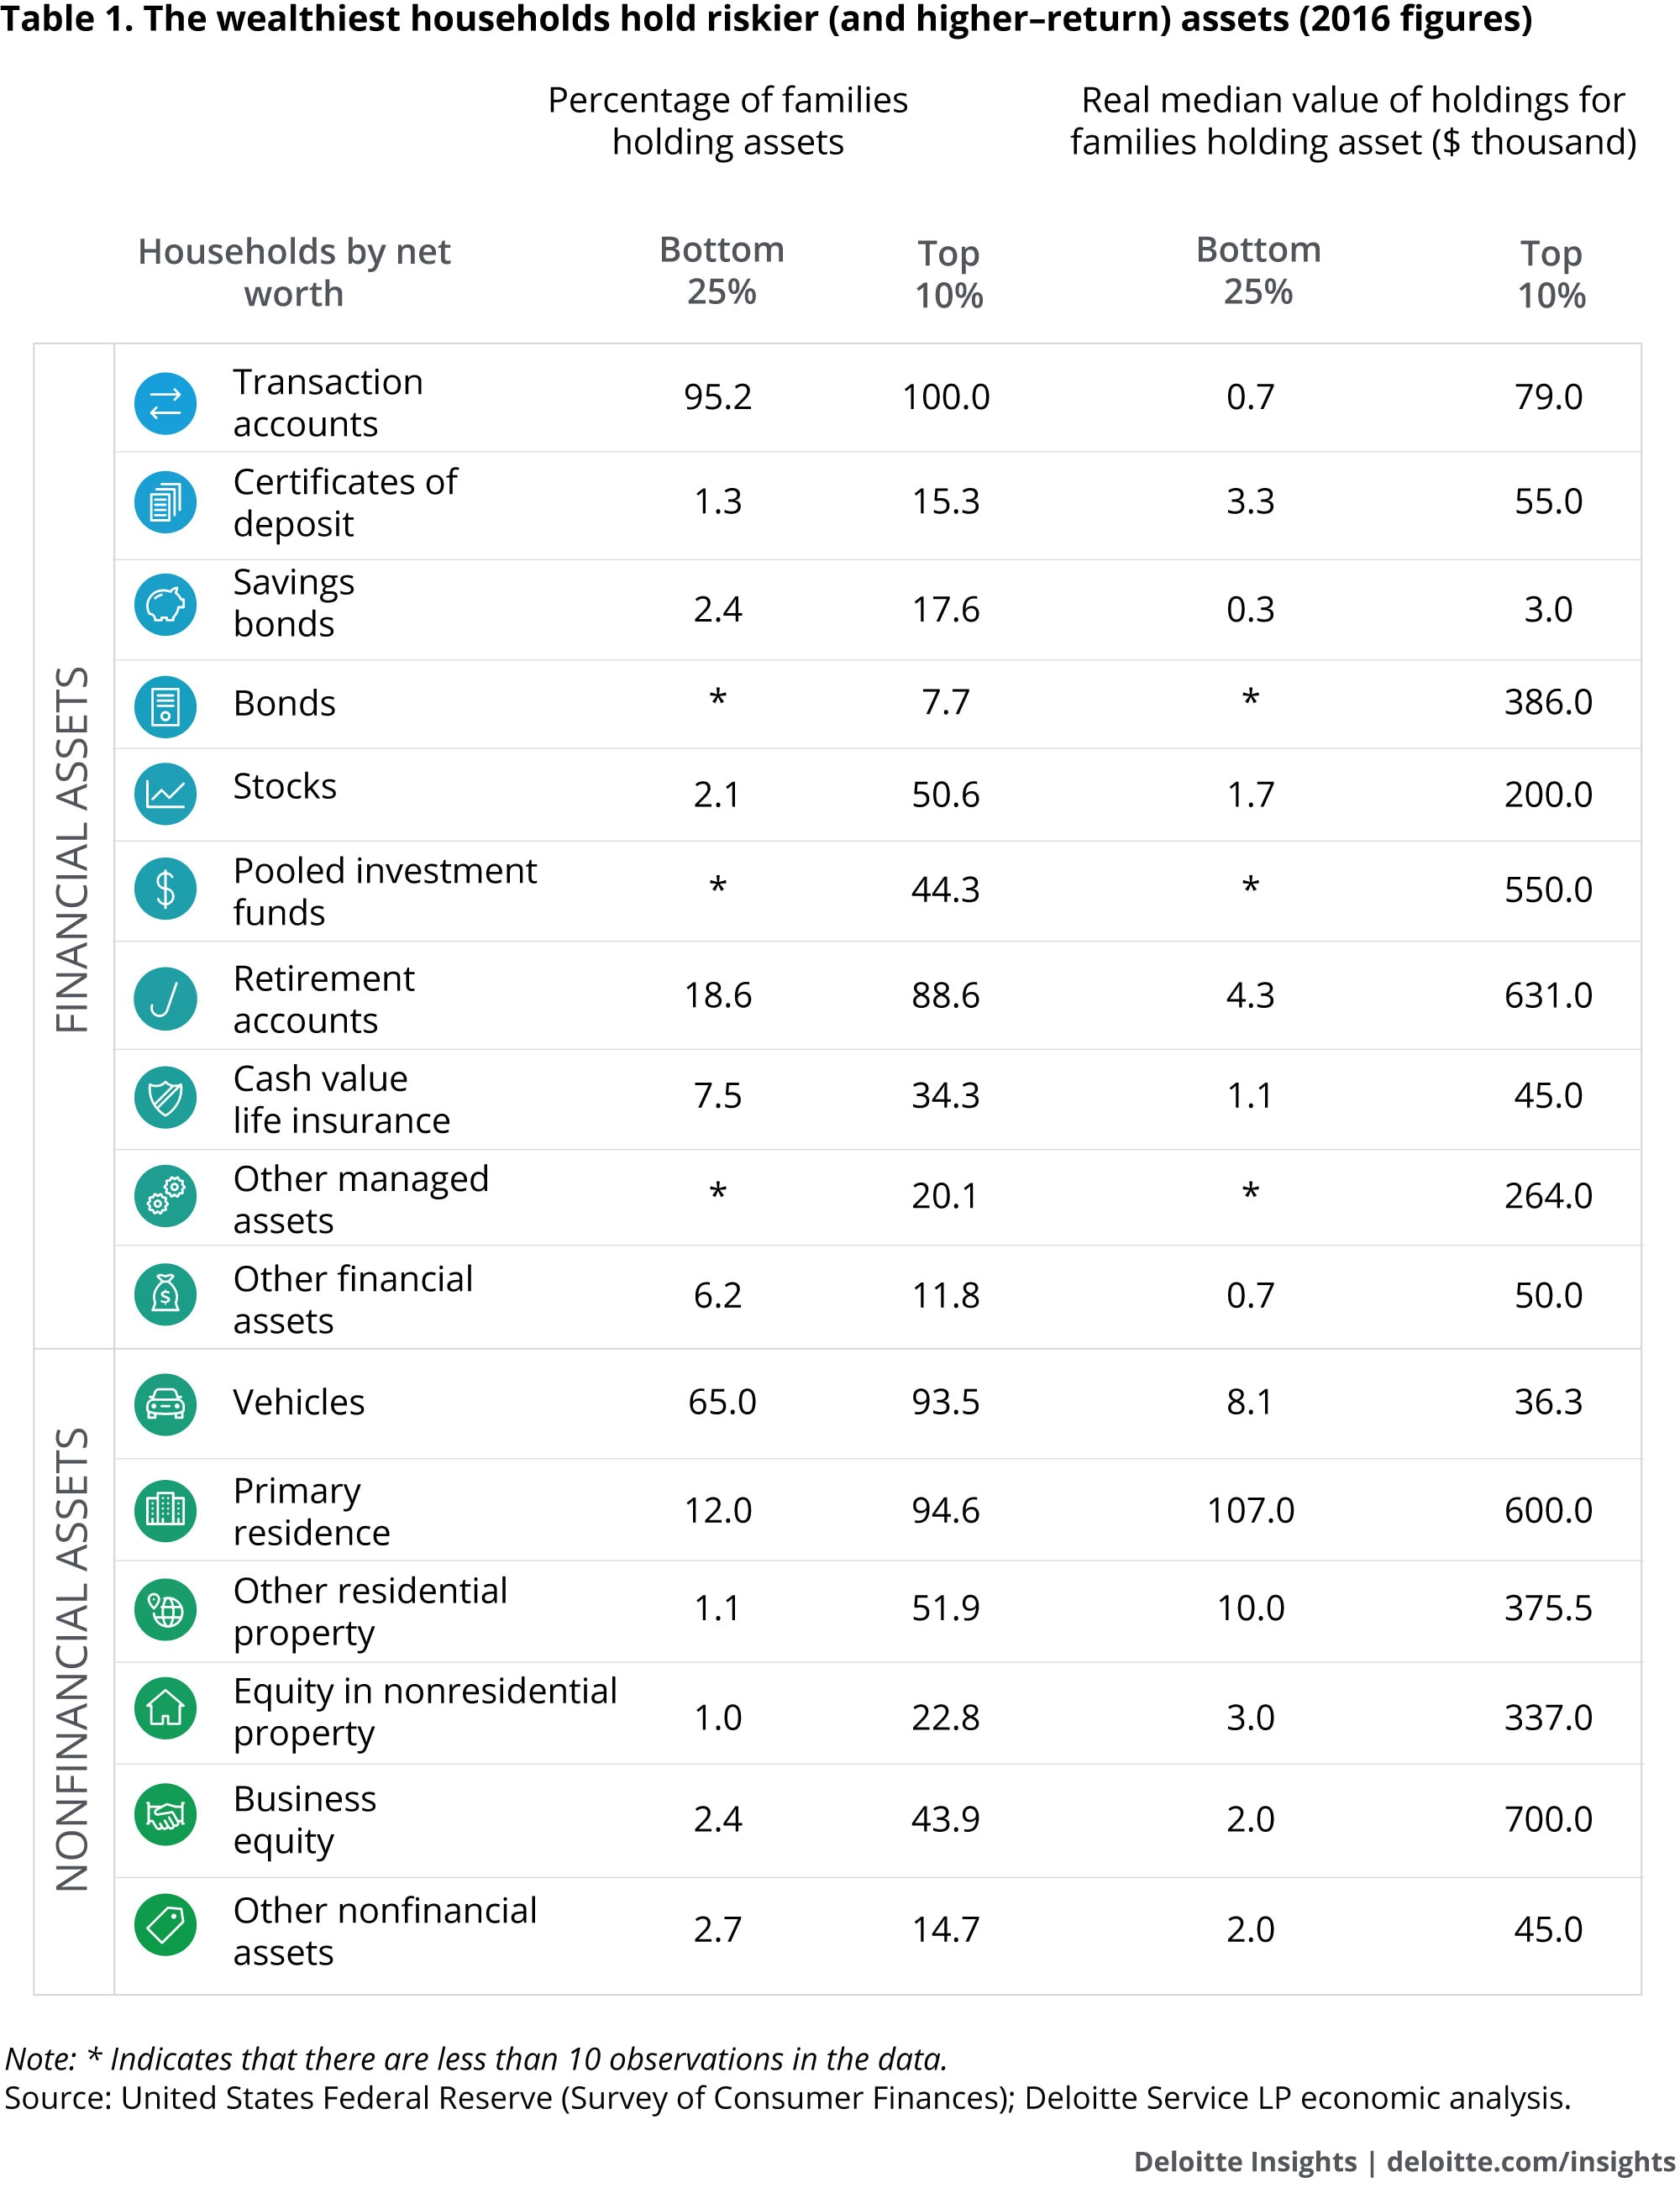
Households at the bottom 25 percent are more likely to own assets that do not yield much or any returns, such as transaction accounts. About 95.2 percent of such households have transaction accounts, almost close to the 100 percent figure for the top 10 percent of households by net worth. Yet, even here, there is a vast difference in the median value of such accounts between the top 10 percent and the bottom 25 percent (see table 1).

The trend is unlikely to change any time soon

Not only are their incomes rising by less than the wealthiest, poorer households appear less likely to save as well. The latter, for example, are using up more of their income to repay debt. In 2016, the leverage ratio (ratio of liabilities to assets) for the bottom 25 percent of households by net worth was a staggering 141.6 percent (but just 4.8 percent for the top 10 percent) and these households spent about 13.1 percent of their family income in repaying debt (just 6.7 percent for the top 10 percent). Unless they are using this debt to acquire assets such as a home, they are not likely to be able to accumulate wealth under these conditions. This suggests that poorer households may be substantially handicapped in their ability to acquire assets.

Author

Akrur Barua is an economist and is based in Mumbai, India.

Acknowledgments

Cover image by: Emily Moreano

Endnotes
    1. United States Federal Reserve, “Survey of Consumer Finances,” accessed May 2018. All data for this article has been sourced from the Survey of Consumer Finances. View in article

Show moreShow less

Topics in this article

Economics , Behind the Numbers , Americas Economics

Deloitte Consulting

View

Download Subscribe

Related

img Trending

Interactive 3 days ago

Akrur Barua

Akrur Barua

Associate Vice President | Deloitte Services India Pvt. Ltd.

Akrur Barua is an economist with the Research & Insights team. As a regular contributor to several Deloitte Insights publications, he often writes on emerging economies and macroeconomic trends that have global implications like monetary policy, real estate cycles, household leverage, and trade. He also studies the US economy, especially demographics, labor market, and consumers.

  • abarua@deloitte.com
  • +1 678 299 9766

Share article highlights

See something interesting? Simply select text and choose how to share it:

Email a customized link that shows your highlighted text.
Copy a customized link that shows your highlighted text.
Copy your highlighted text.

Wealth inequality: The reasons behind the growing gap has been saved

Wealth inequality: The reasons behind the growing gap has been removed

An Article Titled Wealth inequality: The reasons behind the growing gap already exists in Saved items

Invalid special characters found 
Forgot password

To stay logged in, change your functional cookie settings.

OR

Social login not available on Microsoft Edge browser at this time.

Connect Accounts

Connect your social accounts

This is the first time you have logged in with a social network.

You have previously logged in with a different account. To link your accounts, please re-authenticate.

Log in with an existing social network:

To connect with your existing account, please enter your password:

OR

Log in with an existing site account:

To connect with your existing account, please enter your password:

Forgot password

Subscribe

to receive more business insights, analysis, and perspectives from Deloitte Insights
✓ Link copied to clipboard

Deloitte Insights and our research centers deliver proprietary research designed to help organizations turn their aspirations into action.

Deloitte Insights

  • Home
  • Topics
  • Industries
  • About Deloitte Insights

DELOITTE RESEARCH CENTERS

  • Cross-Industry
  • Economics
  • Consumer
  • Energy & Industrials
  • Financial Services
  • Government & Public Services
  • Life Sciences & Health Care
  • Tech, Media & Telecom
Deloitte logo

Learn about Deloitte’s offerings, people, and culture as a global provider of audit, assurance, consulting, financial advisory, risk advisory, tax, and related services.

© 2025. See Terms of Use for more information.

Deloitte refers to one or more of Deloitte Touche Tohmatsu Limited, a UK private company limited by guarantee ("DTTL"), its network of member firms, and their related entities. DTTL and each of its member firms are legally separate and independent entities. DTTL (also referred to as "Deloitte Global") does not provide services to clients. In the United States, Deloitte refers to one or more of the US member firms of DTTL, their related entities that operate using the "Deloitte" name in the United States and their respective affiliates. Certain services may not be available to attest clients under the rules and regulations of public accounting. Please see www.deloitte.com/about to learn more about our global network of member firms.

  • About Deloitte
  • Terms of Use
  • Privacy
  • Data Privacy Framework
  • Cookies
  • Cookie Settings
  • Legal Information for Job Seekers
  • Labor Condition Applications
  • Do Not Sell My Personal Information