Rising credit card debt and an end to pandemic-era savings are not expected to be major risks for consumers
The September 2024 Economics Insider delves into the question: Should consumers be concerned with rising credit card debt and an end to pandemic savings?


The persistent strength of consumer spending has been a hallmark of the post-pandemic economic recovery seen in the United States. Since the second quarter of 2020—the trough of the last recession1—real personal consumption expenditure has gone up by 24.4%, while GDP has grown by 20.4%.2 While a healthy labor market with strong wage growth has aided consumers,3 it’s not the only factor that has buoyed consumer spending. Pandemic stimulus payments—also known as “economic impact payments”4—which led to an accumulation of excess savings during the COVID-19 pandemic, also supported growth. But now, these savings have been exhausted, according to the economists at the Federal Reserve Bank of San Francisco.5
This end to pandemic savings comes at a time of rising credit card and auto loan delinquencies.6 So, are these risks big enough to erode consumer spending? We believe that is unlikely. First, consumers didn’t spend all their excess savings—they invested in financial assets, as well.7 Hence, households hold more financial assets now than they otherwise would have. Second, while credit card and auto loan delinquencies have risen, these loans are a relatively smaller part of overall household debt. So, while these risks may slow the growth of consumer spending, they are not enough to reverse the gains consumers have seen over the past few years.
The rise and fall of excess savings
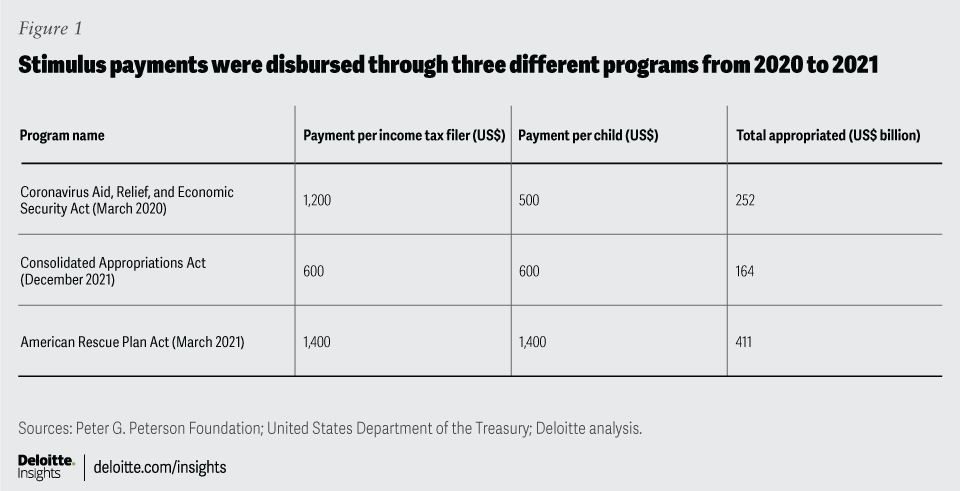
A key source of consumers’ excess savings were economic impact payments. More than 476 million of such payments—totaling more than US$800 billion—were distributed as financial relief under three separate programs in 2020 and 2021 (figure 1).8 These payments were mostly focused on low- and middle-income families and reached nearly 85% of all US households.9 However, households didn’t spend all the money they received from these payments—they also saved some of it. This, in turn, led to a rapid rise in “excess savings.”
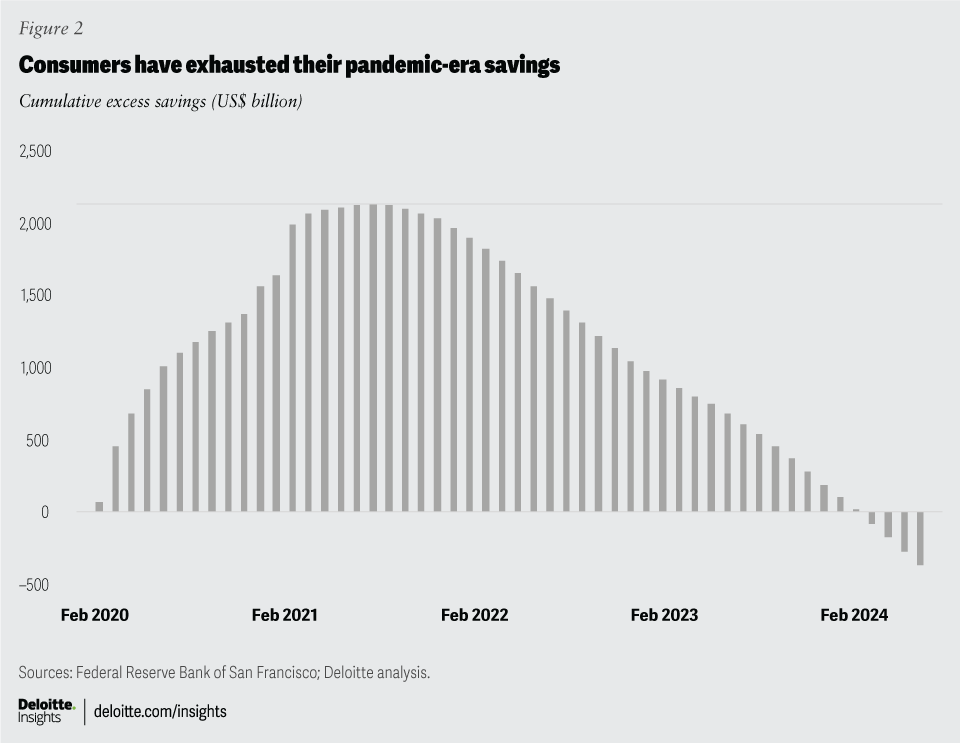
According to a study by economists at the Federal Reserve Bank of San Francisco, excess savings can be defined as “the difference between actual savings and the pre-recession trend—relative to previous recessions.”10 So, how have those excess savings fared? According to the same study, economists estimate that excess savings peaked at US$2.1 trillion in August 2021 before declining (figure 2). By March 2024, excess savings had turned negative, and as of June, the negative drawdown stood at US$372 billion.


Use of excess savings boosted household finances
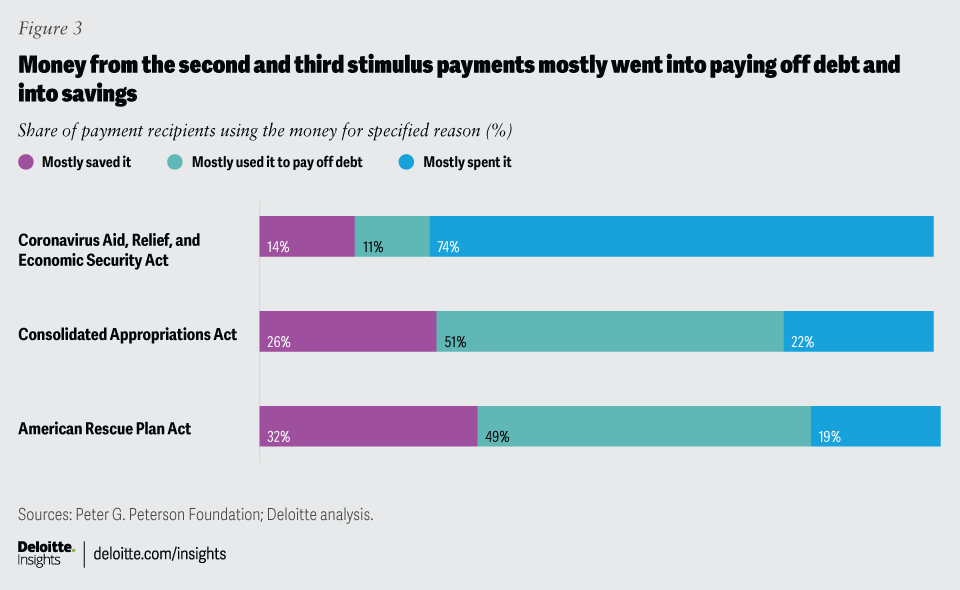
Figure 3 illustrates calculations by the Peterson Foundation (using US Census Bureau data) on how households used stimulus payments.11 Not surprisingly, much of the CARES Act funds went toward paying current expenses. Unemployment had peaked at 14.8% in April 2020, before much—if any—of the CARES Act funds were disbursed. However, the majority of the second two disbursements went toward paying off debts and into savings: These savings, in turn, boosted households’ financial assets.12

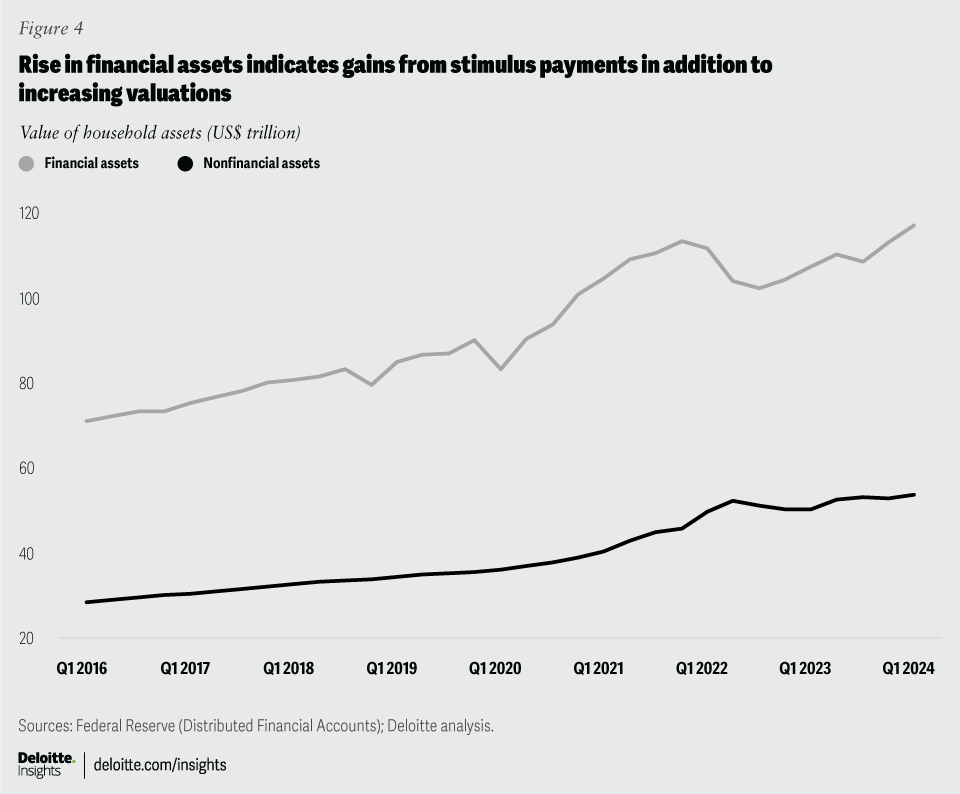
Figure 4 shows a large jump in financial assets between 2020 and 2021—a surge that represents a deviation from pre-pandemic patterns. In contrast, nonfinancial assets grew more gradually.13 While some of this gain in financial assets can be attributed to rising equity markets,14 increases in financial assets outside of corporate equities and mutual funds indicate additional investments.
So, even though the excess savings pool has been dried up, households still have a strong asset buffer—especially in the form of financial assets—to tide over downturns, should one occur.

Household debt has gone up but the ability to service it is still high
Household debt has been steadily edging up since the second quarter of 2021, although its pace has slowed in recent quarters.15 By the second quarter of 2024, US households had accumulated US$17.8 trillion of debt. Nevertheless, the size of this debt looks less worrying compared to disposable personal income, which indicates the ability to service this debt. In the second quarter of this year, total household debt as a share of disposable personal income16 was 85.2%, much lower than the peak of 116.8% during the global financial crisis of 2007 to 2009.
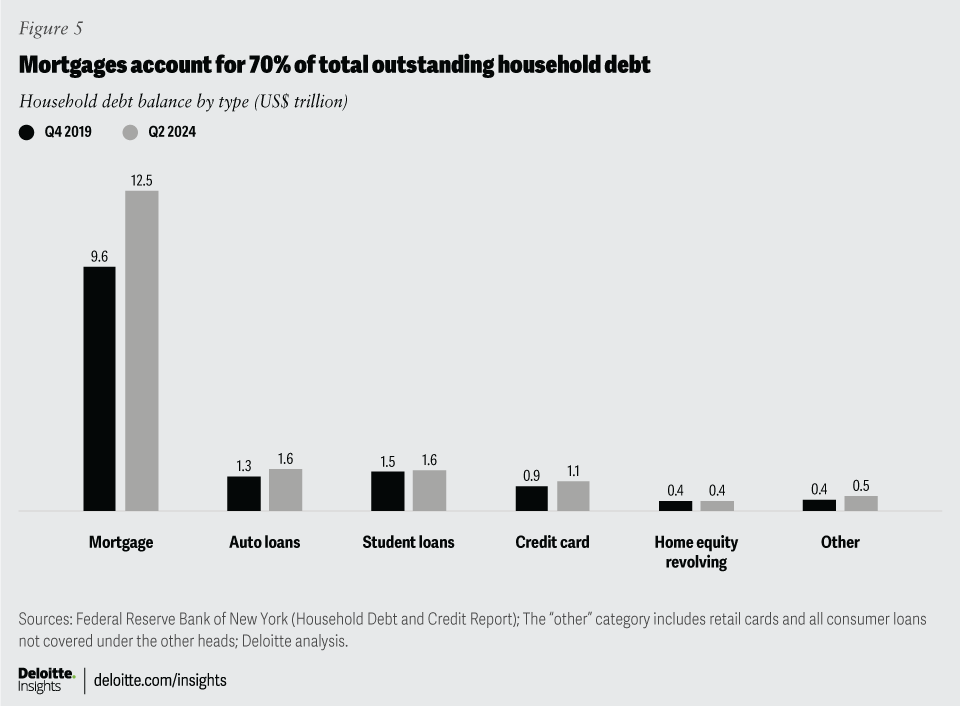
Figure 5 highlights the composition of total household debt outstanding in the second quarter of this year and its comparison with the period just before the pandemic.17 At US$12.5 trillion in the second quarter of 2024, mortgage debt accounts for the largest share (about 70%) of total household debt outstanding, followed by auto loans (9.1%) and student loans (8.9%). The outstanding value of mortgage debt has grown the fastest (31%) since the last quarter of 2019 with credit card debt18 (23.2%) and auto loans (22.2%) also rising strongly during this period.

There is, however, a significant difference in the average dollar amounts between mortgages and auto loan or credit card debts. For example, there are nearly 600 million active credit card accounts—which is not surprising, given many households have multiple cards—compared to slightly more than 100 million auto loans and 85 million outstanding mortgages.19
Delinquency on overall debt is low but rising for credit card and auto loans
Total loan delinquencies have grown slightly from their pandemic lows but are still relatively low compared to the heights they hit during the global financial crisis (2007 to 2009). During the financial crisis and its immediate aftermath, the percentage of loan balances in delinquency status reached 11.9% in the last quarter of 2009, before gradually reducing to 4.6% at the start of the pandemic. The percentage of delinquent balances reached a low of 2.5% in the last quarter of 2022 before rising to 3.2% in the second quarter 2024.20
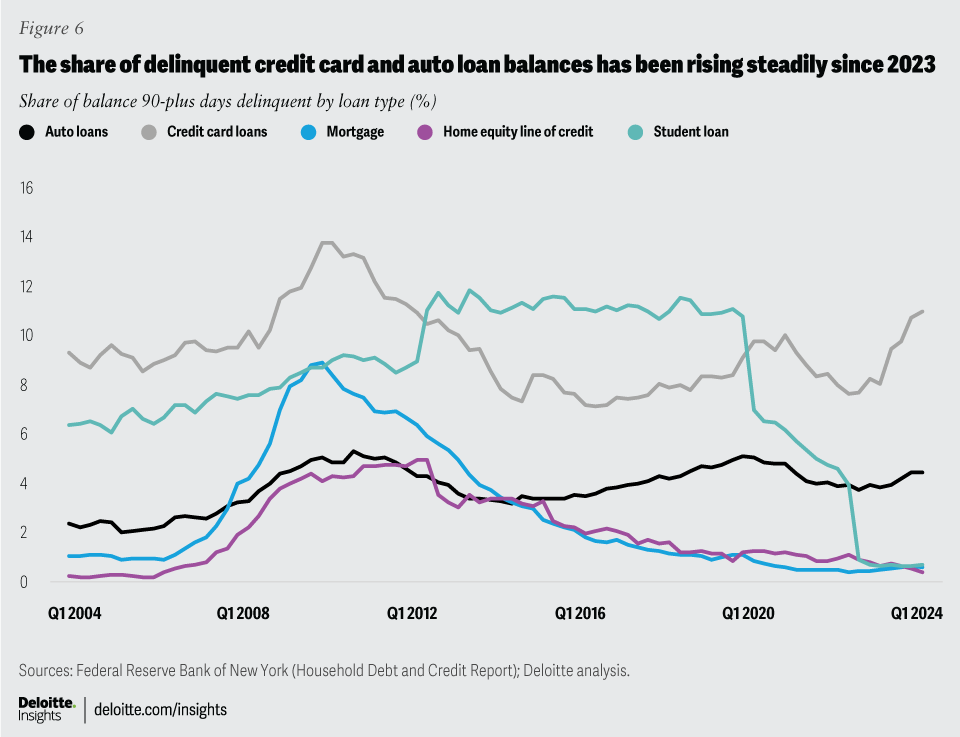
Looking back, the percentages of balances in delinquency of almost all the major loan categories spiked sharply during the financial crisis before gradually falling (figure 6). Student loan delinquencies were an outlier, as they stabilized at a very high level until the pandemic. Since 2020, a combination of legislative efforts and executive orders have worked to drop federal student loans counted as delinquent to very low levels. According to the current rules, missed federal student loan payments will not be reported to credit bureaus until the last quarter of 2024. The share of mortgage balances and housing equity revolving loans in delinquency status continued to fall throughout the pandemic and are now low thanks to high underwriting standards.
However, credit card and auto delinquencies have been increasing (figure 6). The share of delinquent (over 90 days due) credit card balances is now almost 11%, not far from its peak of 13.7% during the financial crisis. Auto loan balances in delinquency too are near their pre-pandemic and financial crisis peaks.

Is that a problem?
Rising auto loan and credit card delinquencies are not a problem, especially if we compare these numbers to what happened during the global financial crisis. When mortgage delinquencies peaked in the first quarter of 2010, 8.9% of mortgage balances were over 90 days delinquent—equal to US$785 billion. However, given the small size of outstanding credit card debt and auto loans in total household debt, its ability to affect the economy meaningfully is limited. The worry, however, may be on another front: When credit bureaus begin reporting student loan delinquencies at the end of this year, the stress on households will likely become more evident. At this point, though, it is not possible to gauge how large that impact will be.


