United States Economic Forecast
The US economy remains strong with robust consumer spending and high business investment, but considerable uncertainty clouds the outlook
Since our last forecast was published in early December, a new administration has taken office in Washington, D.C., and there has been a deluge of economically impactful policies and announcements. The new president outlined many policy proposals during the campaign, and since his inauguration on Jan. 20, 2025, we have started to get a sense of how his administration plans to implement these proposals.
From a macroeconomic perspective, the most significant actions taken by the new administration as of the time of writing (in late February) have been on tariffs and government operations. There have been numerous announcements of new tariffs—some have gone into effect, some have been “paused,” and some are yet to come into force. On government operations, the administration is seeking to downsize and reshape the federal government through technology modernization, enhanced government efficiency, head count reductions, acquisition reform, and reducing spending. Trump has proposed reducing the size of some agencies and/or transferring governmental functions from one agency to another and is looking for potential fraud and errant payments in government programs.
Although it is still early days, and we still have many outstanding questions about policy specifics, the new administration appears to be driving a substantial reordering of the economic landscape. Sea changes like these make economic forecasting difficult, particularly in the face of uncertainty. We have produced three scenarios, detailed in the next section below, which capture a range of possible futures.1
Scenarios
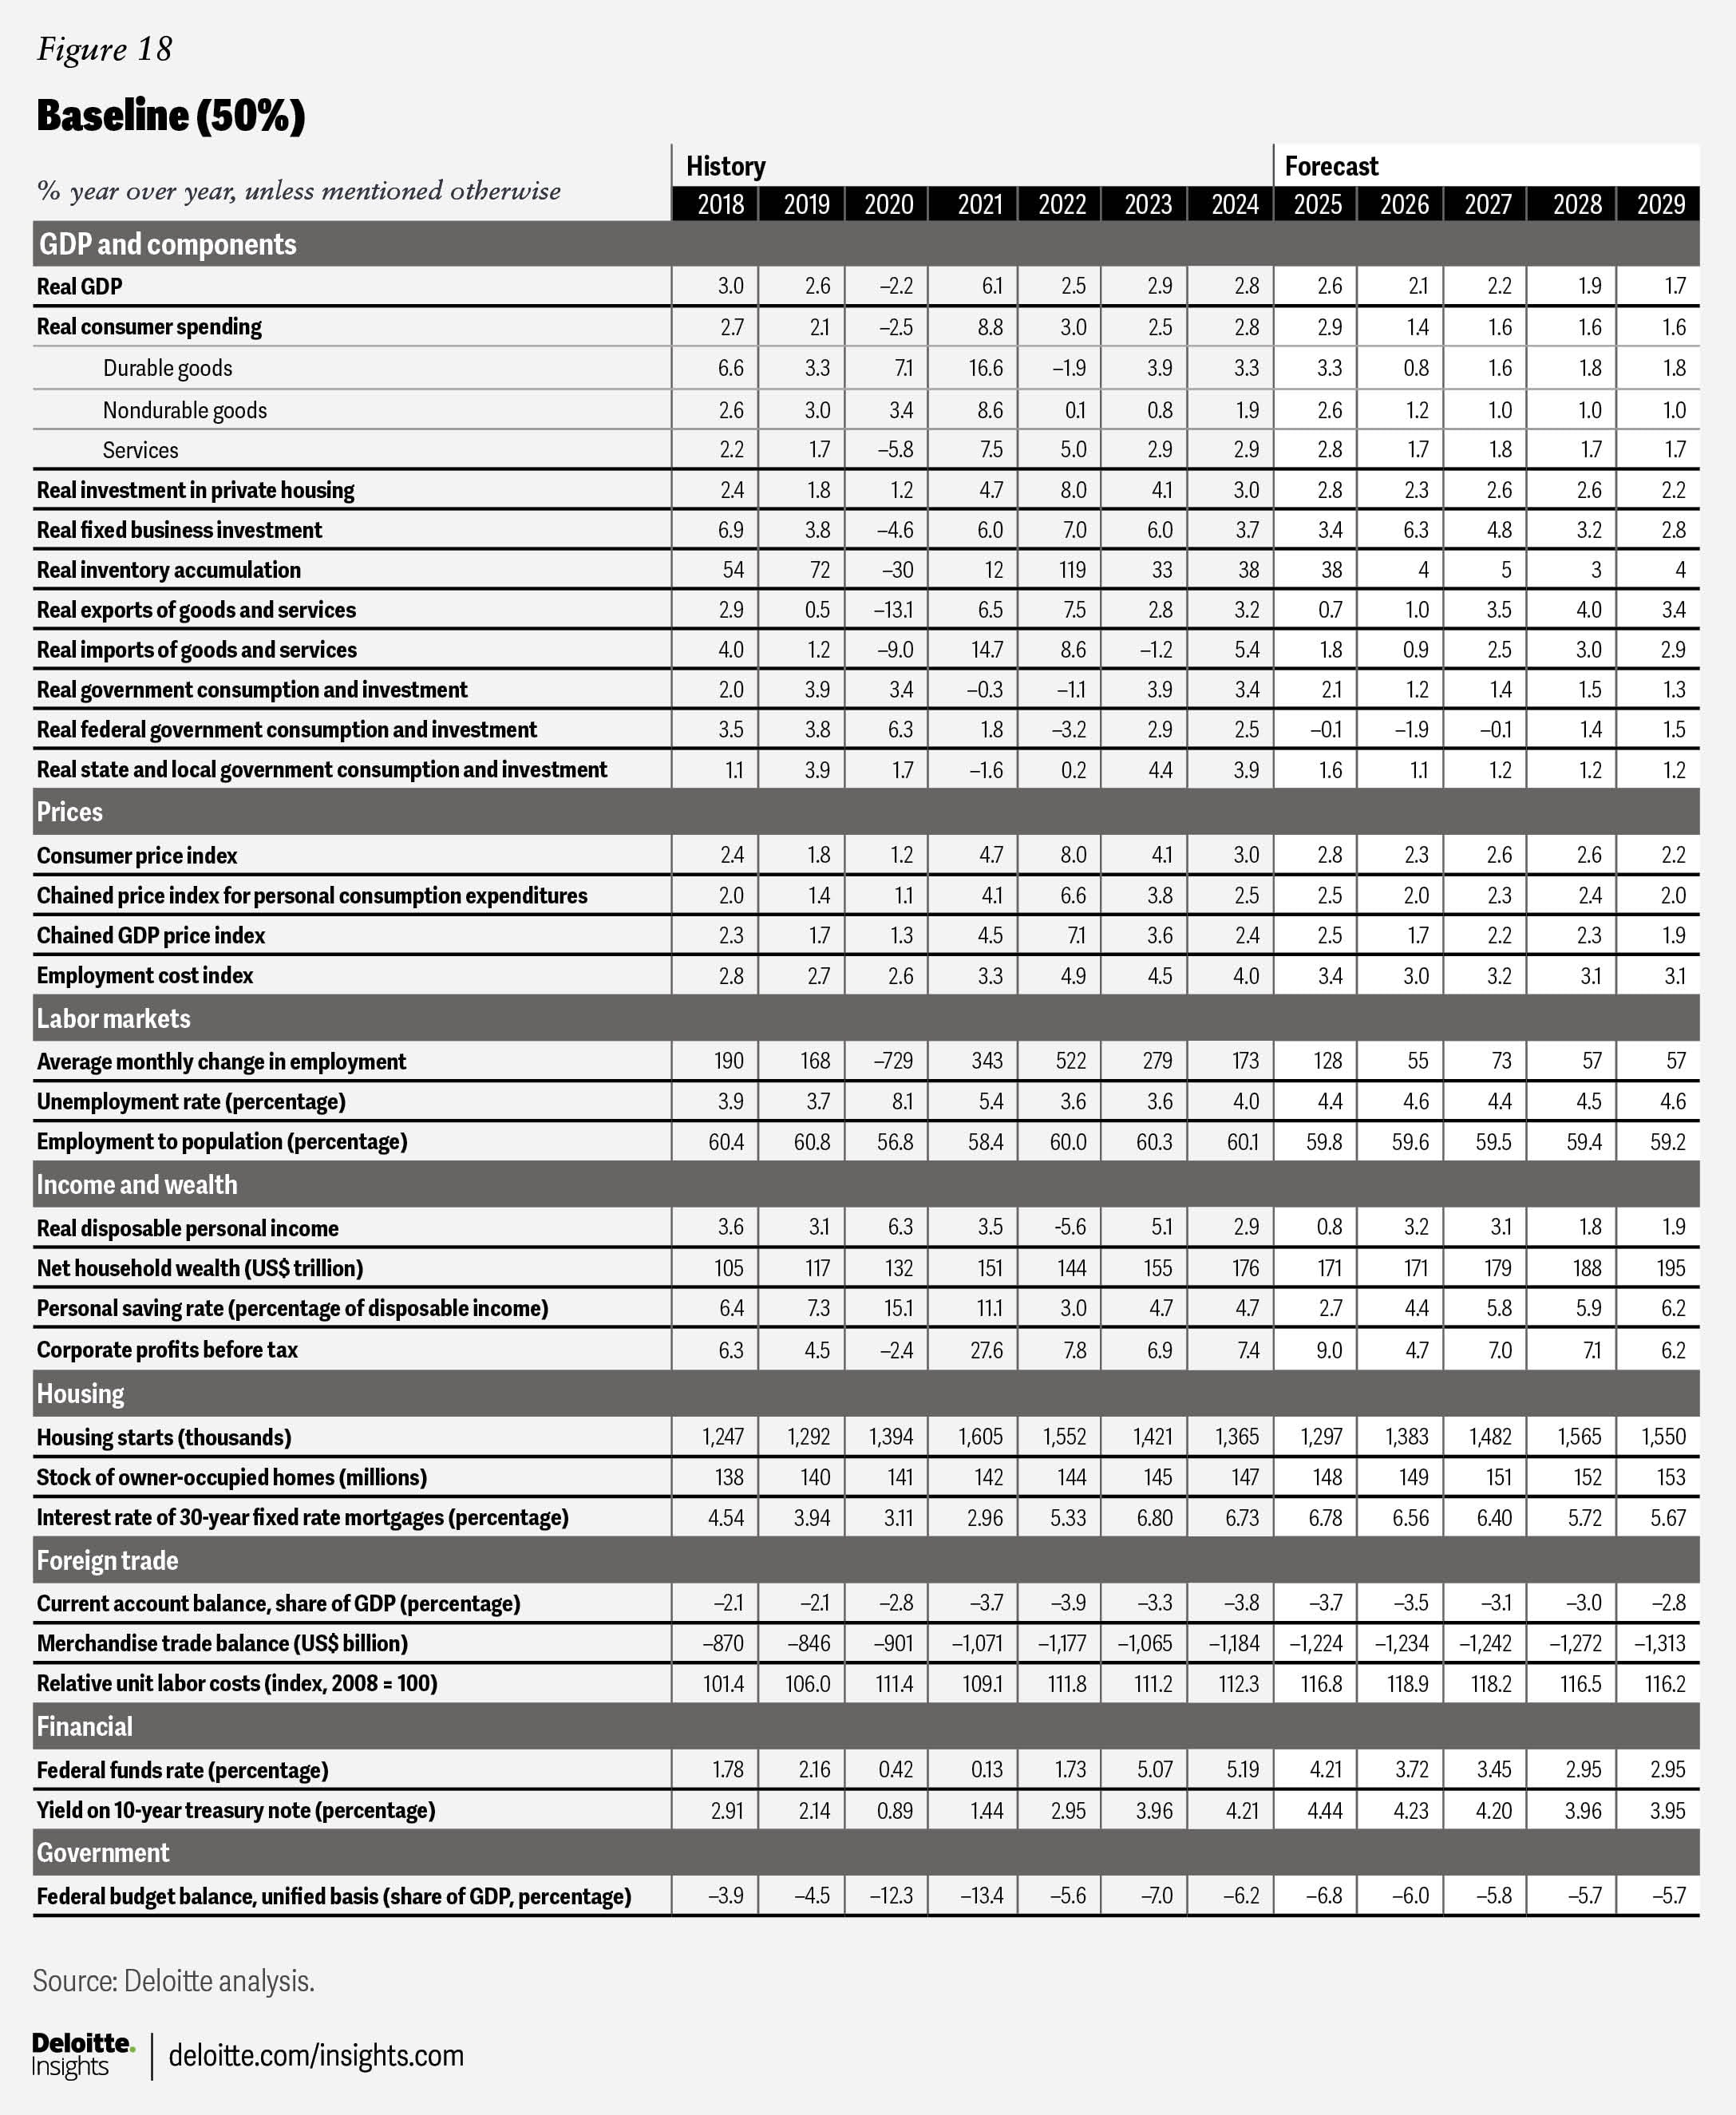
Baseline (50%)2: Our baseline scenario aims to represent a “middle of the road” outcome. It is our assessment of the likely trajectory of the economy in the absence of major upside or downside risks. On the positive side, it includes an expansion of the Tax Cuts and Jobs Act (TCJA) and a modest boost from deregulation. However, we also assume a relatively modest increase in tariff rates, modest federal spending cuts, and a more stringent immigration policy that largely balance out the aforementioned expansionary policies.
We expect the TCJA will be extended, avoiding a sudden increase in income taxes, and we expect that the corporate tax rate will be lowered for American producers in line with campaign promises.3 Deregulation will continue throughout the next few years. The productivity boost from this is expected to remain relatively modest in the near term as policy uncertainty delays and limits the benefits of cutting red tape.
While it is not yet clear which tariffs will be introduced or which will “stick,” we do expect that there will be some level of new and lasting tariffs. We model this by adding five percentage points to the average tariff rate on all imported goods, which stood at 3.3% in 2024. We also expect that some spending cuts will prove lasting. Over the course of a few years, total net savings of US$200 billion are found in federal outlays compared with a scenario where there were no cuts (the actual dollar reduction in federal spending is much less than this number, because we bake in underlying spending growth due to population growth and inflation). Finally, we expect that deportations of undocumented immigrants will be lower than they were in 2024.
However, we expect the number of deportations to be about 15% higher than the average seen over the last five years.
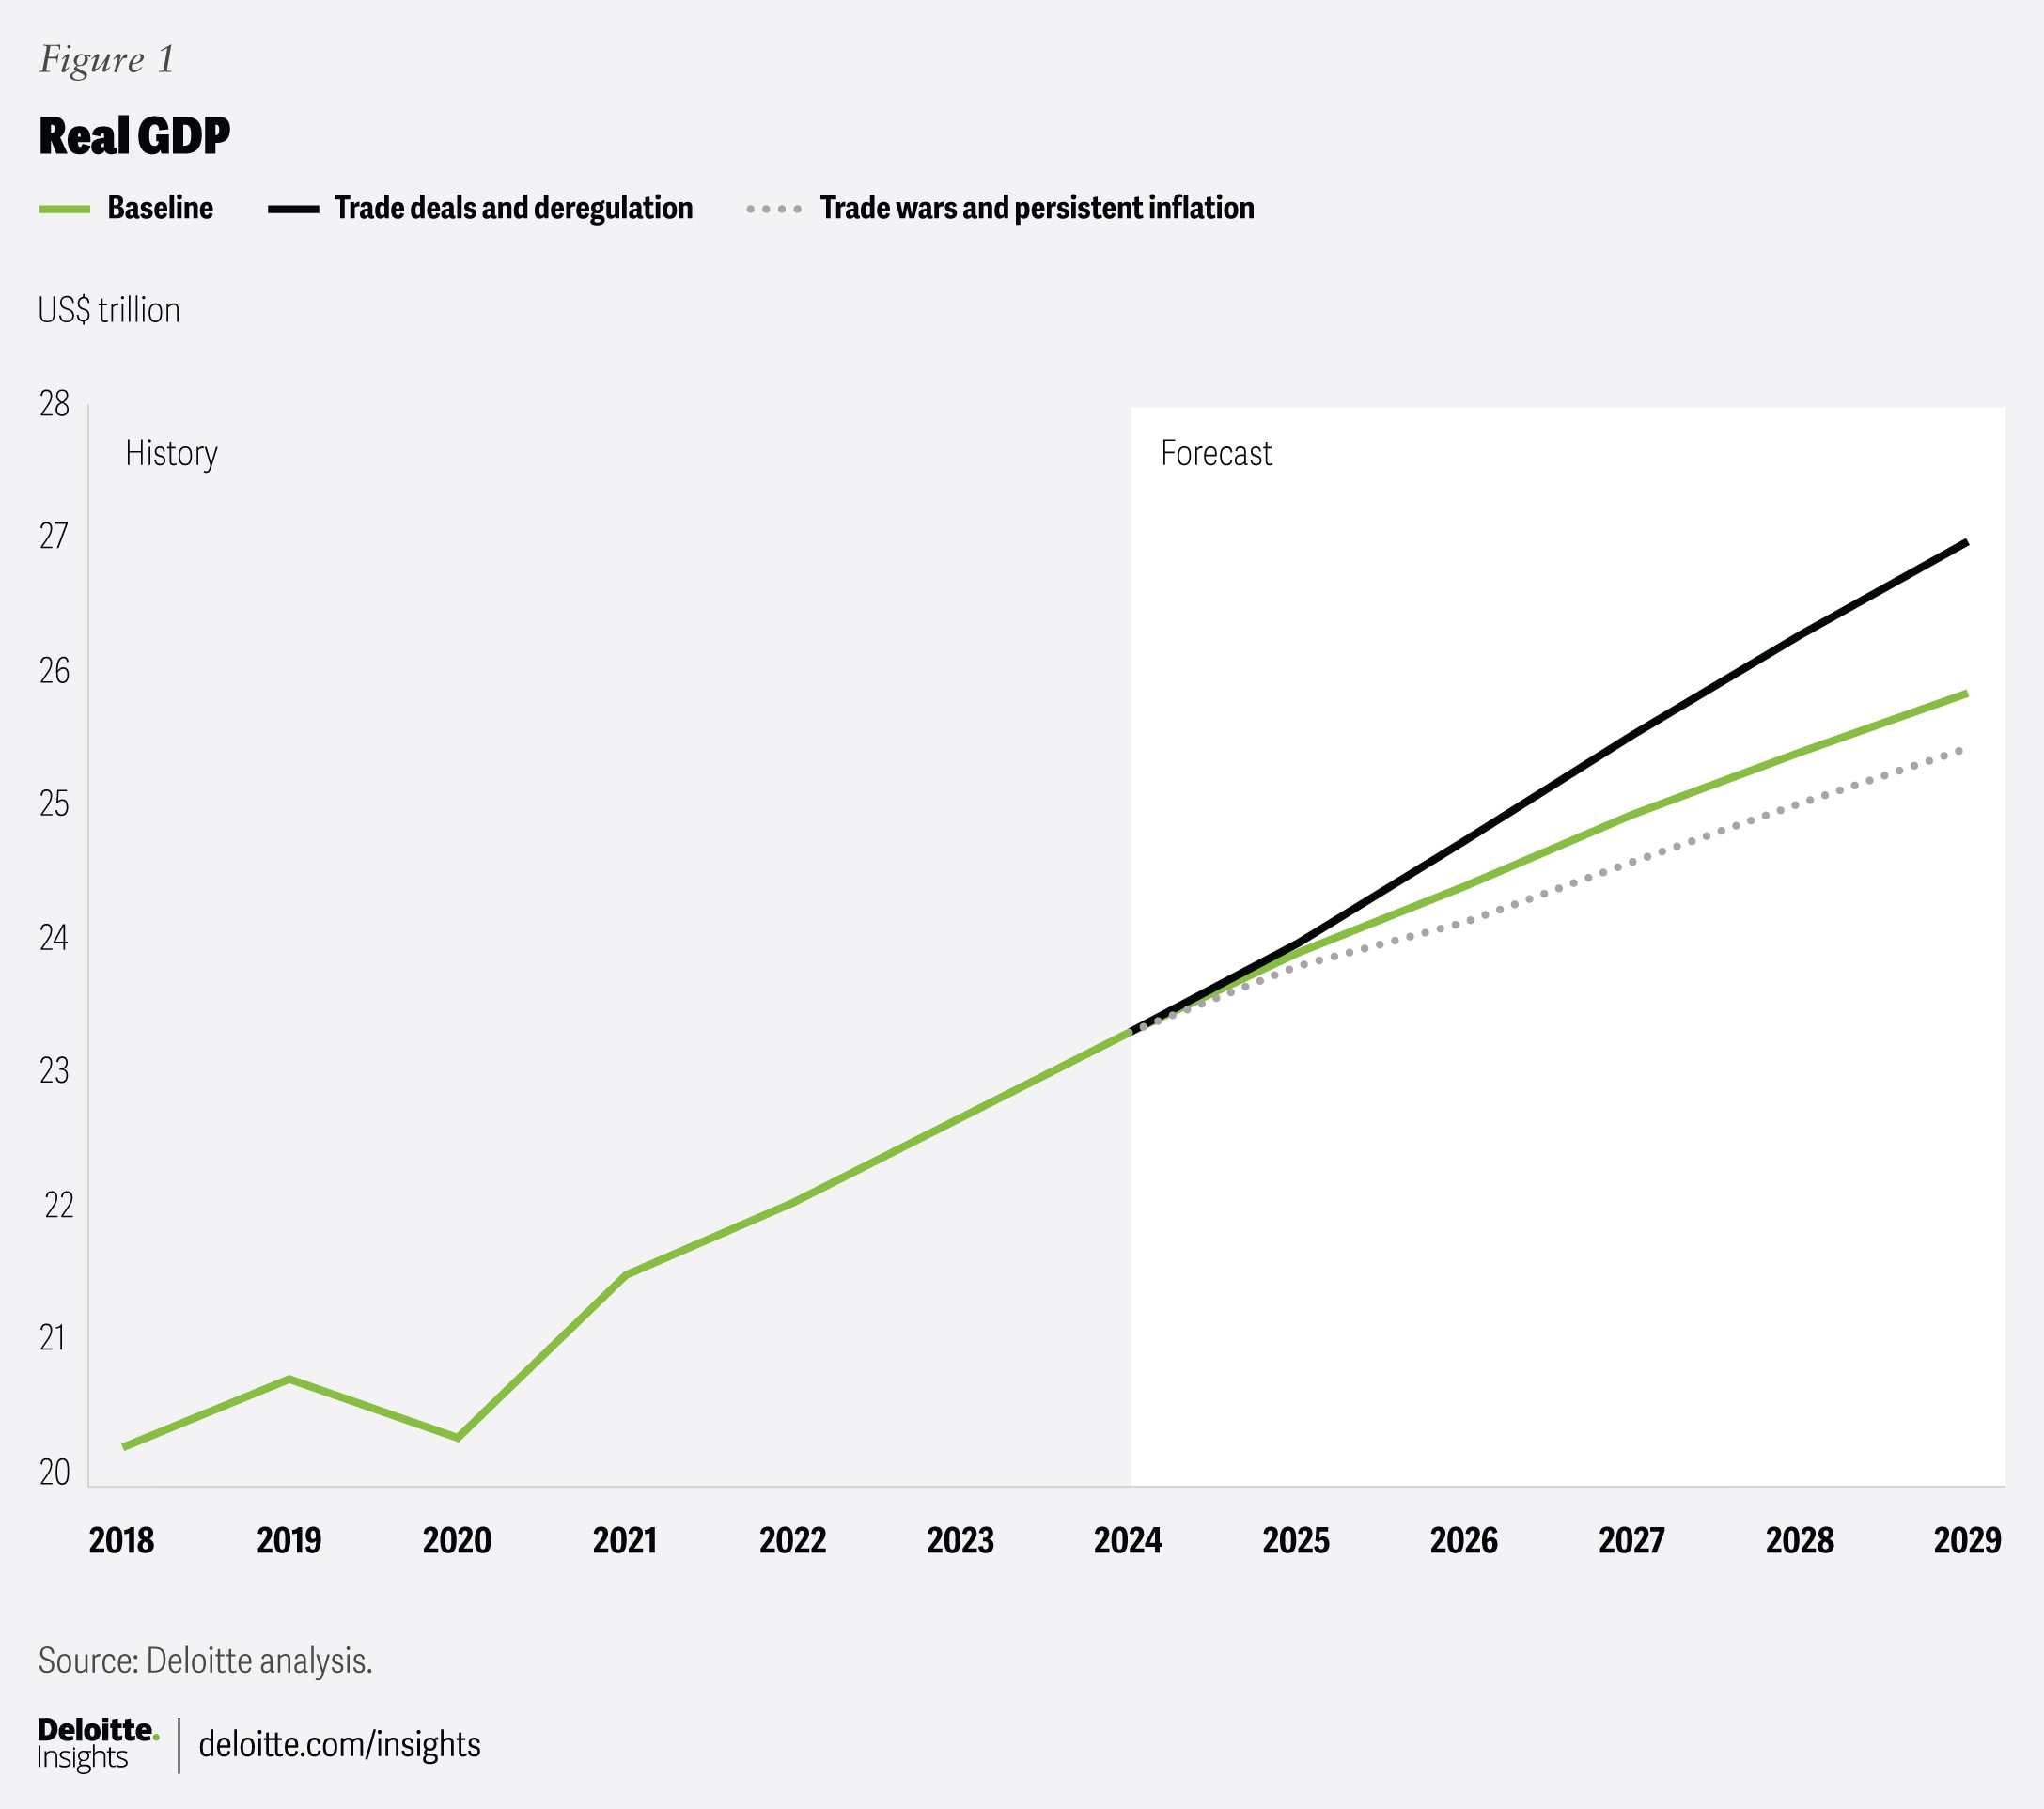
In this scenario, individuals and businesses front-load some trade activity early in 2025 to avoid tariffs; as tariffs take effect, trade slows later this year and into next. We forecast real exports will grow by 0.7% in 2025 and 1% in 2026, while real imports will grow by 1.8% in 2025 and 0.9% in 2026. The inflationary effects of tariffs mean the Federal Reserve can only manage 75 basis points of cuts over the next 24 months. Real consumer spending grows by 2.9% in 2025 and 1.4% in 2026. Government spending cuts and layoffs continue over the next few years, which subtract value from overall growth. Overall, our modeling shows real GDP growth of 2.6% in 2025 and 2.1% in 2026. GDP growth then averages 1.9% per year over the remaining three years of the forecast.4
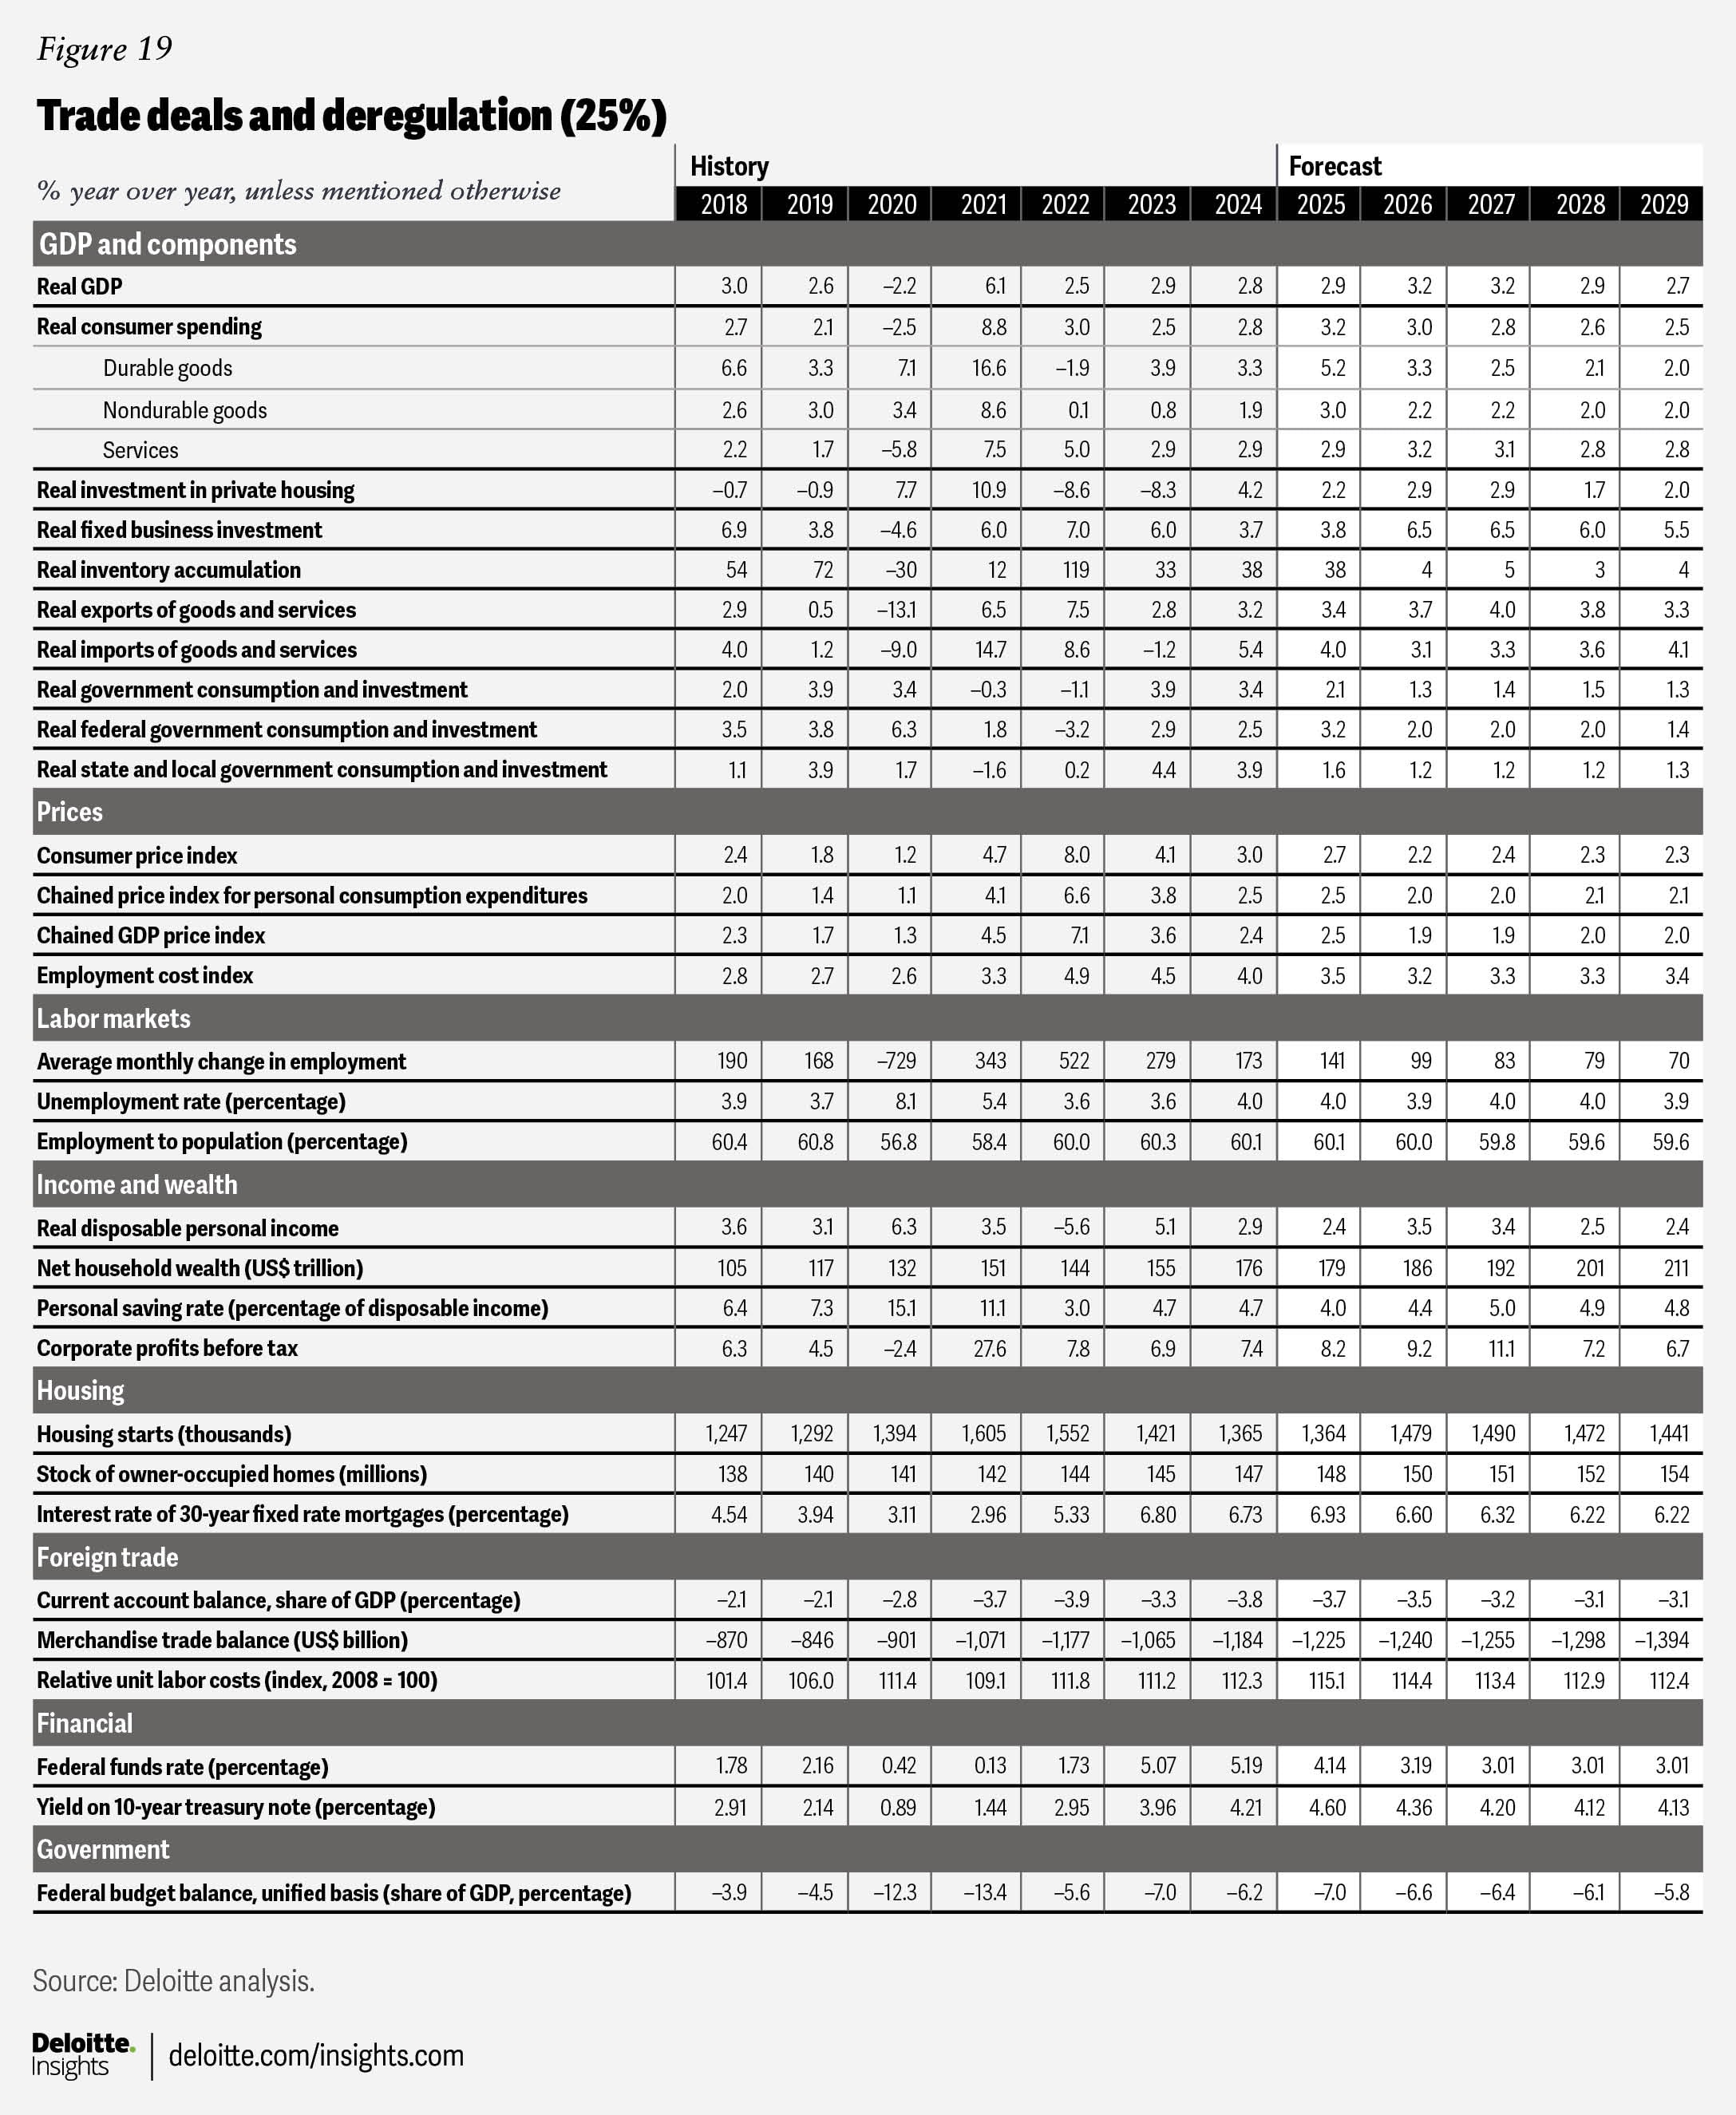
Trade deals and deregulation (25%): Our upside scenario explores the possibility that the economy could unlock a new level of growth thanks to productivity-enhancing technology, tax cuts, and deregulation. In this scenario, we examine what might happen if these hopes come true. As in the baseline, the TCJA tax cuts are extended, and the corporate tax rate is lowered to 15% for domestic producers. That, as well as breakthroughs in novel technologies like artificial intelligence, prompts a boost in investment, which results in a productivity boom.
We maintain tariffs at 2024 levels in this scenario, working on the theory that the new administration is primarily interested in using tariffs as a negotiating tactic to extract concessions from trading partners. Likewise, deportations under the current administration continue at a similar pace as the previous administration.
In this scenario, real GDP will rise by 2.9% in 2025 and 3.2% in 2026. Growth averages 2.9% over the remaining three years of the forecast—one percentage point above the average in the baseline scenario. With fewer tariffs in place, this scenario also predicts lower inflation compared to the baseline, stronger consumer spending starting in 2026, and a lower merchandise trade deficit. The booming economy results in a lower unemployment rate than in the baseline scenario.
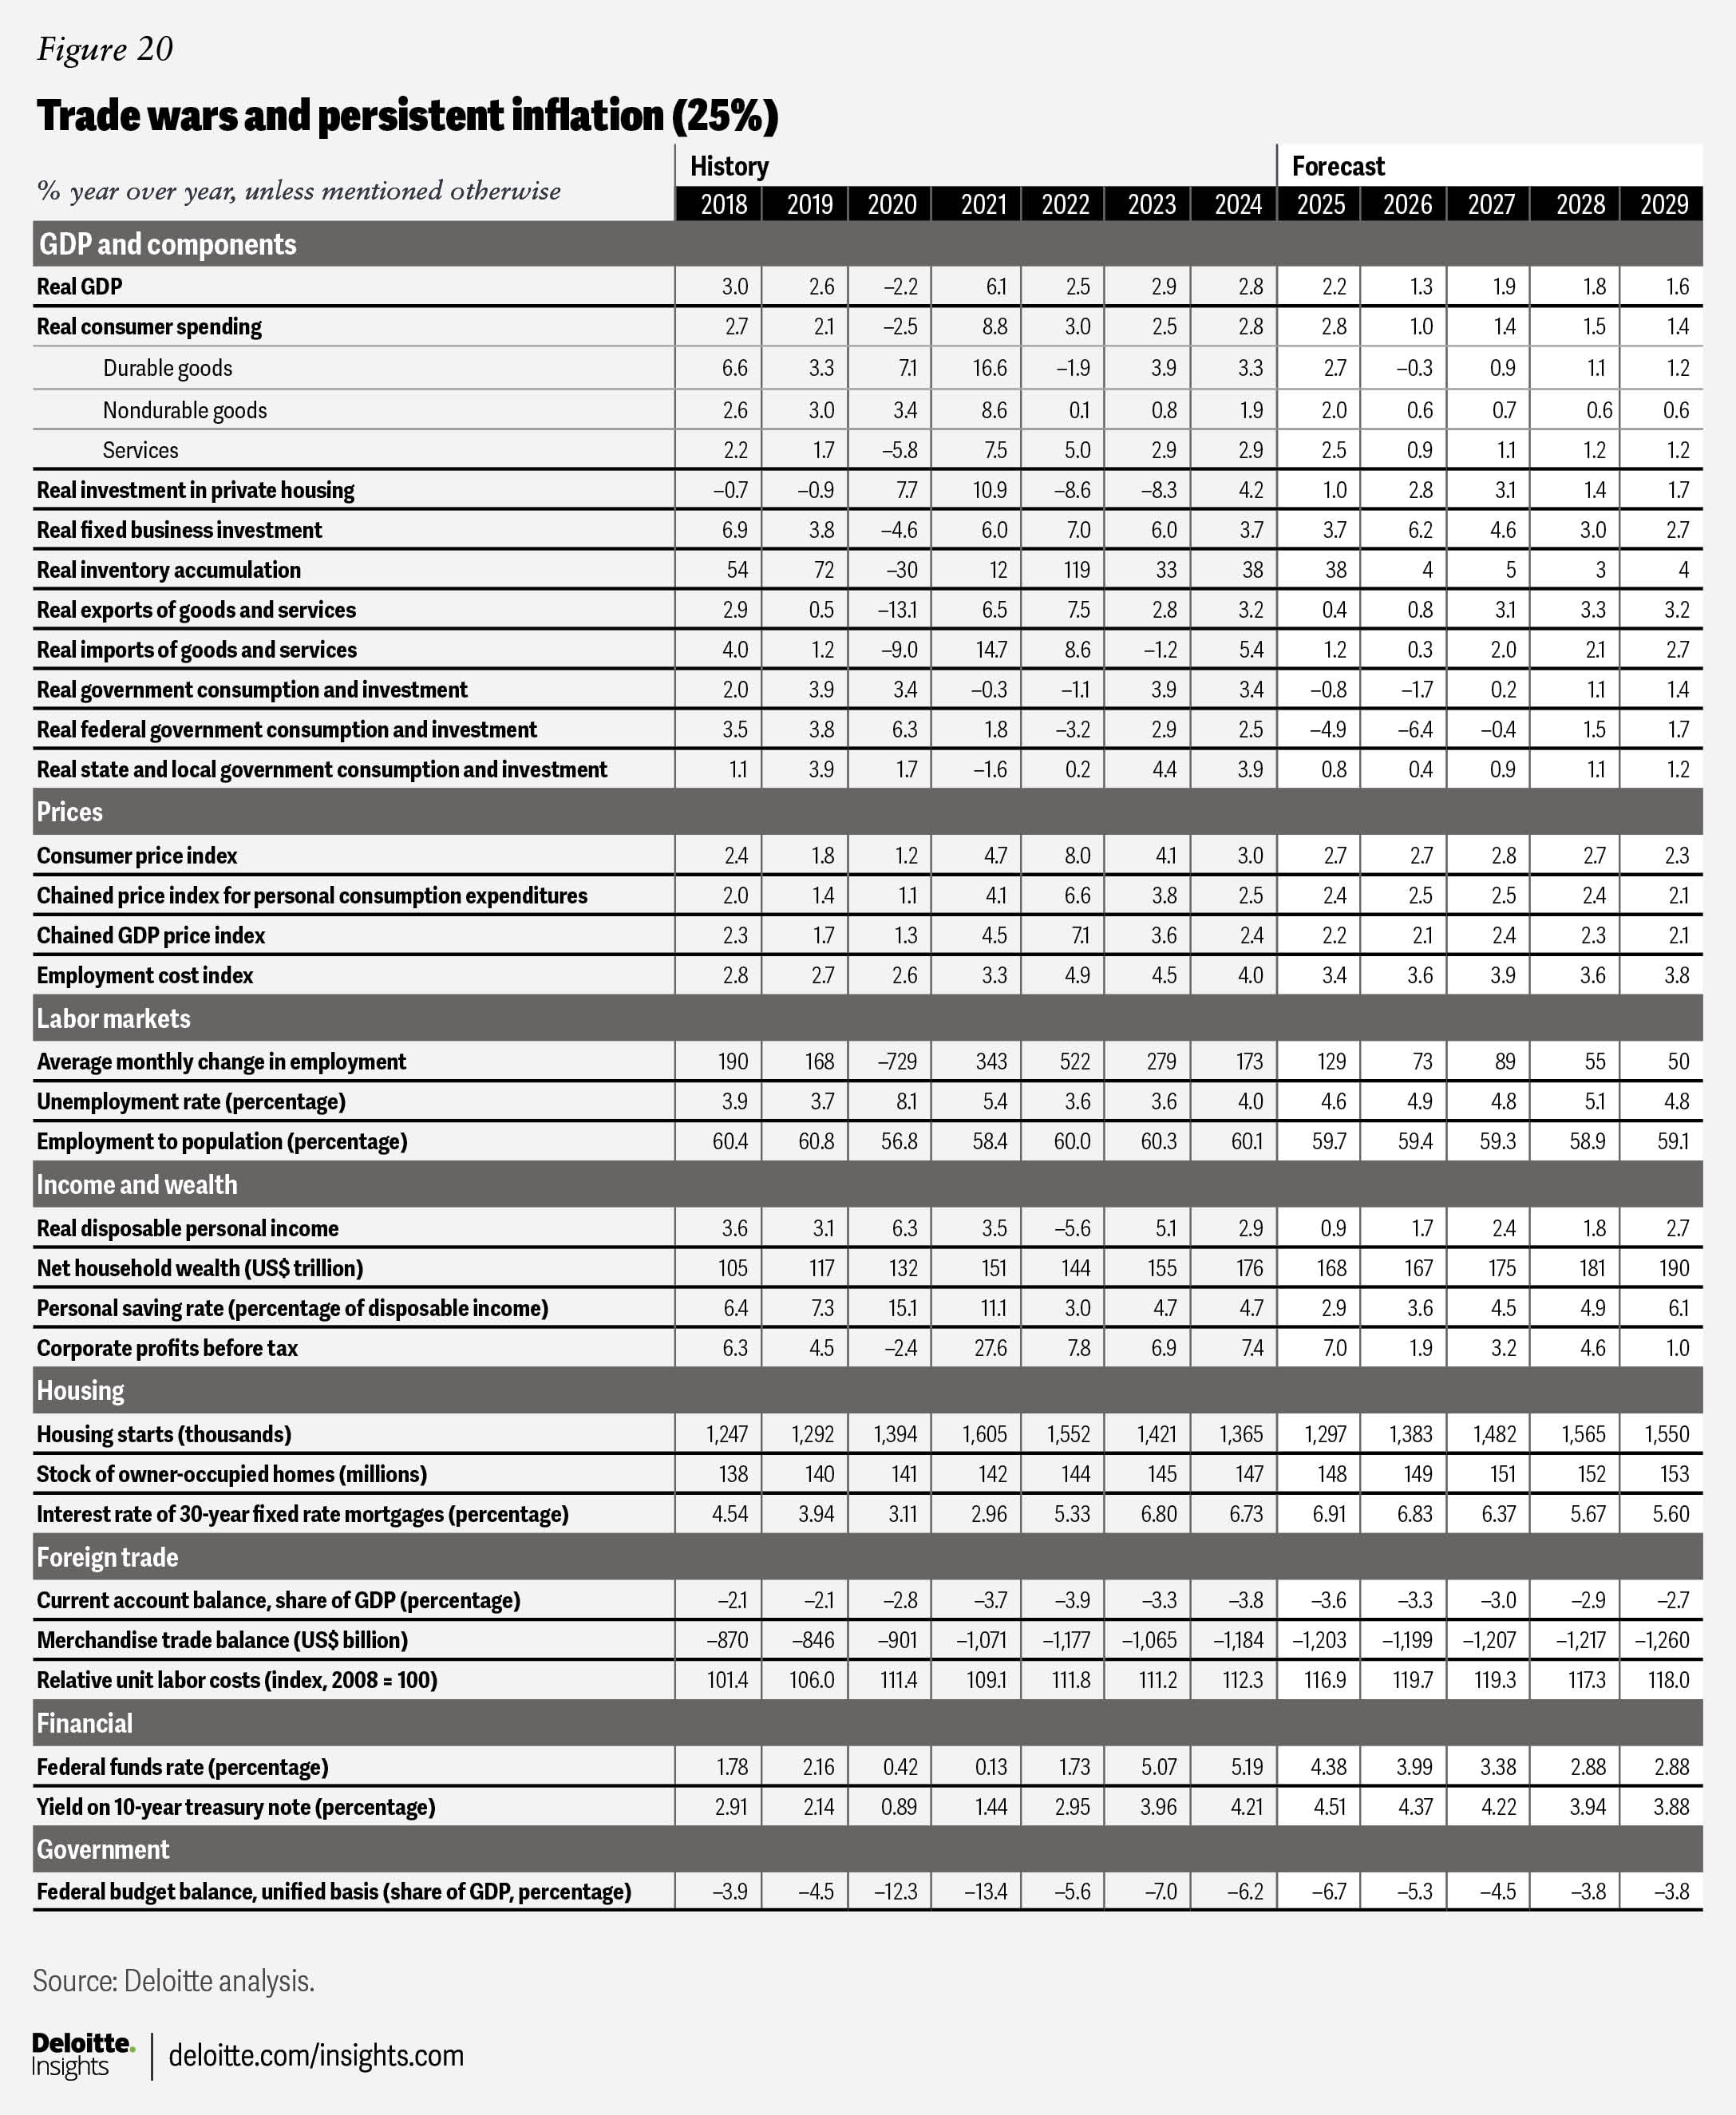
Trade wars and persistent inflation (25%): While our baseline does incorporate some significant policy changes from the new administration, it does not reflect the full scope of potential changes to trade and immigration policy. We therefore modeled an alternate scenario where more impactful versions of these policies are implemented.
In this scenario, we raised the average tariff rate on goods imports by 10 percentage points. As a point of comparison, this magnitude of tariffs is approximately equivalent to a 25% tariff on Mexican and Canadian imports; the average import duty has not been this high since World War II. The tariffs raise the price of final goods for American consumers and raise the cost of intermediate imports for American producers. Exporters are also affected by the appreciation in the US dollar caused by the tariffs, making American products less affordable for foreign buyers.
As a result, exports are flat in 2025. While we do not model retaliation by trading partners in our scenarios, it is reasonable to assume that they would levy reciprocal tariffs or boycott American goods. The extent to which these dynamics further reduce American exports depend as much on psychology as on economics. While the tariffs could result in the reshoring of manufacturing to America, the macroeconomic benefits of this will take time to materialize.
We include larger government spending cuts in this scenario, with spending eventually falling US$1 trillion below its status quo trend. While a small portion of these cuts come from reductions in headcount and the consolidation of departments and agencies, other spending cuts will necessarily need to be enacted through the Congressional budget process. As in the baseline scenario, the TCJA tax cuts are extended, and the corporate tax rate is cut to 15% for American producers.
While the vice president has floated the possibility that 1 million undocumented immigrants could be deported each year under the new administration,5 we think it would be very difficult to deport such a large number of people. In this scenario, we allow deportations to rise by 250,000 per year, roughly doubling the rate of the previous administration. This reduces population growth and would have an impact on some industries, like agriculture and hospitality, where undocumented immigrants make up a significant share of the total workforce.
Overall, economic growth slows considerably to 2.2% in 2025 and 1.3% in 2026. The fight against inflation is slower than expected, and the Fed holds off on rate cuts in 2025 before beginning to cut again in 2026.
Sectors
Consumer spending
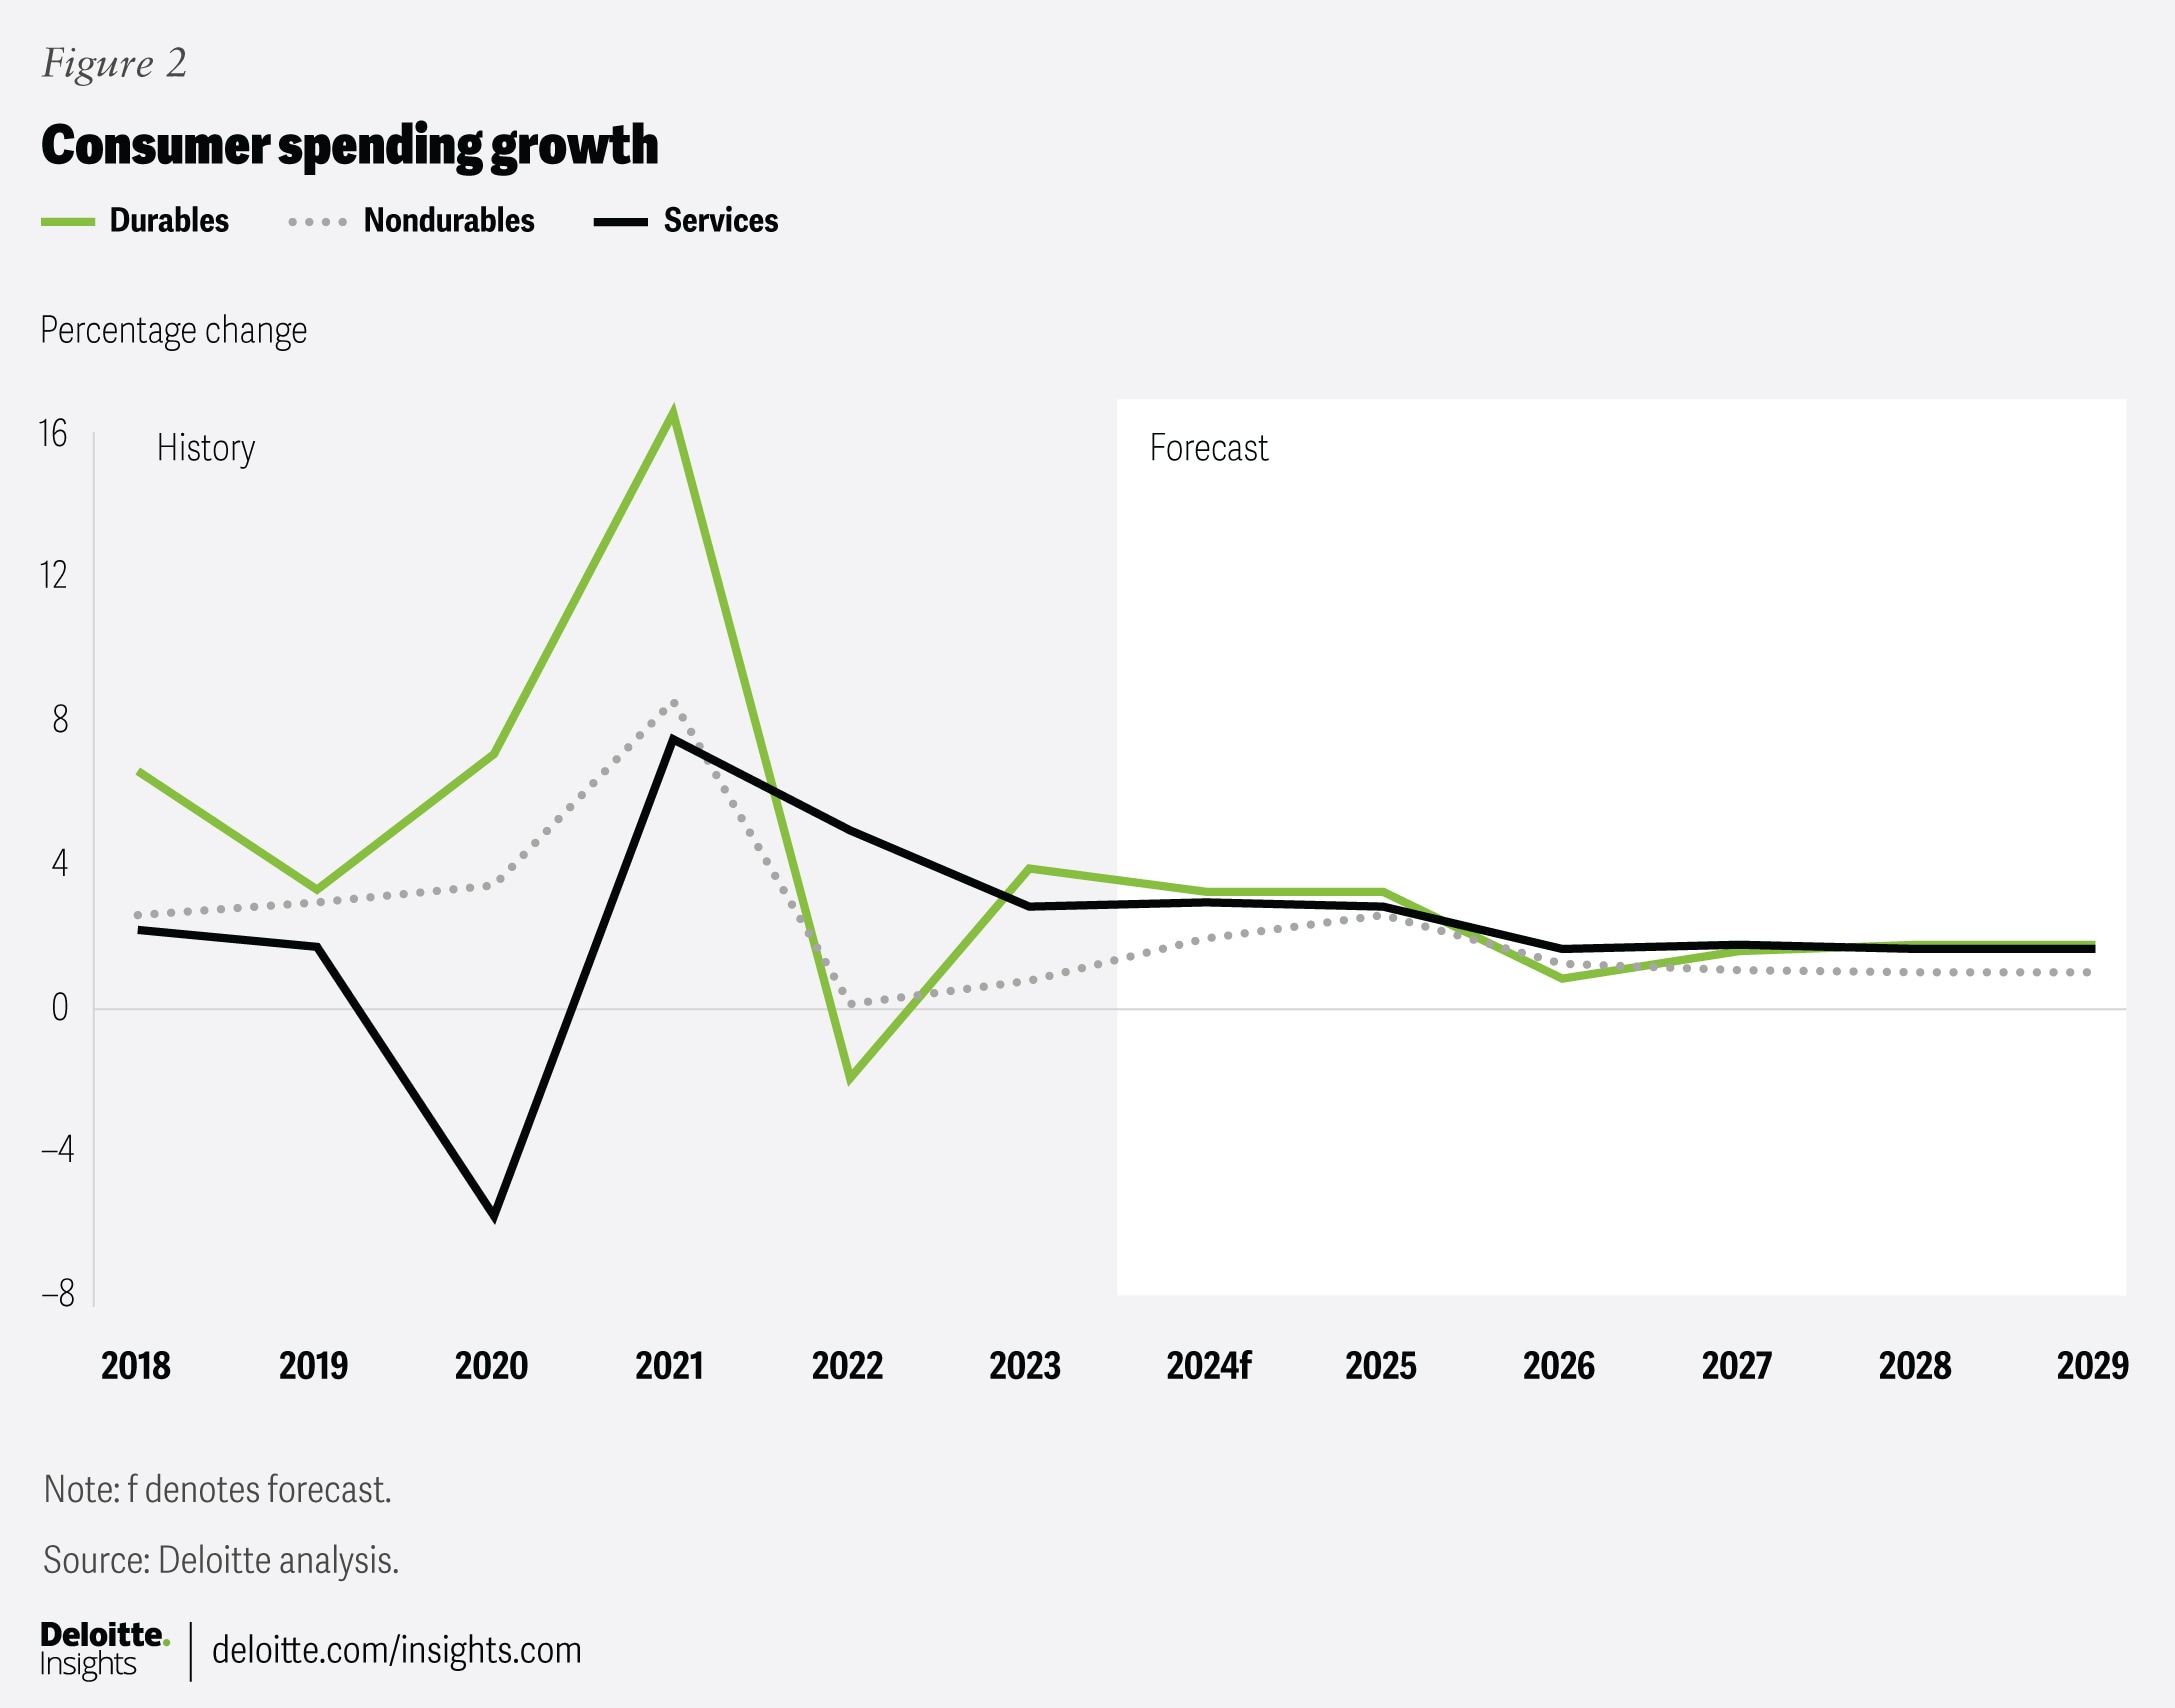
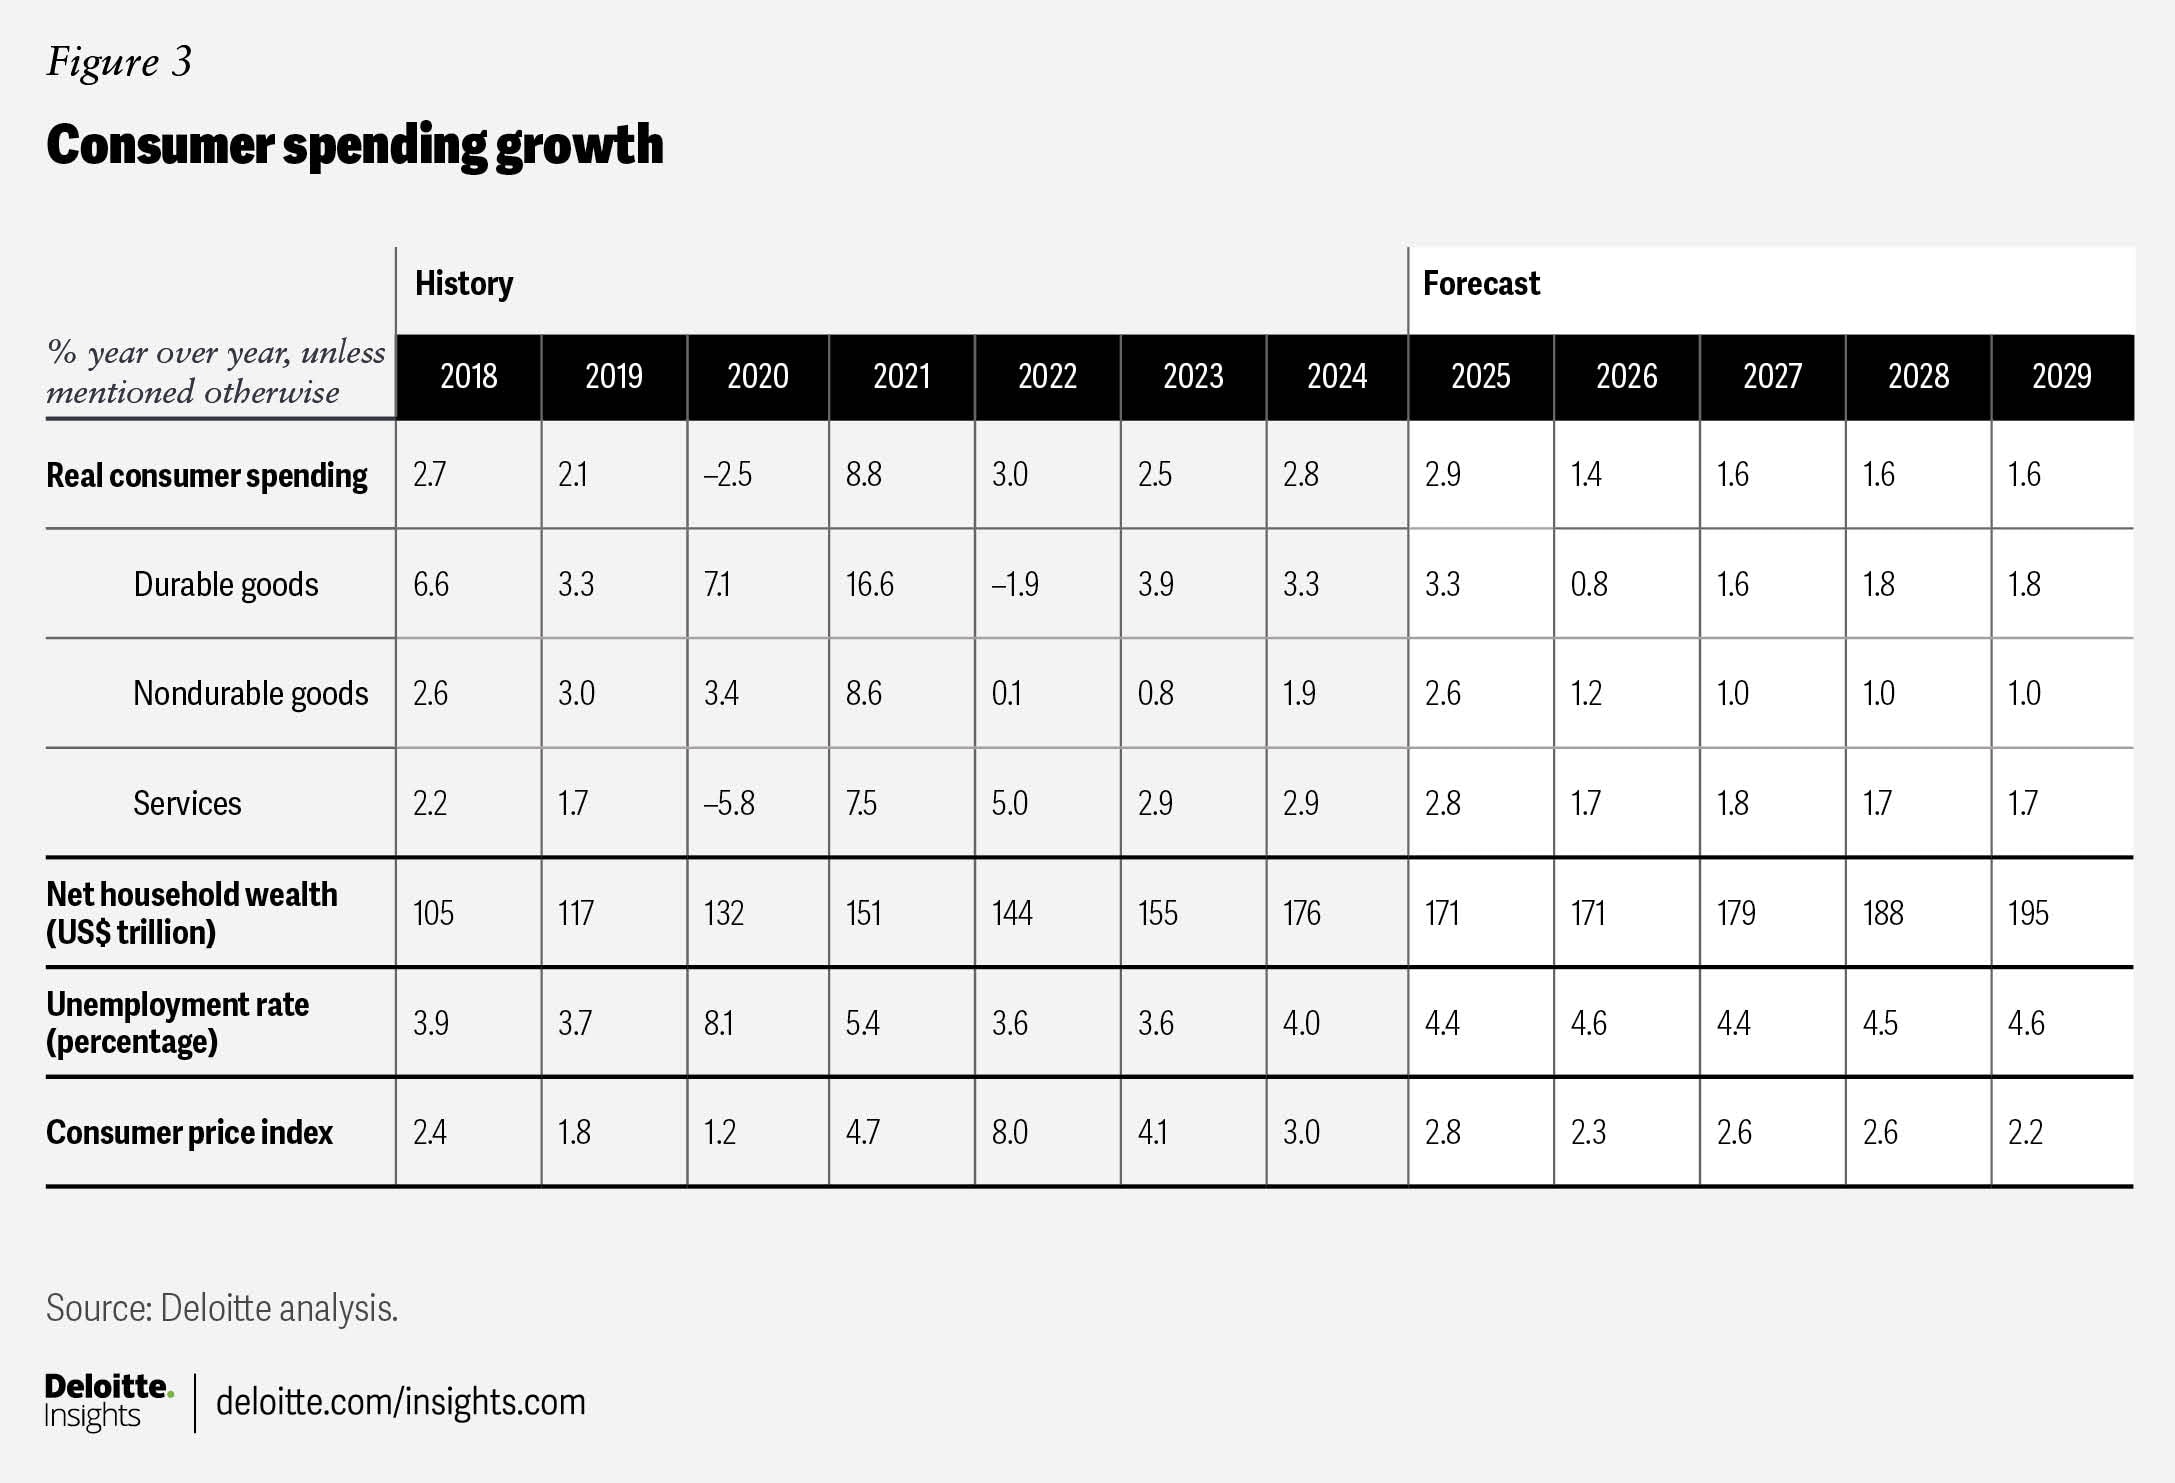
Real consumer spending continues to fare well. For the fourth quarter of 2024, overall real personal consumption expenditures (PCE) rose 4.2% (at annual rates), even stronger than the 3.7% growth recorded in the third quarter. Spending on durable goods in particular remains elevated, growing by 12.1% in the fourth quarter after rising more than 7% in the third quarter.
Despite this strong base, uncertainty is affecting consumer confidence as of this writing. A fear of price increases from tariffs caused the University of Michigan consumer sentiment, a monthly survey of consumer confidence levels in the United States, to fall 9.8% in February to 64.7, with all ages, income brackets, and wealth levels, and all five index components posting a decline.6 Leading the decrease was the 19% decrease in buying conditions for durables as year-ahead inflation expectations rose from 3.3% in January to 4.3% in February, the highest level recorded since November 2023. In addition, the Conference Board’s consumer confidence index declined seven points in February to 98.3, the largest monthly decline since August 2021.7
Short-term gains in consumer spending are expected to be driven by growing income and the ability of households to add new debt. Household debt continues to rise, increasing by US$93 billion in the fourth quarter of 2024.8 We expect the Fed will cut rates twice this year, enabling households to take on more debt, and therefore allow households to continue spending in the short term, even if significant tariffs were imposed. We also expect consumers will be doing some front-loading in early 2025 to try to get ahead of tariffs, which we see being slowly implemented over the course of the year.
Overall, we forecast real consumer spending will rise 2.9% this year before growing at a slower 1.4% pace in 2026. Lower interest rates should help boost demand for durable goods, boosting spending on that category by 3.3% in 2025 before tariffs bring growth to just 0.8% in 2026. Spending on nondurables is expected to rise by 2.6% in 2025 and 1.2% in 2026. Finally, spending on services is expected to increase by 2.8% in 2025 and 1.7% in 2026 as services will be less impacted by tariffs. Uncertain consumers have brought our consumption forecast down from our previous forecast.
Housing
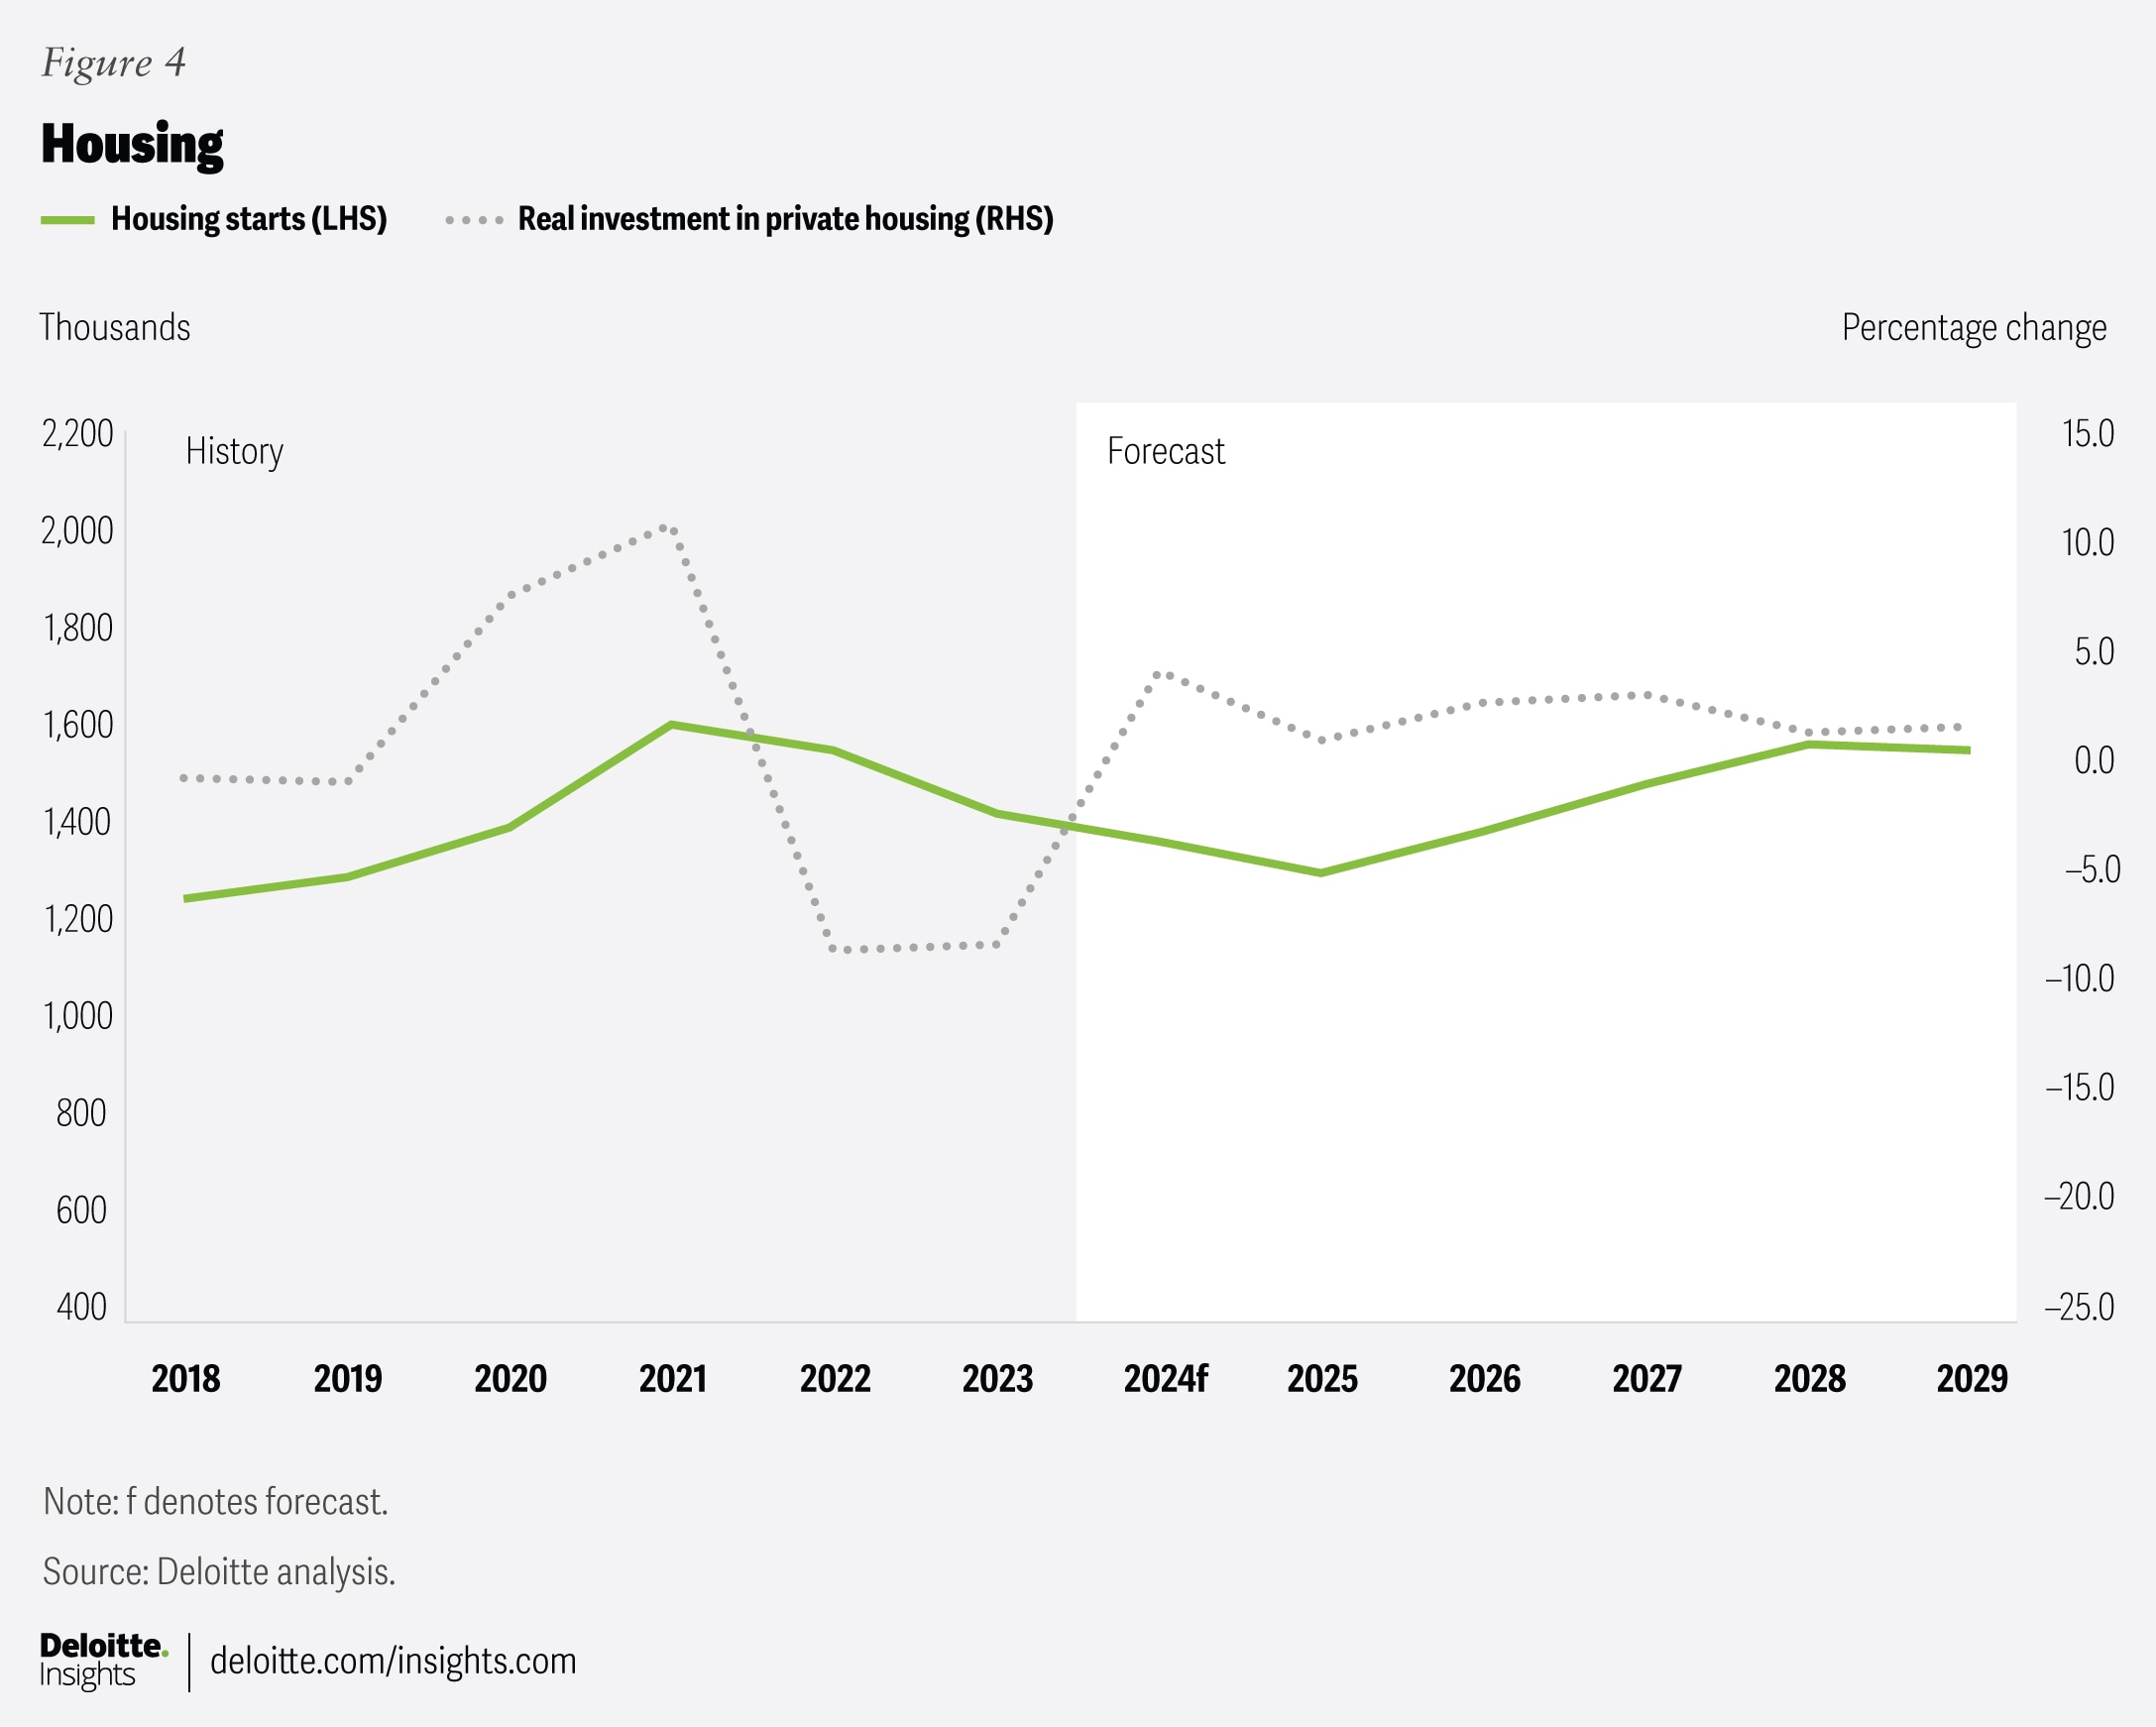
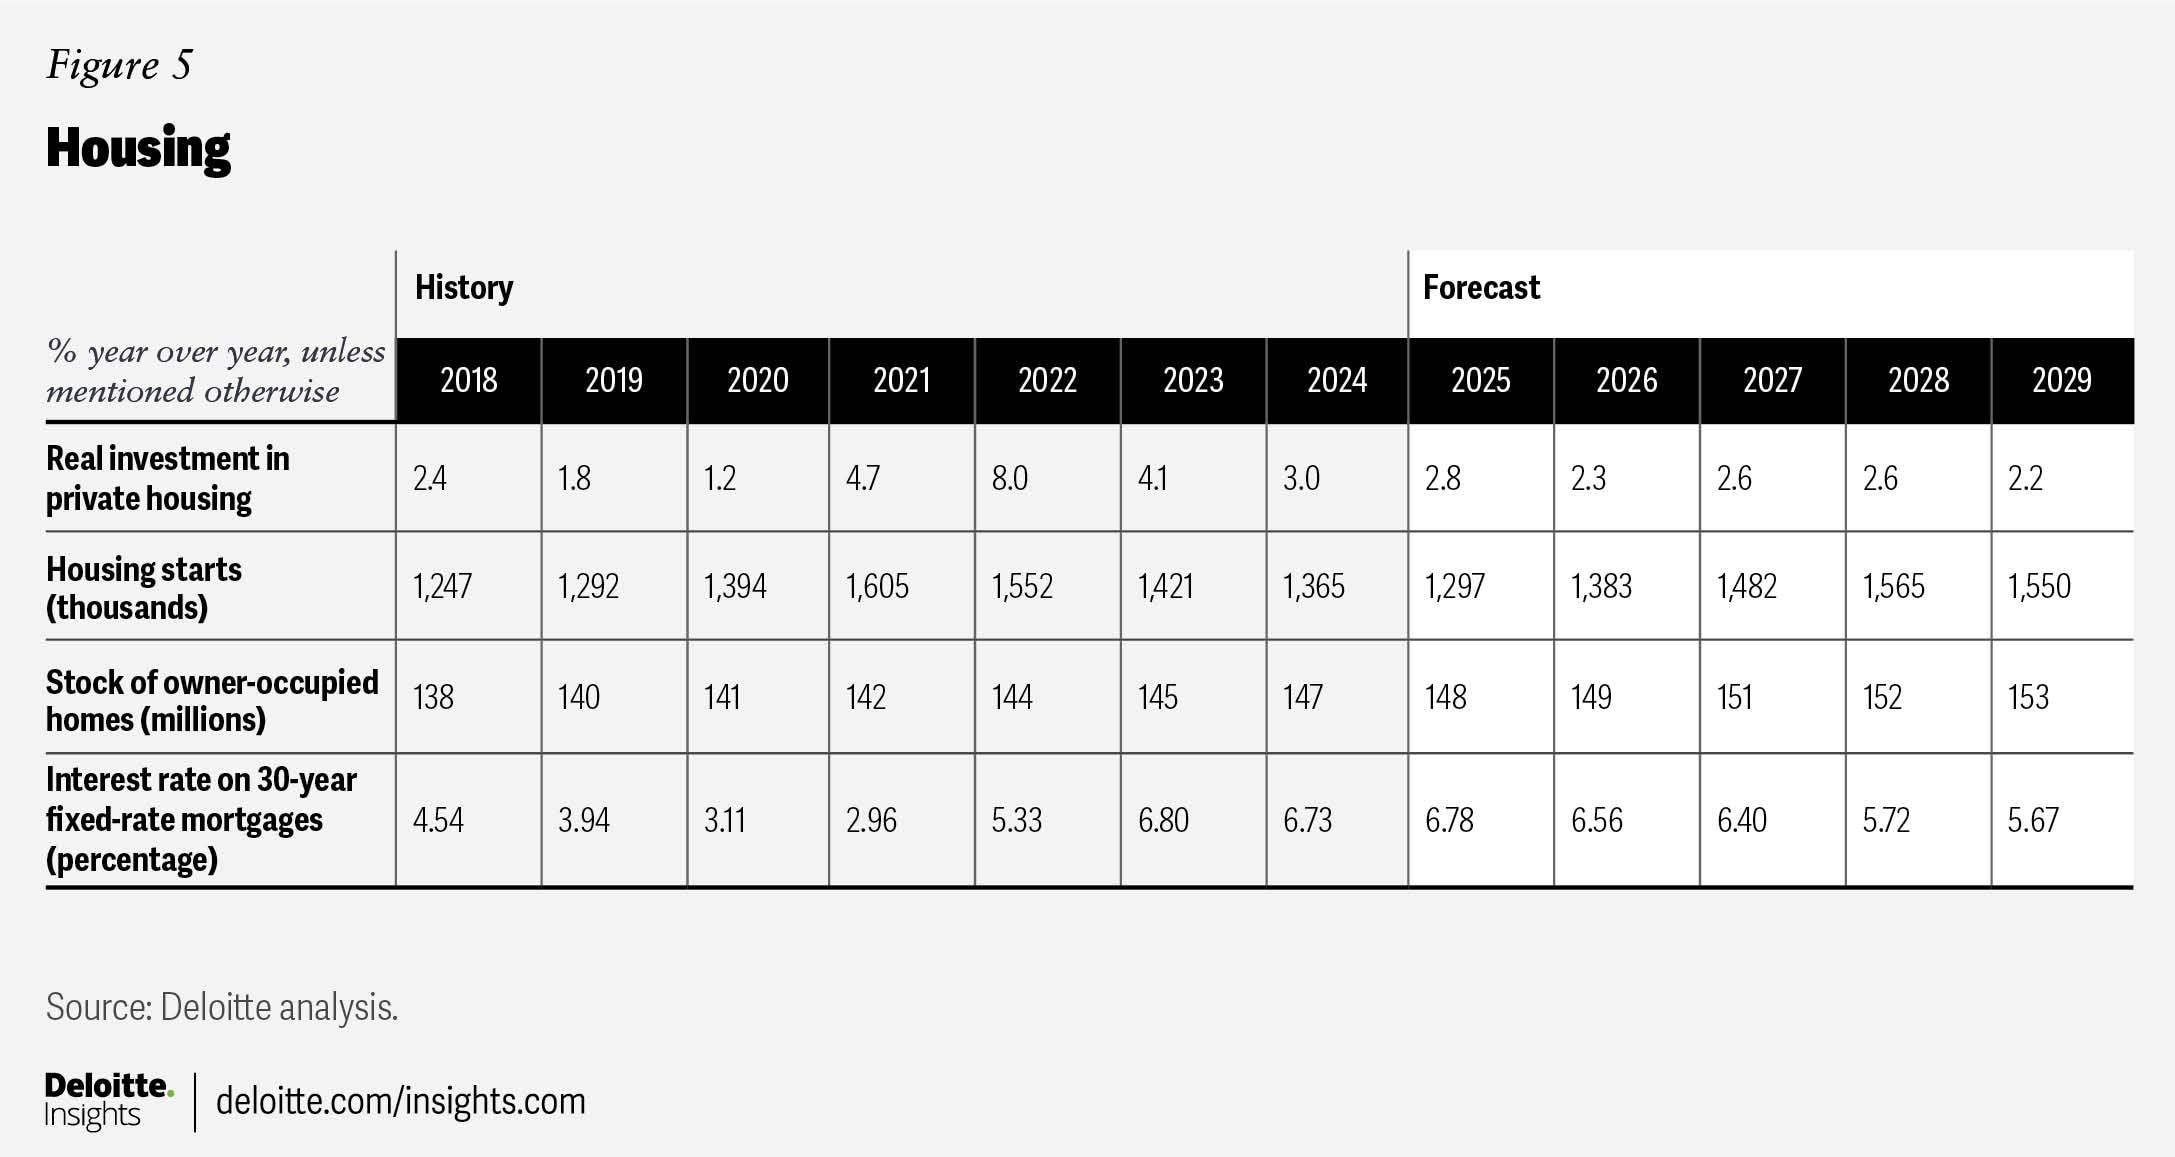
While interest rates have started to decline, mortgage rates remain elevated at the time of writing, causing housing starts to fall 9.8% in January to 1.366 million after strong increases in December.9 Although building permits remained relatively flat, elevated borrowing costs continue to weigh on affordability for buyers. During the 2010s, housing starts did not return to their peak levels from before the global financial crisis of 2008 to 2009. The long-term failure to build enough homes has contributed to the housing crisis we see today in some parts of the country, and we may have to wait for rates to drop to see a significant uptick in housing construction. One opportunity for the new administration could be to pursue initiatives to promote the building of housing.
After rising at the end of the last year, we expect housing starts to continue falling throughout the first half of 2025, before rising again in the latter half of 2025. Overall, in 2025, we expect housing starts to rise to almost 1.3 million and to almost 1.4 million in 2026. We anticipate housing starts to continue rising for the remainder of the forecast period once the Federal Open Market Committee (FOMC) lowers rates once again. For the entirety of the forecast period, we expect the housing stock to rise more rapidly than total population, helped in part by the slower population growth.
Despite strong projected construction levels in the medium to long term, real affordability requires more “starter homes” to be built in parts of the country experiencing the largest increases in population. We expect the benchmark home price index will rise by 3.7% in 2025, with a further 3.3% growth in 2026. In the outer year of the forecast, the house price index is expected to rise more rapidly once again.
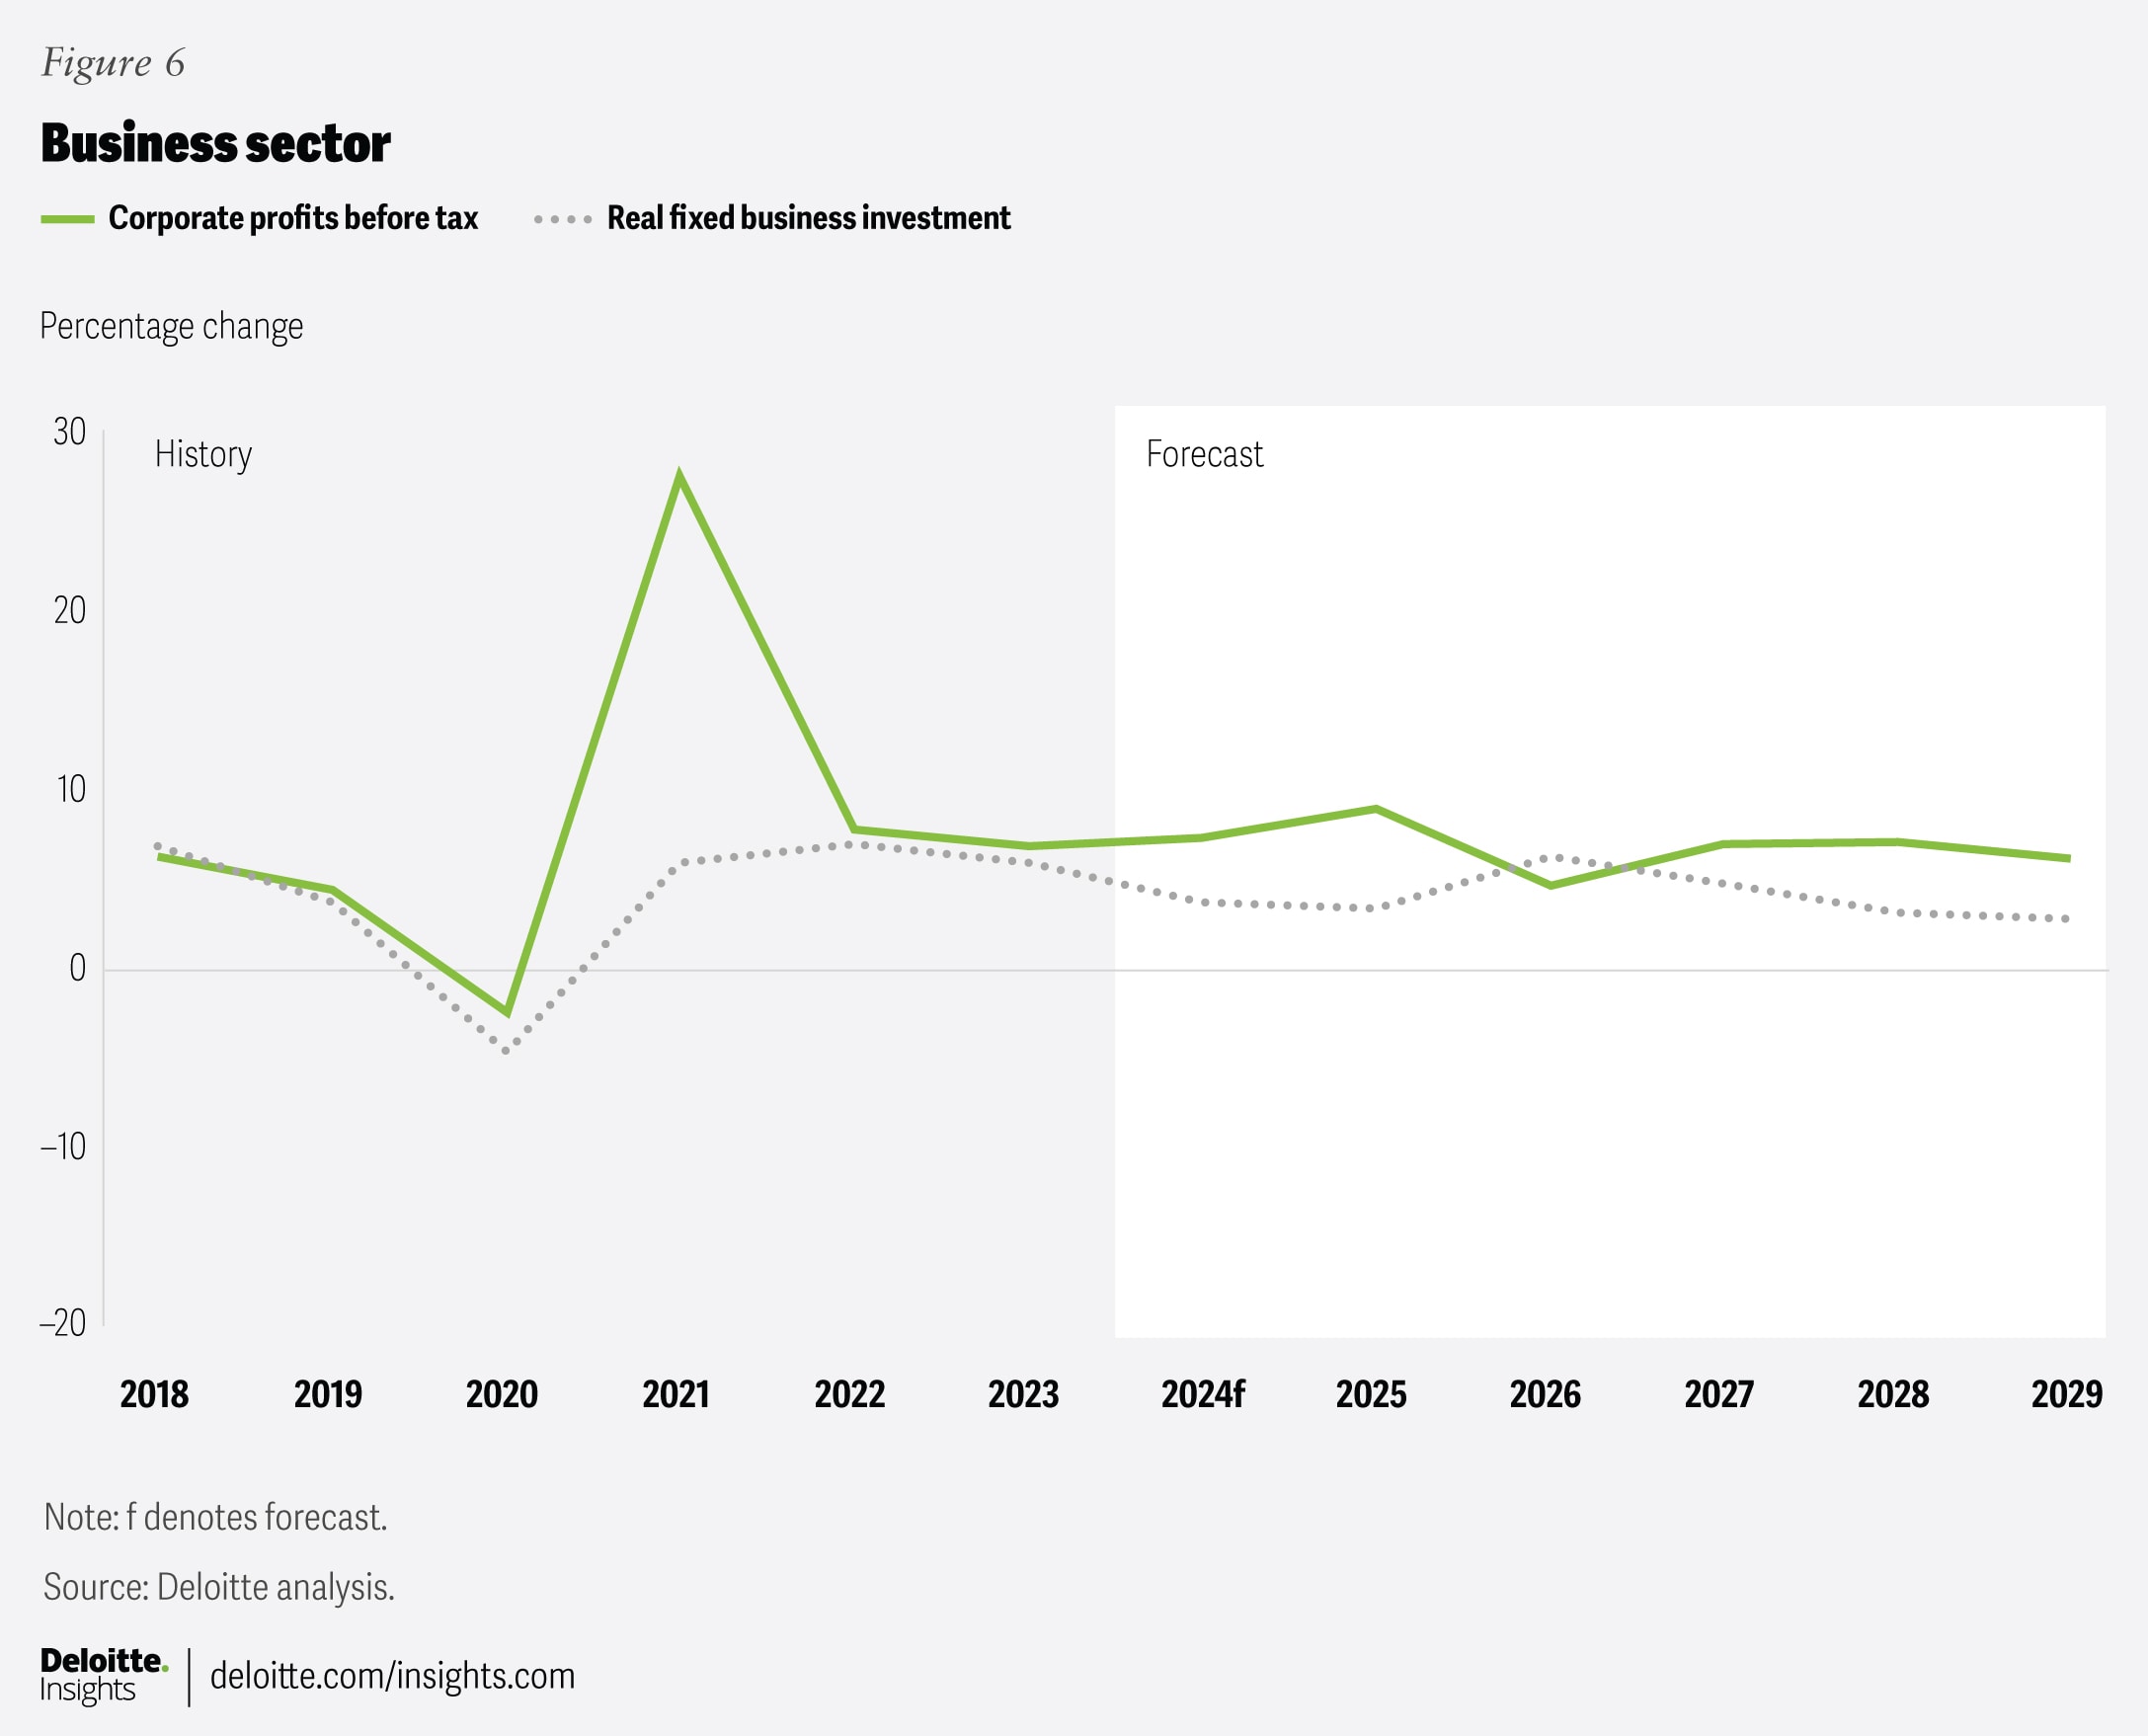
Business investment
Investment is spending that helps grow the long-term productive capacity of the economy, and as such, is one of the most important indicators of an economy’s future potential. Investment often follows a cyclical pattern, driven by commodity price booms and economic cycles. It can also be incentivized by policies like lower taxes or subsidies for investments.
Business confidence is a crucial determinant of the level of investment growth, as businesses need to feel positive about their future potential to justify spending money to grow their operations. Unfortunately, business confidence is weakening in the face of uncertainty. The National Federation of Independent Business’ small business optimism index dropped in January and February.10 In addition, several regional Federal Reserve Bank surveys reported a sharp drop in the outlook for business conditions.11
Interest rates also influence investment. The average corporate borrowing rate increased to nearly 7% by the end of 2023 and remained above 6% throughout 2024, presenting a barrier to firms who need to borrow to invest. However, many firms still have more cash on hand than they did before the pandemic,12 and they can consequently avoid borrowing at these rates.
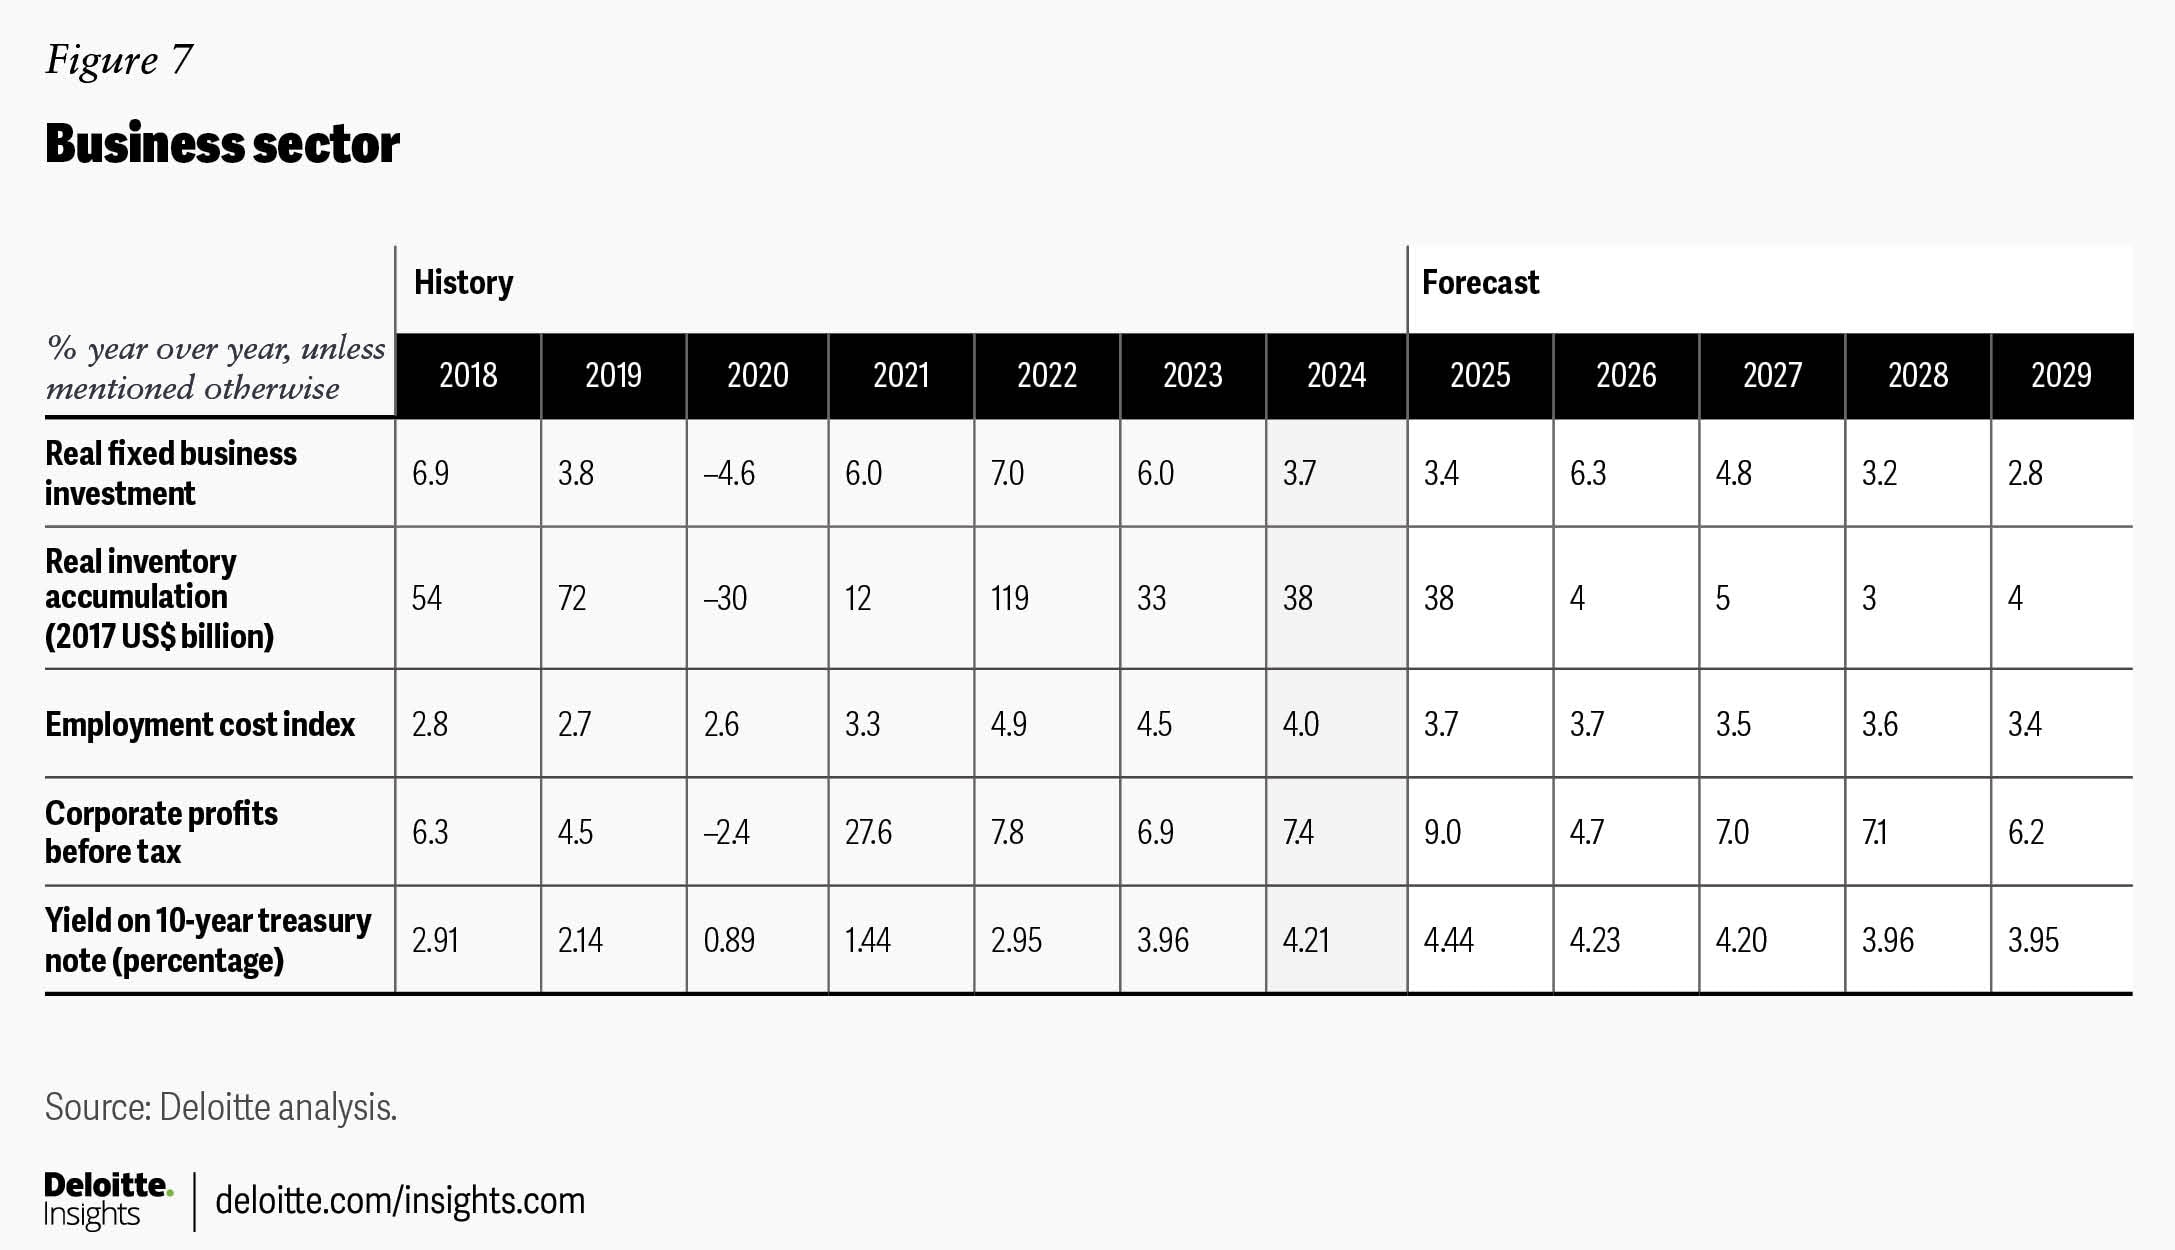
After posting a 1.1% decline in the last quarter of 2024, we predict investment in structures to fall another 1.4% in the first quarter of 2025 before slowly rising once again. Overall, we predict investment in structures to fall 0.1% in 2025 but rise 4.2% in 2026, which is significantly below the 10.8% gains recorded in 2023.
Besides structures construction, other types of business investment include spending on machinery and equipment (M&E), such as on computers or industrial equipment, and on intellectual property, such as software or AI. Both types of spending have seen a strong upward trend over time, although M&E spending fell by 7.8% in the final quarter of 2024. We expect the strong growth trend to return for the rest of the forecast period. The resumption of bonus depreciation that has been gradually phased out under the TCJA is expected to support such spending. Our forecast shows M&E investments rising 2.3 % in 2025, with growth picking up to 6.3% in 2026. We see intellectual property spending rising 4.3% in 2025 and 4.9% in 2026.
Overall, in 2025, we predict business investment to rise 3.4%, slowing slightly from the 3.7% recorded in 2024. However, once uncertainty starts to ease, we expect growth in business investment to pick up, rising 6.3% in 2026.
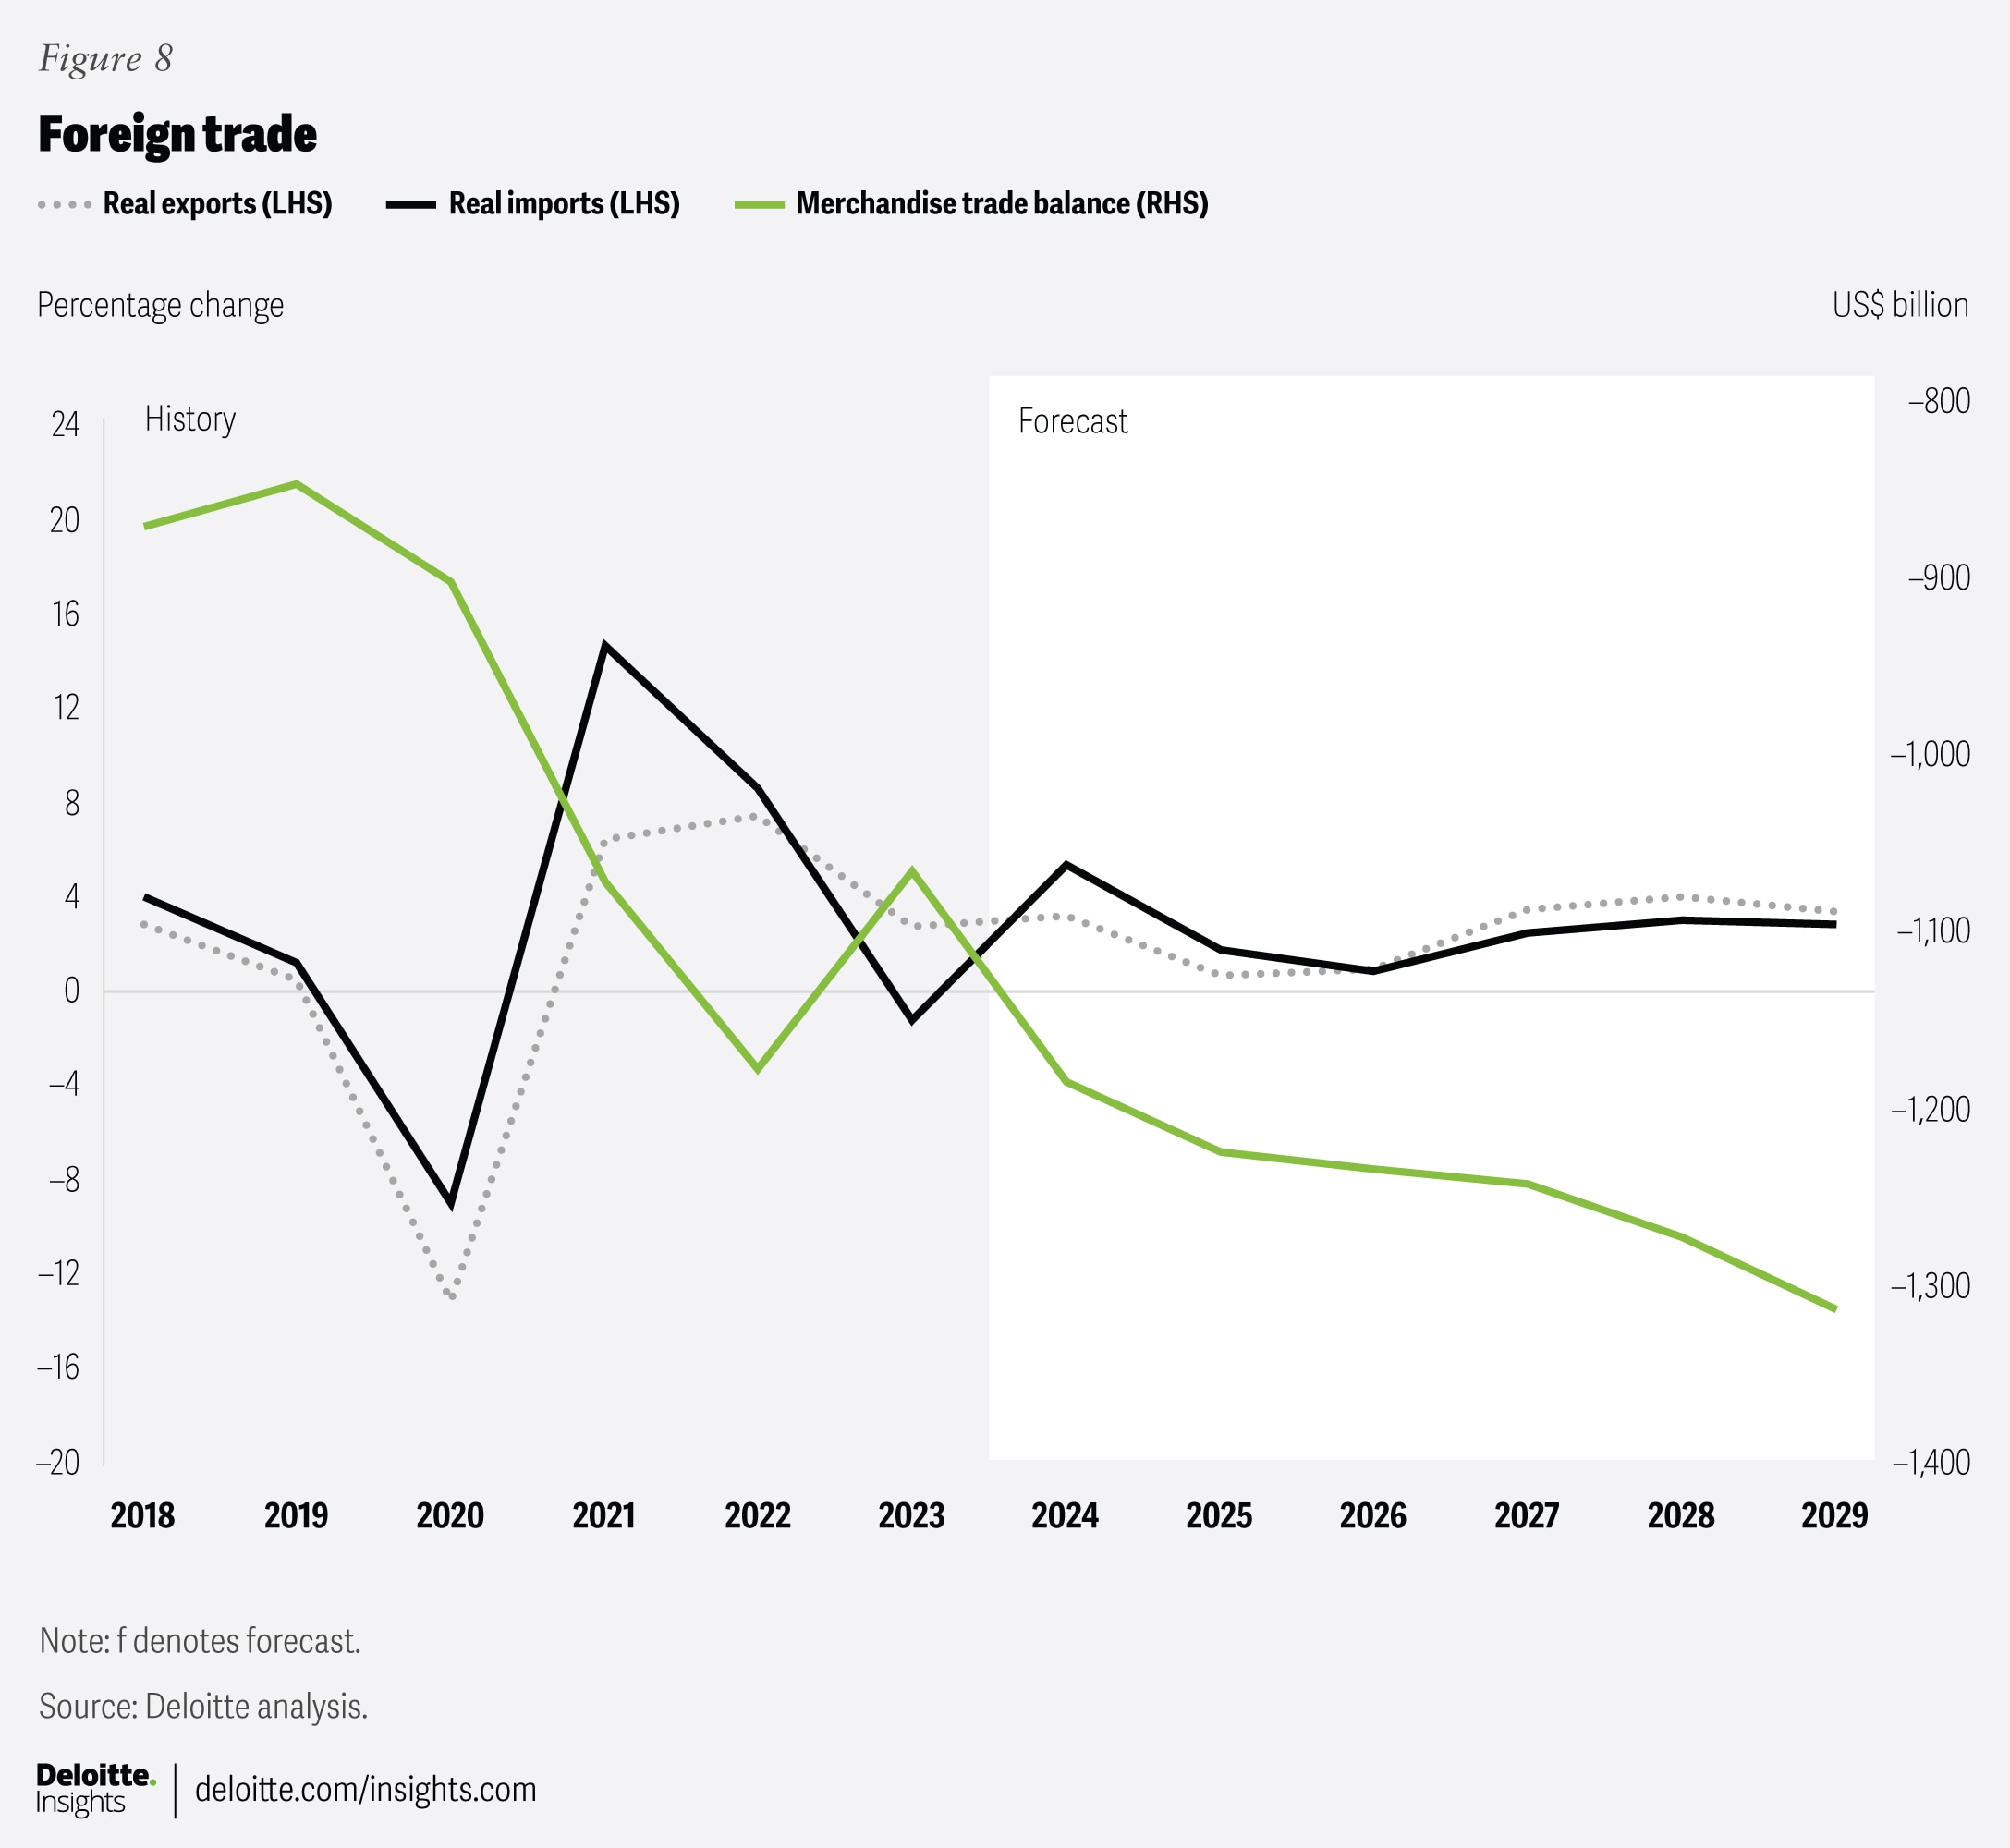
Foreign trade
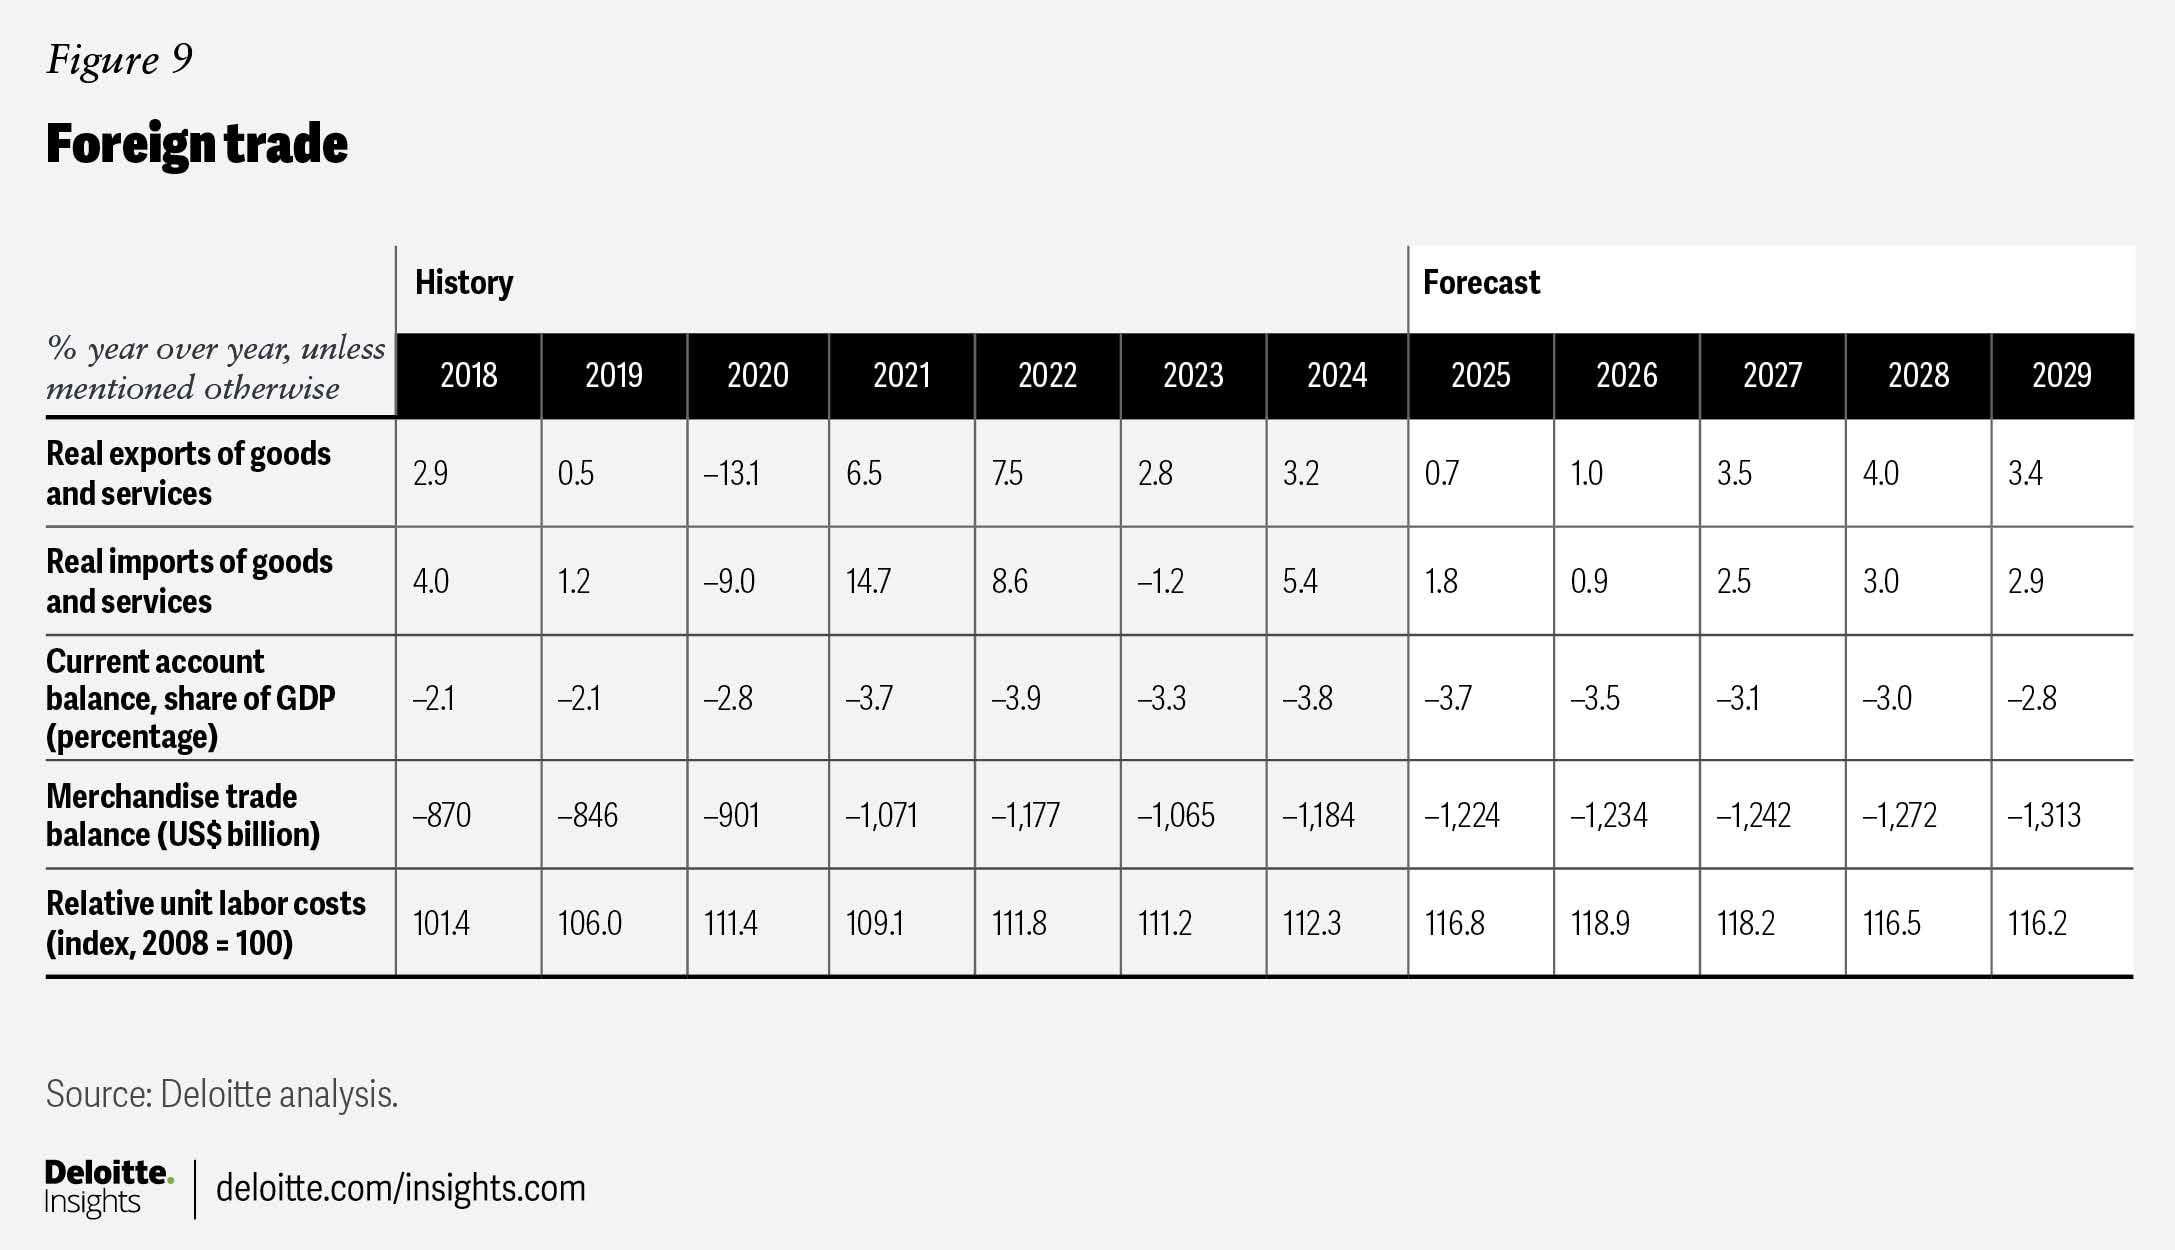
Foreign trade remains the sector with the biggest question marks surrounding it. Tariff details are being changed on a near-daily basis. At the time of writing, some of the measures that have been announced (but have not necessarily taken effect) include a 25% tariff on most goods imported from Canada and Mexico; 20% additional tariffs on Chinese imports; 25% tariffs on steel, aluminum, automobiles, pharmaceuticals, and semiconductors; and expected reciprocal tariffs against all countries’ tariff and nontariff barriers to trade.13 Given the difficulty of predicting the specific package of tariffs that will be introduced, or the possible length of time they will remain in force, we have chosen to build our forecast around the potential increase in the average tariff rate, rather than on a specific selection of imports.
In our baseline scenario, we raise the average tariff rate on goods imports by five percentage points, from approximately 3.3% to 8.3%. This level implies that many of the proposed tariffs will not end up being implemented, or will not be left in place for long. Readers can also refer to our downside scenario, which contains a 10-percentage-point increase in the average tariff rate, for an indication of what might happen if a larger range of tariffs do take effect, or take effect for longer. That downside scenario would be roughly equivalent to a permanent 25% tariff on imports from Mexico and Canada.14
Although the tariffs in our baseline scenario are less ambitious than some of the numbers recently floated, their impact are expected to be significant, and much greater than what we saw during the president’s first term. The imposition of these tariffs is likely to turn into a complicated process involving individuals and businesses trying to make substitution and supply chain decisions based on new relative prices. As tariffs take effect at some point this year, we expect growth in exports and imports to rise by only 0.7% and 1.8% in 2025, respectively. Growth will remain limited in 2026, with exports rising only 1% and import growth slowing to 0.9%.
It may be surprising to see that exports may suffer as much as imports by the imposition of tariffs. There are a few reasons why this is the case in the short term, and why these tariffs may not have their desired impact in the long run. First, about half of imports are currently used as intermediate inputs by US businesses. It is likely to take some time for US producers to find local alternatives to the goods they are currently importing, and in the meantime, their cost of doing business will rise. This dynamic could reduce the money available to firms to invest and may drive some US producers out of business if the costs are not passed on to consumers. It will also make their exports costlier and less competitive. Second, when the United States imposes tariffs on other countries’ goods, it has the potential side effect of causing the US dollar to appreciate, leading exports from the United States to become relatively more expensive in other markets. Tariffs will shield US producers from the import competition required to make globally competitive products. So, while they may dominate the US economy, they are also likely to lose export sales, leading to limited net gain for American manufacturing.
Many of the potential benefits of tariffs would take much longer than four years to be realized, and so do not occur within our forecast horizon. In most industries, there is not a large pool of American manufacturing production currently staffed up but sitting idle. Factories will need to be built and workers hired and trained, both of which will take time. During this transition period, when there are no US-alternative goods, the cost of tariffs is likely to be borne by American households and businesses. In many cases, the reason for offshoring has as much to do with the availability of certain skills as it does cost, and reshoring all this production will require major skills-training programs to ensure an adequate supply of workers.
Government policy
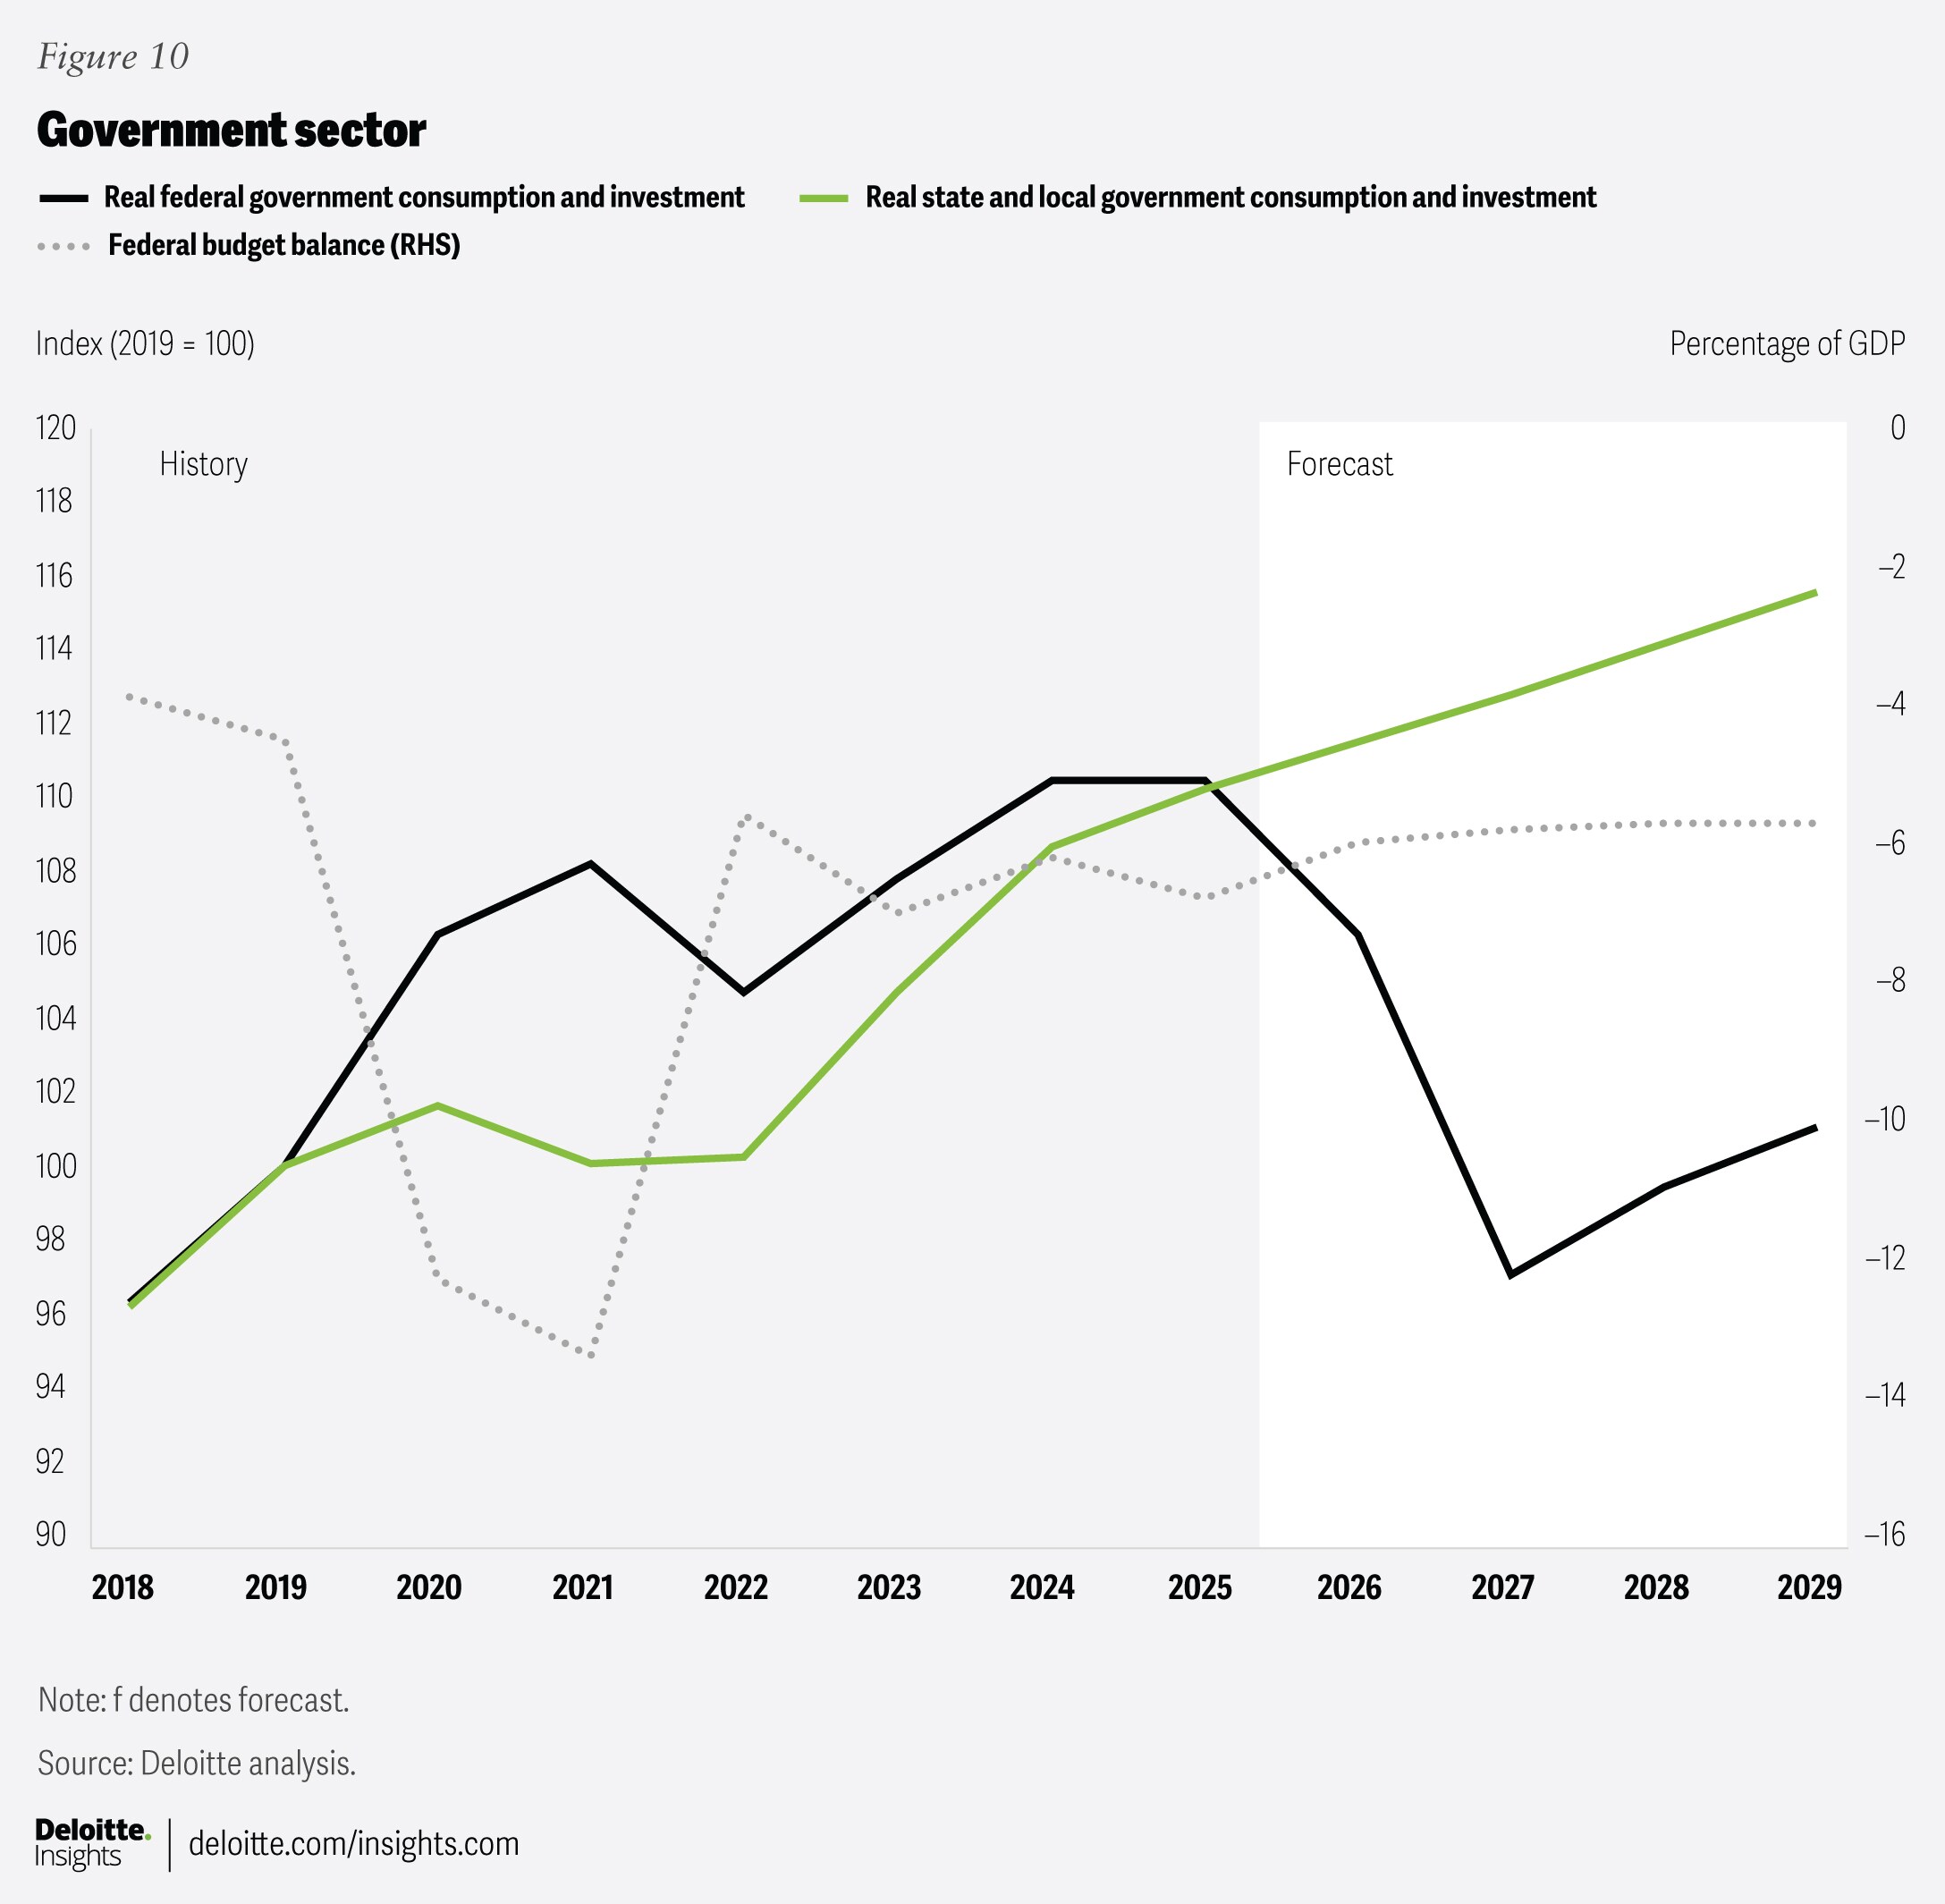
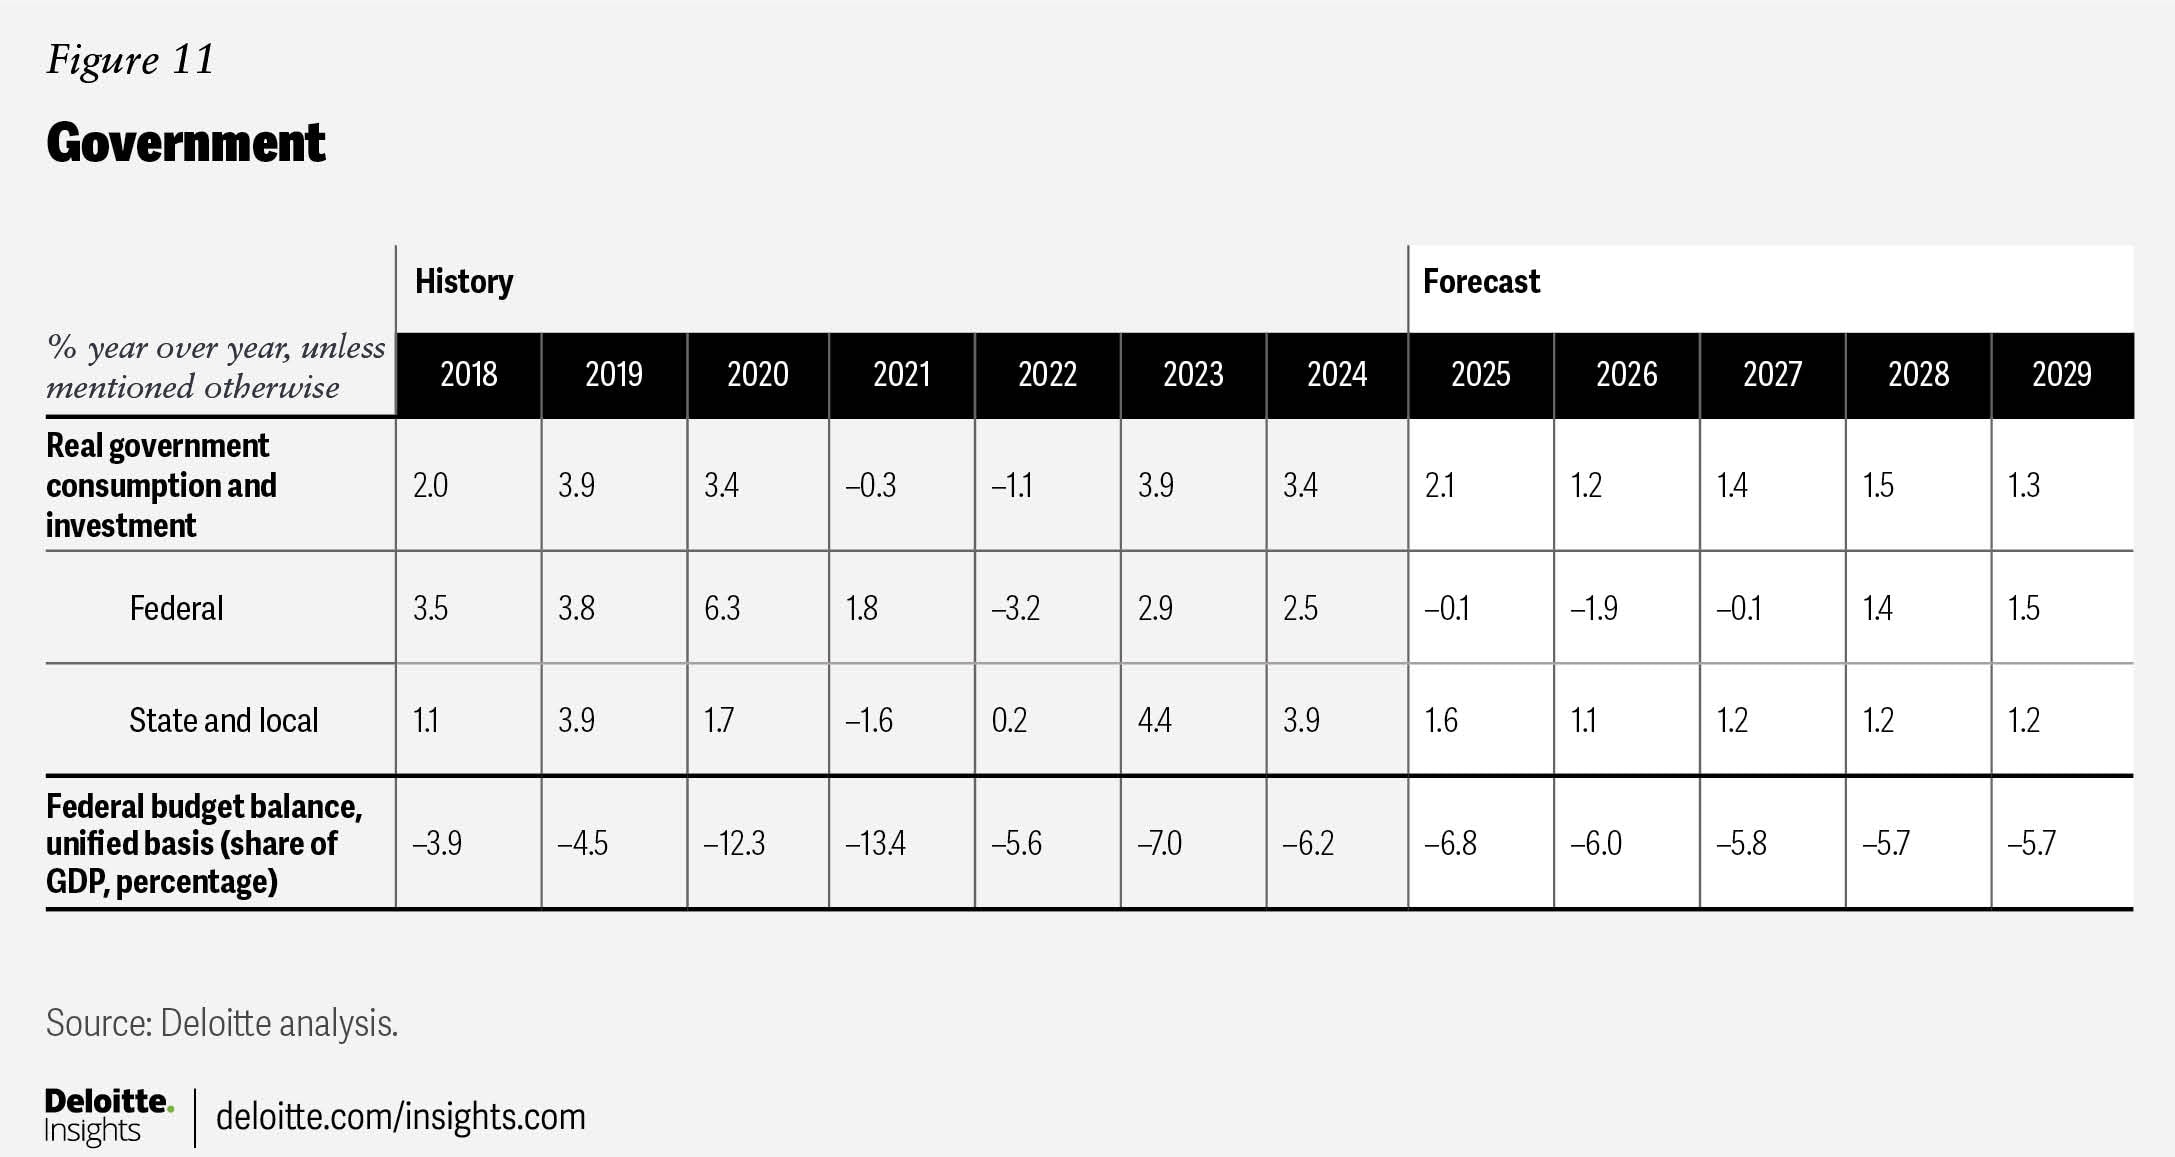
The new administration is seeking to cut government spending by establishing a Department of Government Efficiency (DOGE) to coordinate this task. So far, more than 75,000 government employees—about 3% of the total federal workforce—have reportedly accepted buyout offers.15 The administration has also said it will lay off all federal employees still on probation, a group that numbers 220,000,16 though the courts have since delayed these efforts. The federal government spends about US$270 billion on salaries for workers; assuming these layoffs all occur, and are not offset by new hiring for the administration’s priorities, they would save around US$30 billion per year—or 0.5% of total federal spending.
Several agencies, such as the United States Agency for International Development and the Consumer Financial Protection Bureau, have been severely downsized. As of this writing, the president is expected to issue an executive order that eliminates all functions that are not statutorily mandated by Congress. The extent to which these actions have a material impact on spending remains to be seen. Some of the cuts have been put on hold by the courts, as some of the spending represents Congressionally mandated spending.17 According to the latest projections from the Congressional Budget Office, the federal government is on track to spend US$39.5 billion on international development and US$144.5 billion on education and training in 2025.18 Eliminating this spending would require bipartisan support in the Senate.
In addition to the potential savings mentioned above, it is quite likely that the new administration and Congressional Republicans will have their own priority areas that will attract new spending, so the net savings will likely be somewhat less. We therefore assume a total of US$200 billion per year in net spending reductions. Of course, government spending is always naturally increasing with time due to population growth and inflation, so this figure represents savings versus a counterfactual where the cuts did not occur, not dollar reductions in overall federal spending.
On the revenue side, we assume that the TCJA tax cuts are extended at a cost of approximately US$4.5 trillion over 10 years.19 We think the tariffs modeled in this scenario could bring in approximately US$100 billion per year in new revenue, but retaliatory action by trading partners could require additional spending by the federal government—a dynamic observed in the president’s first term.20 Tariffs therefore have no net impact on revenues in the baseline scenario. In addition, Congressional Republicans are discussing whether to offset some of the cost through other budgetary savings such as spending cuts or revenue raisers.
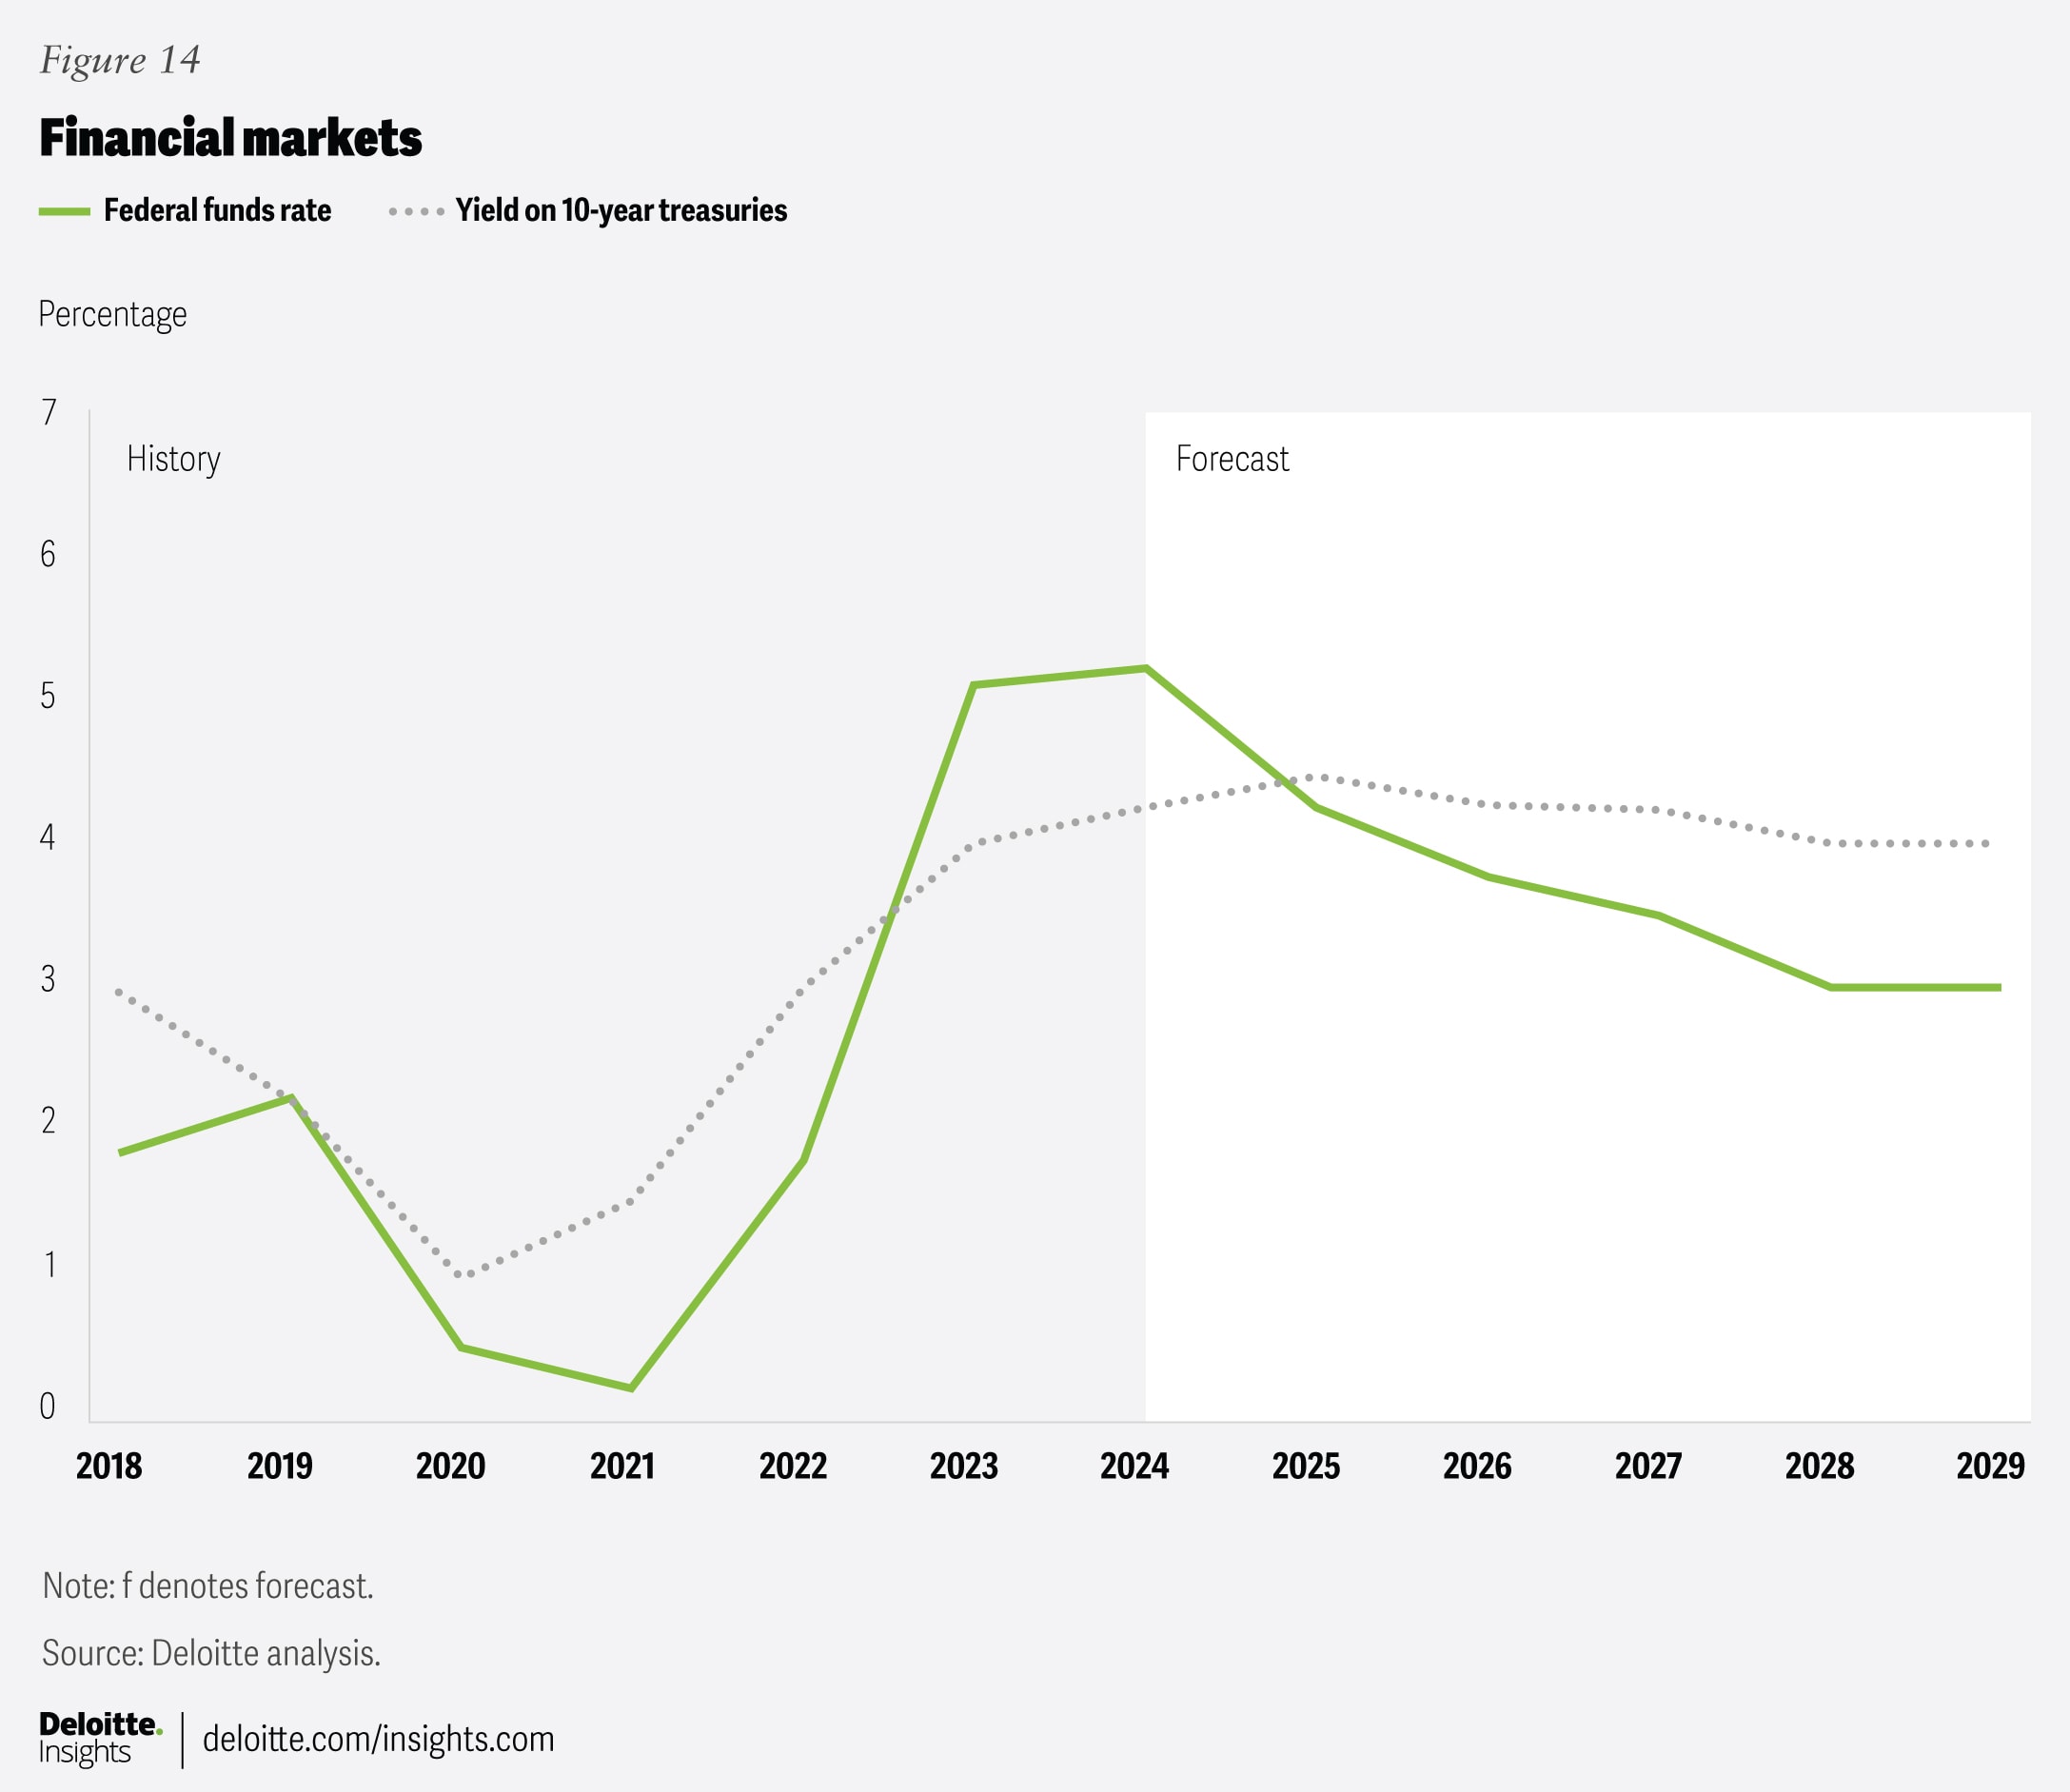
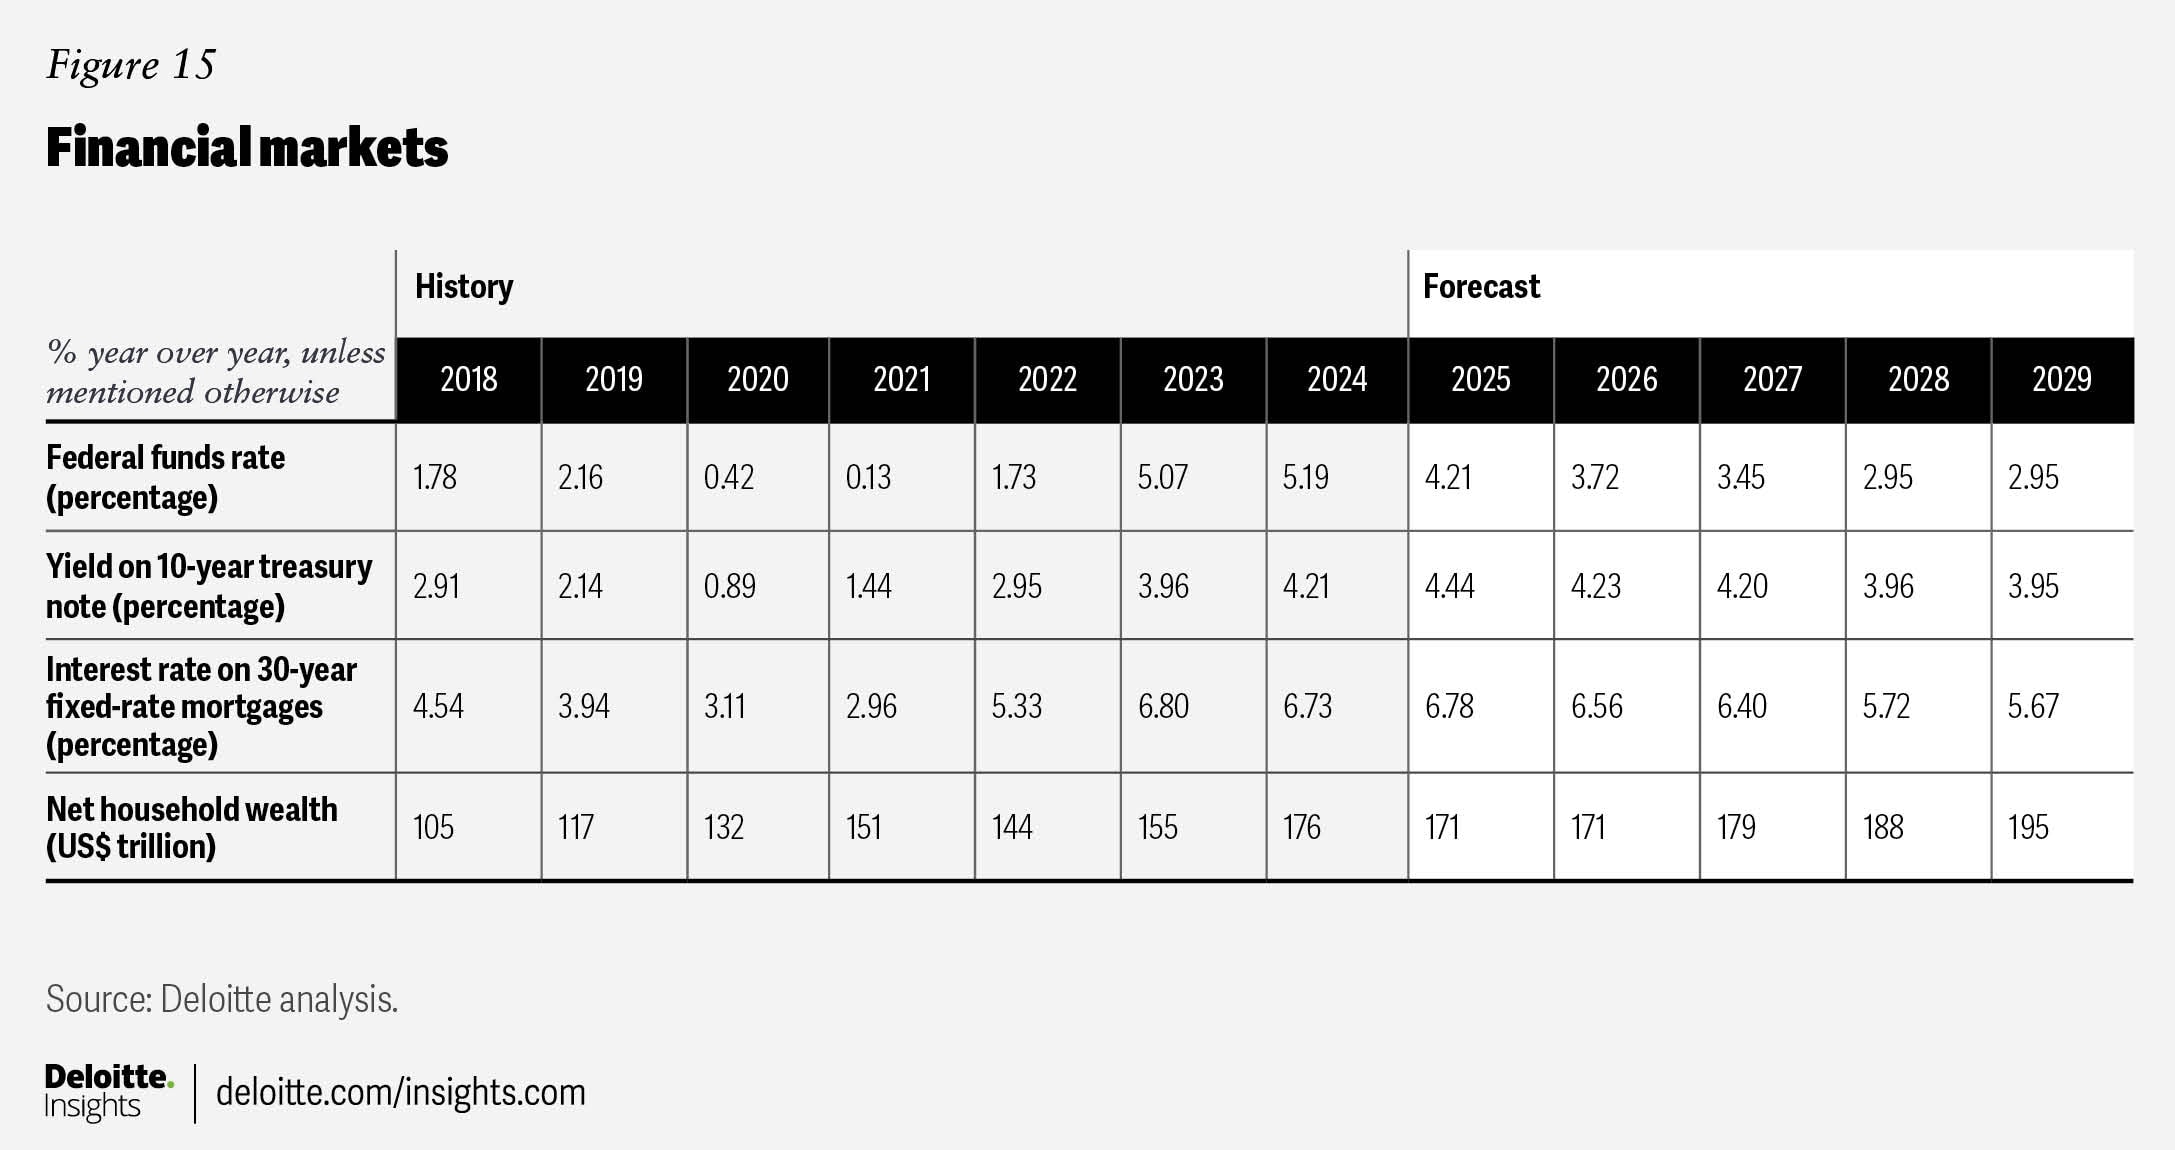
Overall, we forecast the federal budget deficit as a share of GDP to rise slightly from 6.2% in 2024 to 6.8% in 2025 before falling in the remaining years of the forecast as economic growth outpaces spending growth. With the deficit as a share of GDP falling in the longer term, we predict the 10-year federal bond rate will fall from 4.44% in 2025 to 3.95% by 2029.
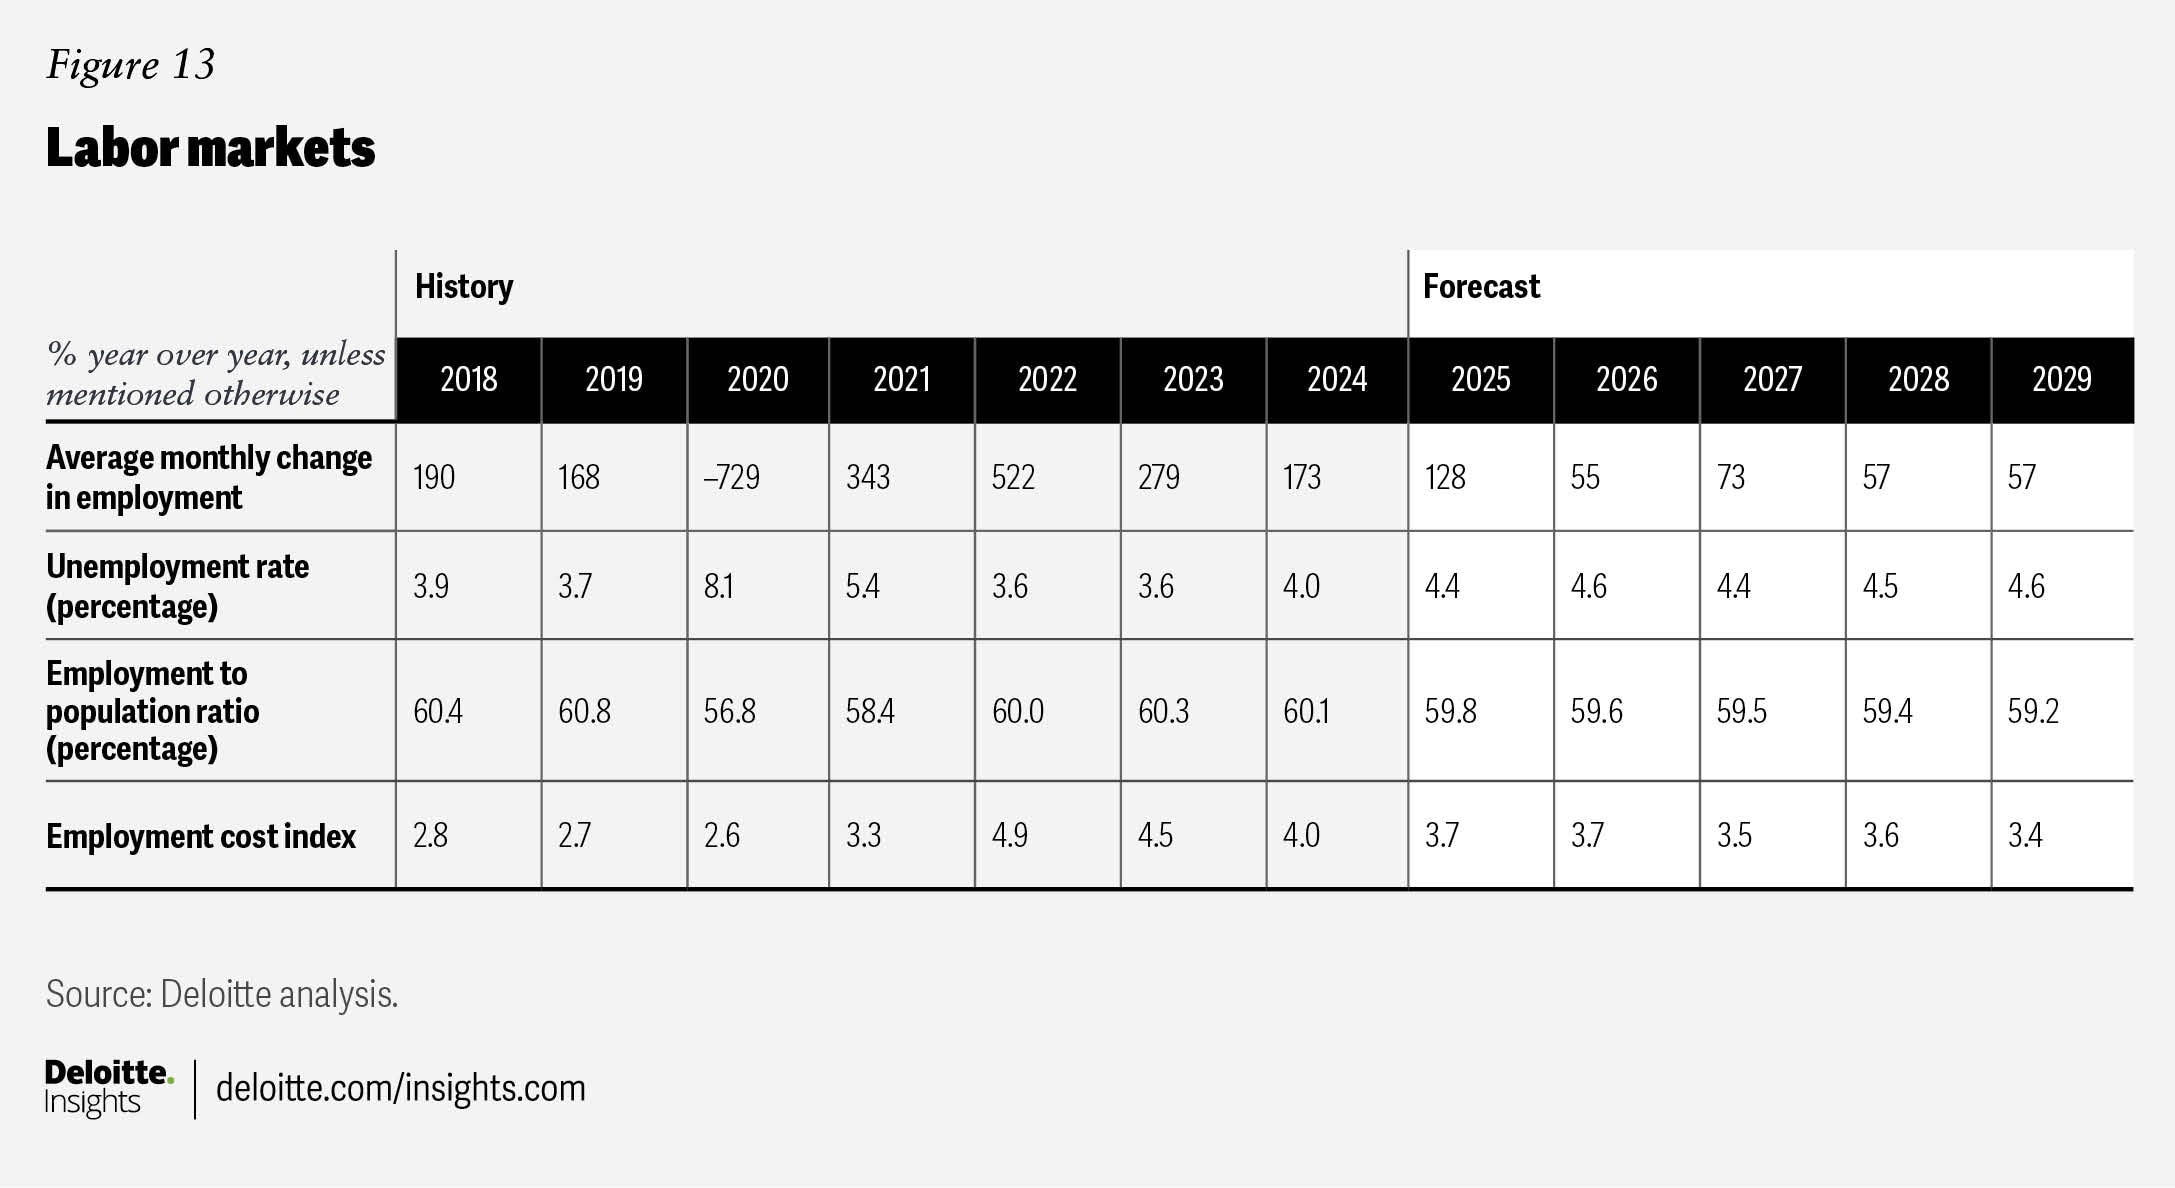
Labor markets
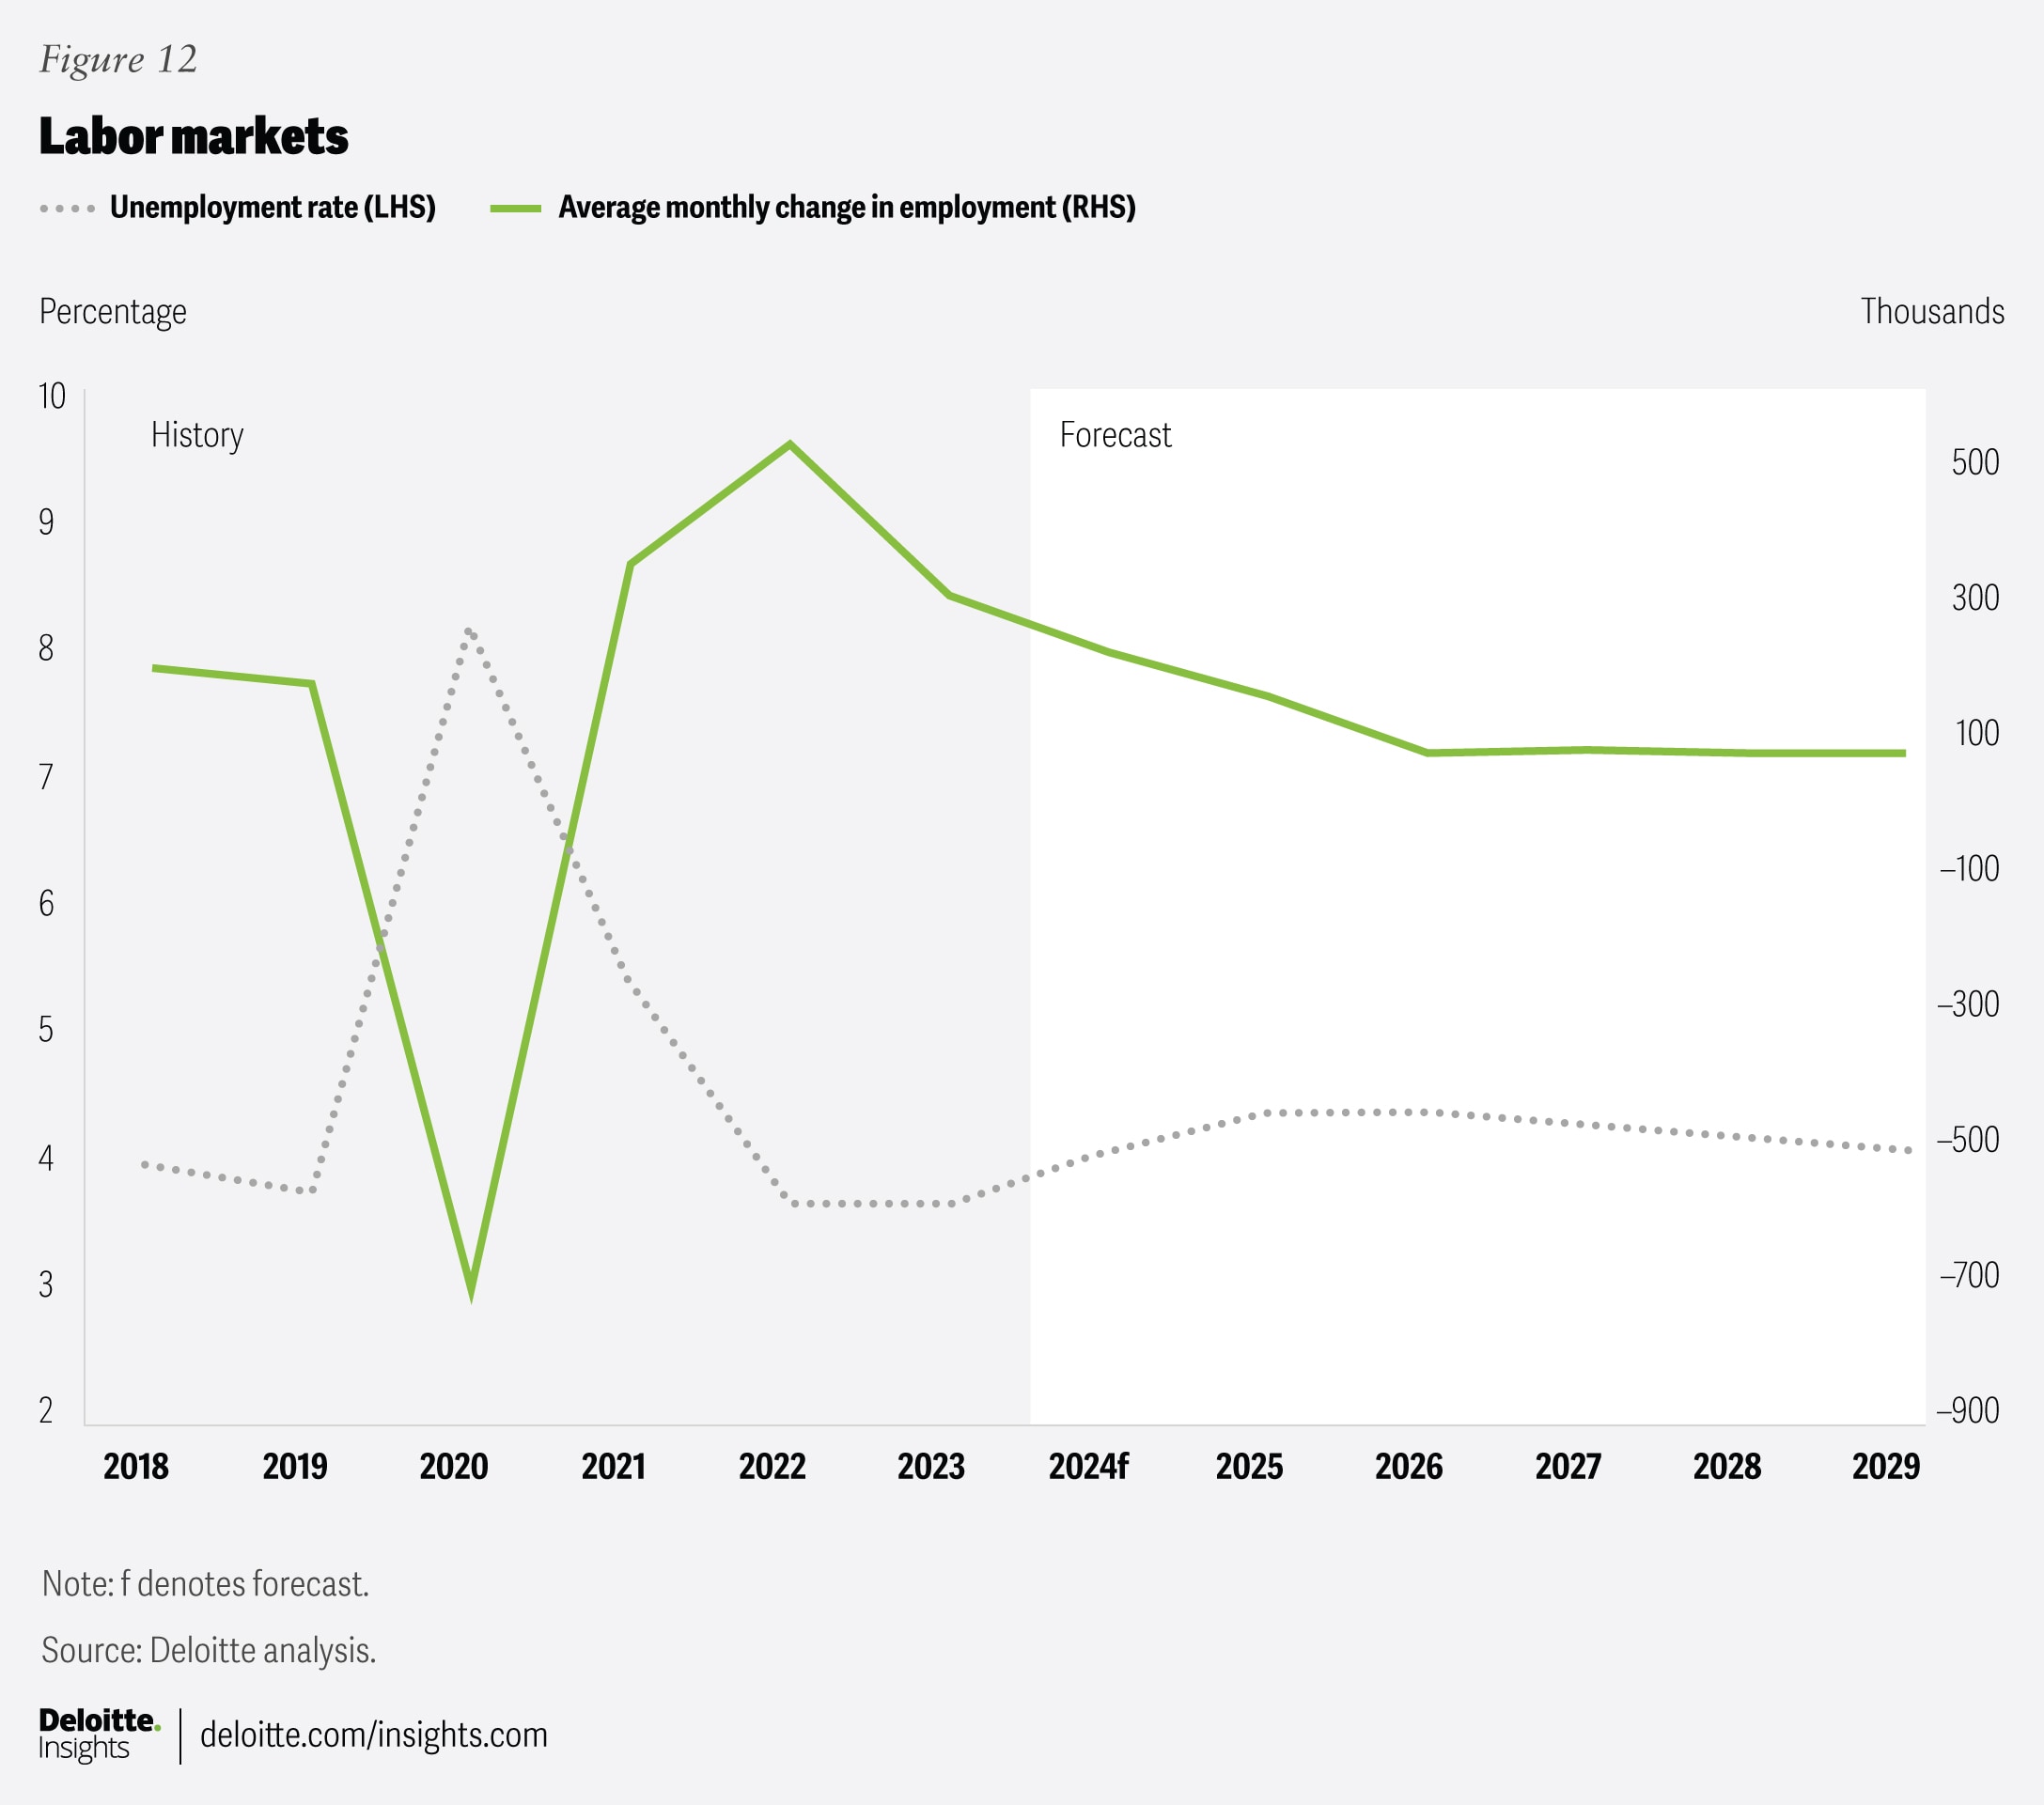
At the time of writing, labor markets continue to be healthy, with strong jobs growth and low levels of layoffs. The unemployment rate came down to 4% in January 2025, while nonfarm payroll increased by 143,000, only slightly below the 12-month average monthly gains of 166,000 observed in 2024.
In the long term, demographics are the most important determinant for labor markets. On that front, perhaps the biggest question mark remains the new administration’s immigration policy. According to recent estimates from the Migration Policy Institute, there were approximately 13.7 million undocumented immigrants in the United States as of mid-2023.21 Around three-quarters of them are a part of the labor force,22 though they are not evenly distributed across industries. Some industries rely much more on undocumented workers: According to the Department of Agriculture, 42% of agricultural workers are undocumented.23 Thus, the impact of deportations on labor supply (and therefore on wages and prices) will differ significantly across sectors of the economy. Overall, fewer people in the labor force would translate in a slower pace of job growth, as employers struggle to fill some positions.
During the election campaign, Vice President Vance indicated that deportations could reach 1 million people per year under the new administration.24 This would represent a quadrupling compared with the figure from the previous administration, and this level of deportation would result in very weak (or even negative) population growth over the forecast, with knock-on effects for labor markets.
However, to date, we have not seen evidence of that magnitude of enforcement action. Since Jan. 20, 2025, 37,000 people have been removed from the United States, below the 2024 pace of deportations.25 Ongoing appointments and staffing changes at Immigration and Customs Enforcement could potentially lead to further deportations over the rest of the year.26 For now, though, our baseline scenario expects an additional 100,000 annual deportations compared with the previous administration. The current administration has acknowledged that lack of budgetary resources impacts its ability to deport undocumented migrants. They have asked Congress for US$175 billion to help facilitate the immigration enforcement and border security efforts.
For readers interested in the implications of this immigration policy approach, our downside scenario (see beginning of the article) assumes deportations reach an additional 250,000 per year, which is below the one million used in our downside scenario in our previous forecast.
During the president’s first term, there was no major change in legal immigration levels.27 We therefore do not have any changes to legal immigration levels in any of our scenarios.
Another factor that will affect employment levels this year are the ongoing layoffs in the federal government. So far, more than 75,000 government employees have accepted buyouts,28 and the administration has said it will lay off the 220,000 federal employees still on probation.29 However, the removal of probationary employees has been challenged in the courts.30
We expect strong jobs growth to continue in the first quarter of 2025, but a slower pace for the remainder of this year and next. Although the unemployment rate fell in January, we expected it to rise again throughout 2025 and the first half of 2026 as the private sector struggles to incorporate the potential wave of newly unemployed government workers. That would cause the unemployment rate to rise above 4.5% by the third quarter of 2025 and remain elevated for the remainder of the forecast period.
Financial markets
Stock markets have shown volatility since inauguration, with the S&P 500 down slightly from its level on Jan. 20, 2025 at the time of writing in late February.31 Heightened uncertainty has also caused the US dollar to weaken after posting strong post-election gains.
Since the FOMC began its rate-cutting cycle, it cut rates worth 100 basis points, bringing the Fed’s target range to between 4.25% and 4.5%. However, policymakers are now entering a period of harder choices on interest rates.
In our baseline scenario, we think the Fed will only manage to cut rates twice this year. Stubborn inflation will slow the speed at which interest rates can be brought back to neutral, with rates finally settling at 2.875% in December 2027. In all scenarios, we expect that FOMC will maintain its independence and with its mandate remaining unchanged.
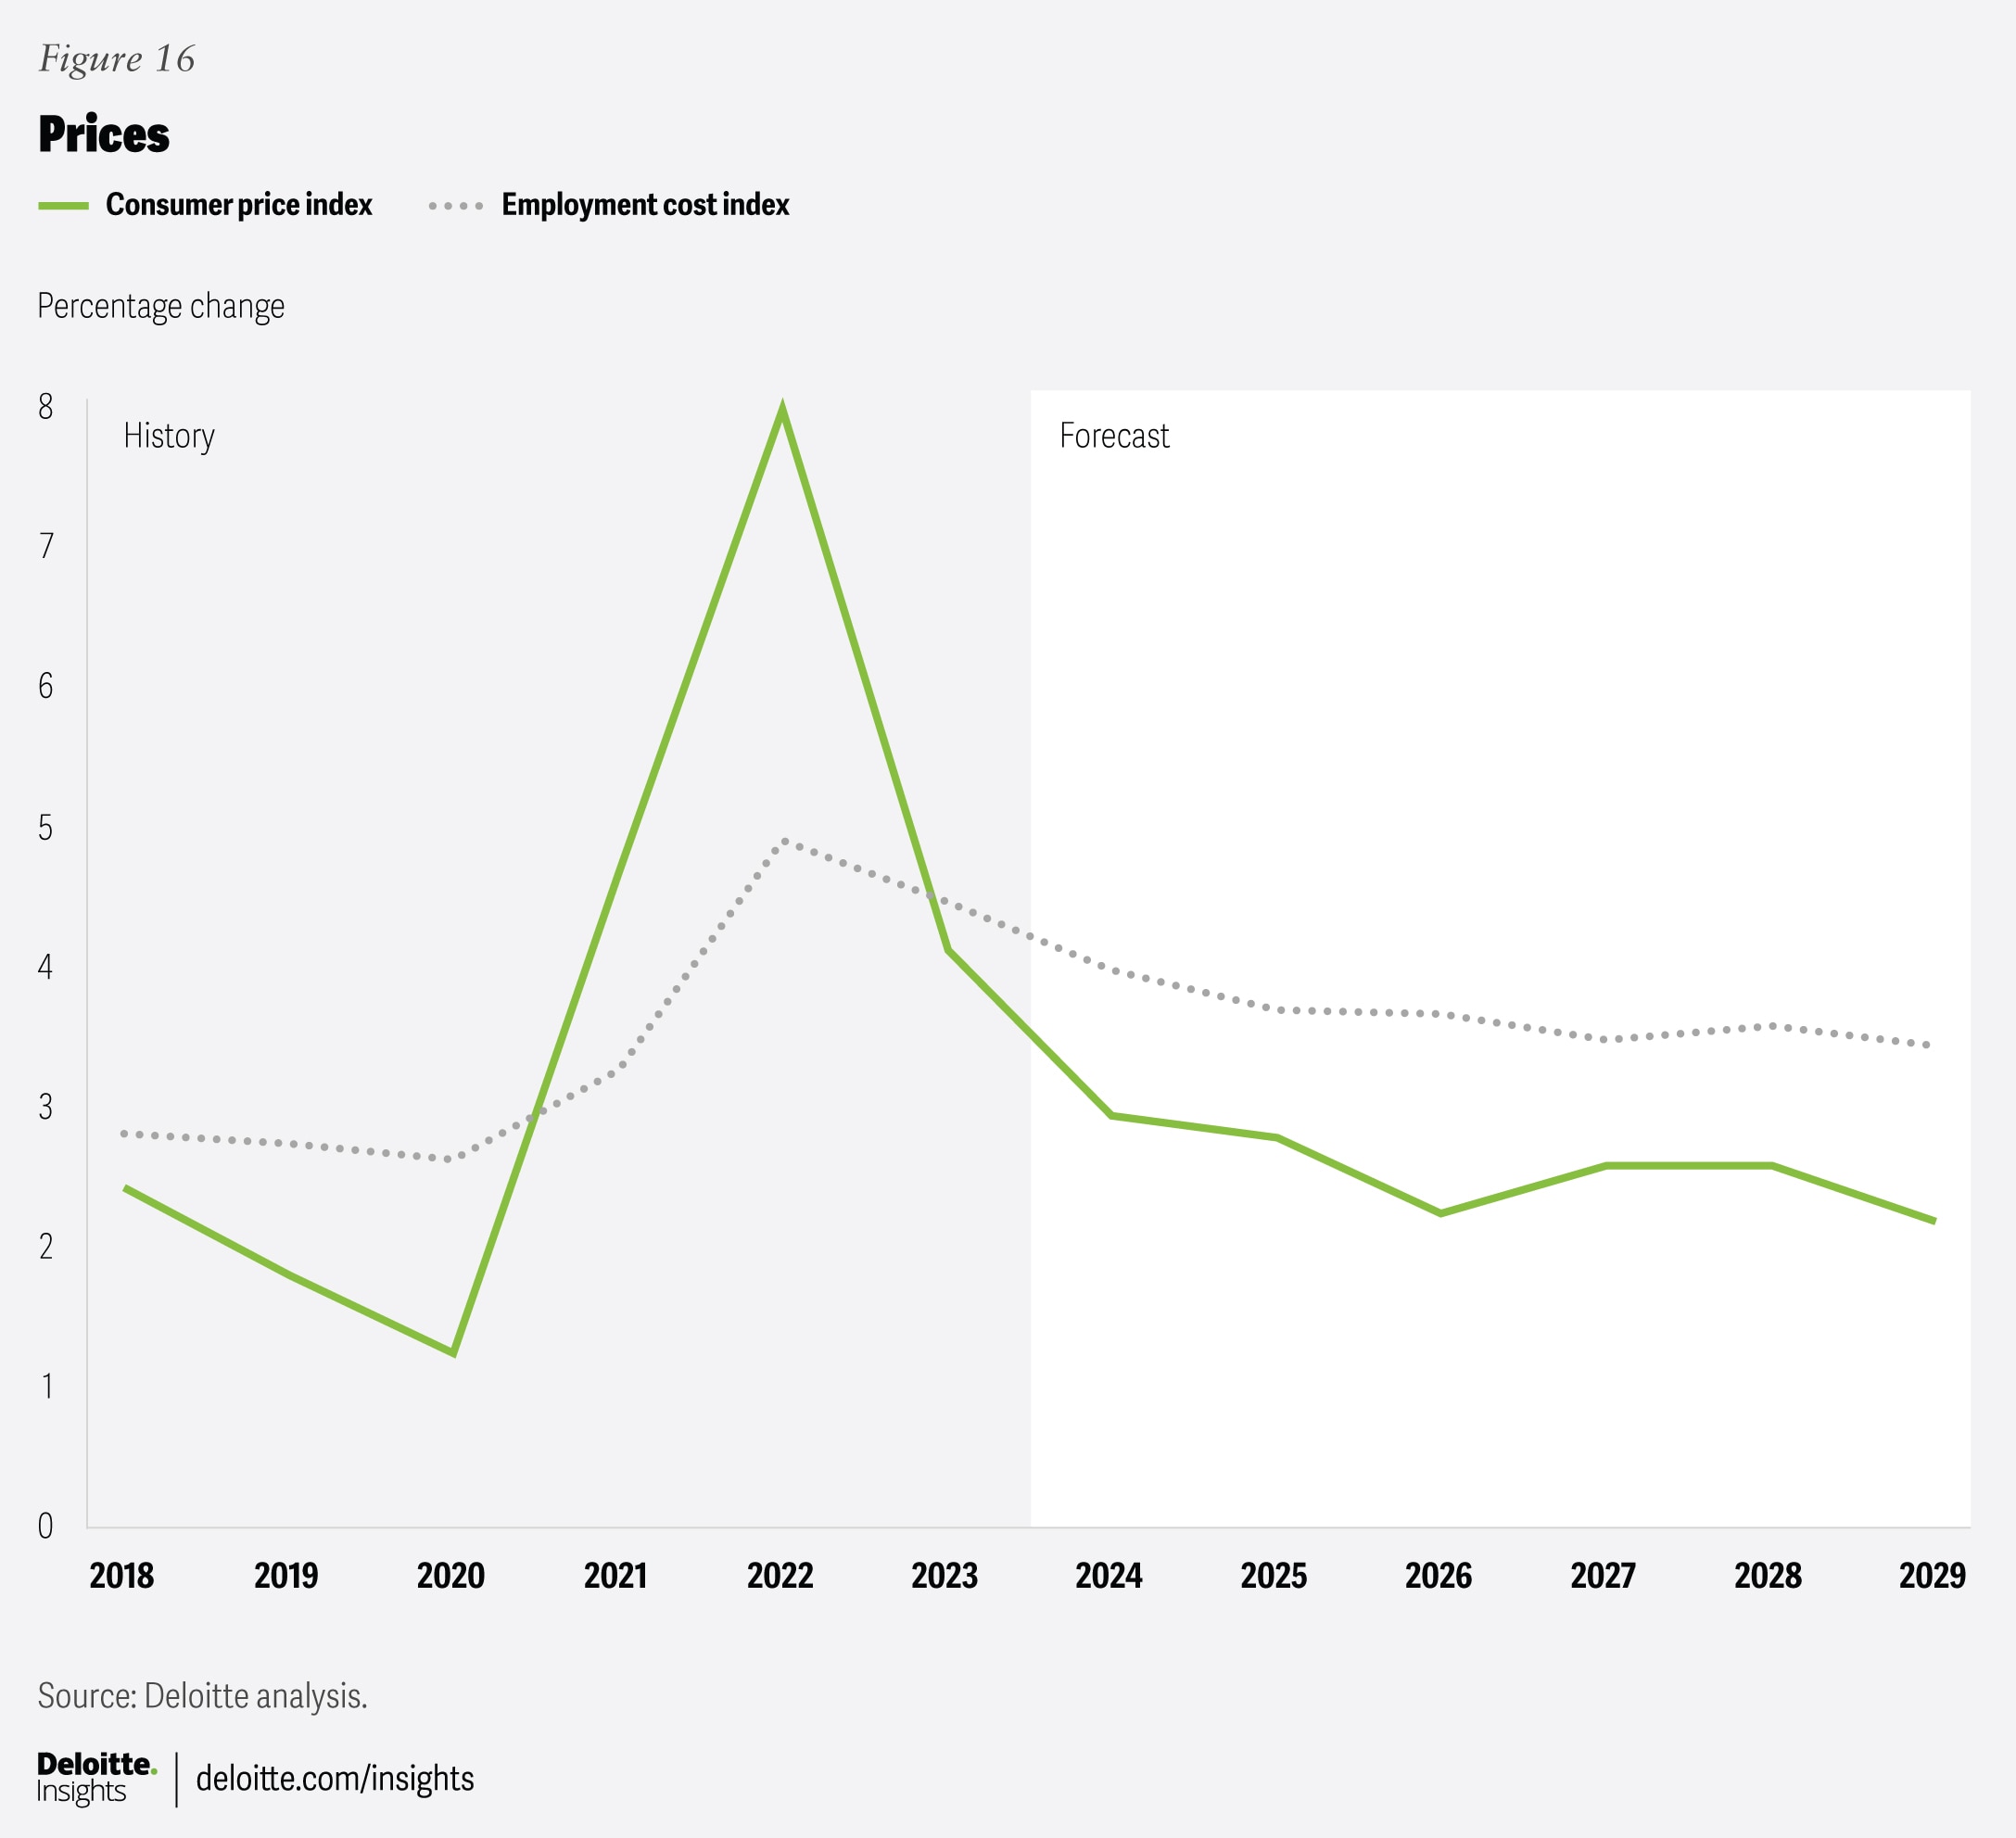
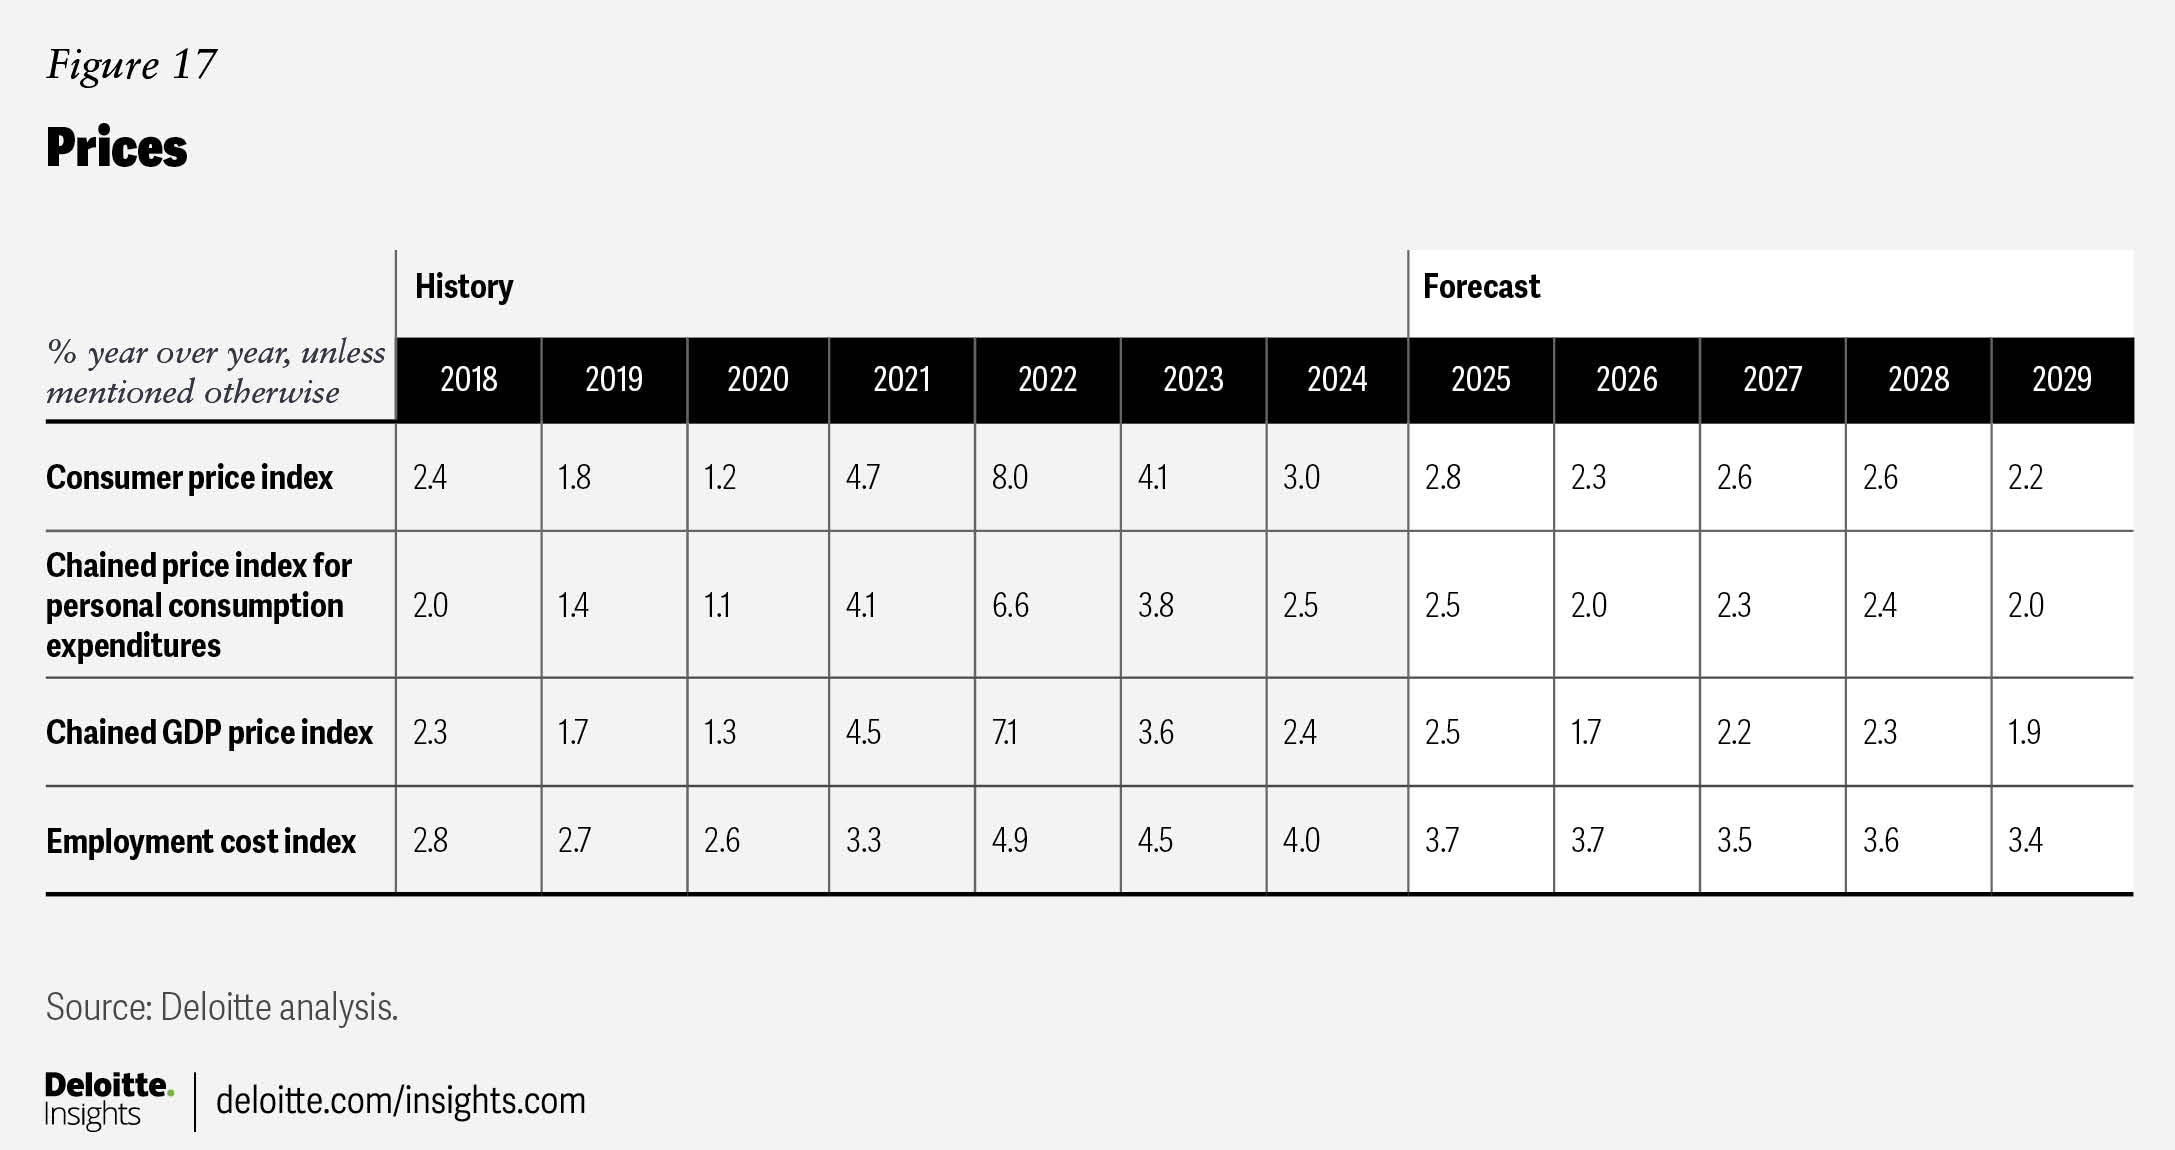
Prices
After falling through the summer and into the early fall of 2024, year-on-year consumer price index (CPI) inflation for all items has started to rise again, returning to 3% in January. While prices increased for a wide range of products and services, what caught people’s attention was the 15% increase in the price of eggs, the largest rise recorded in almost 10 years. In addition, the Fed’s preferred measure of inflation—the personal consumption expenditures deflator—came in at 2.6% year over year in December, moving further away from the Fed’s target.
Perhaps even more worryingly from the Fed’s perspective, consumers’ expectations of future inflation are starting to rise as well. In the Conference Board’s February survey of consumer confidence, forward inflation expectations shot up from 5.2% to 6%;32 in the University of Michigan’s February survey, forward inflation expectations rose from 3.3% to 4.3%.33 Because inflation expectations tend to feed through into actual inflation, the Fed’s role involves controlling not only real prices but also expectations of inflation. These data points, as well as the potential inflationary effects of tariffs, will give the FOMC a pause when considering if further interest rate cuts are appropriate.
Overall, we expect CPI inflation to remain stubbornly high in 2025 at 2.8%. Over the forecast period, we expect CPI inflation to remain above 2%, limiting the speed at which rates can be brought back down to neutral.
