Benchmarking product development in medtech What high-performing companies are doing differently
9 minute read
01 October 2020


Specific benchmarks—particularly in predictability and revenue contribution—can provide meaningful insights into I&PD performance for medtech organizations. Discover what companies are doing to drive greater market share and higher return on R&D investment.
Executive summary
Innovation and product development (I&PD) is costly. But when organizations get it right, it does more than just generate returns on that investment. A strong I&PD strategy can help medtech companies drive greater market share and offer value to patients and customers. The key? Delivering the right products to the market at the right time.
To understand where medtech companies stand in fulfilling this objective, Deloitte and AdvaMed conducted a benchmarking analysis of data from 20 medtech company business units. The research found that:
- Companies with the highest new product revenue contribution focus more on transformational products and invest in upfront market understanding and technology exploration.
- Companies that successfully meet new product development (NPD) predictability metrics focus more on upfront technology development and external collaboration.
Learn more
Explore the life sciences collection
Learn about Deloitte’s services
Go straight to smart. Get the Deloitte Insights app.
We found that top performers in both predictability and new product revenue contribution maintain a more realistic product development pipeline than other companies. They also use emerging practices such as agile development methodologies and advanced IT development tools to support engineering and clinical development more than others.
Looking at characteristics of the product, findings indicate that high-volume disposable product organizations tend to spend the greatest percentage of their R&D budget on sustaining engineering activities. Integrated electronics organizations tend to spend the greatest percentage of their R&D budget on transformational product development projects.
When used effectively, benchmarking provides insights into the business practices that lead to better performance. It can also help companies understand differences in resource allocation requirements and performance goals between types of products. To that end, companies looking to improve their performance can consider engaging leadership across functions and being open to business practices from outside the medtech industry.
Introduction
Effective I&PD can be fundamental to the value that market-leading medical device companies deliver to patients and customers. They have realized that it’s not a question of whether they should have an I&PD strategy, but how they can leverage it best.
Unearthing answers to that question often requires navigating a few challenges. Increasing I&PD costs have put pressure on the medtech industry to improve their return on investment. In fact, recent Deloitte research found that life sciences companies experienced the largest drops in return between 2011 and 2017 among the sectors studied during that time period.1 But product portfolios and market environments are complex and vary by company, making it difficult for medtech companies to compare their own performance to other companies in the industry.
Since 2018, Deloitte has collaborated with AdvaMed to collect data from medtech companies to underpin performance benchmarks for companies to assess and improve their I&PD performance (for details on the research methodology, see sidebar, “Methodology”). Specific financial and operational metrics allow direct and objective peer-to-peer benchmarking at the business unit/divisional levels. We also establish a framework of metrics that companies can evaluate over time, including measures related to revenue growth, portfolio investment, and execution performance.
Methodology
Deloitte and AdvaMed collected data from 20 discrete business units from 14 medtech companies to understand each organization’s I&PD spending allocation and performance on key metrics. We analyzed the data at the product and company levels and supplemented the quantitative project with several interviews of manufacturers.
We sorted business units into three different product type cohorts based on key characteristics of the products developed—integrated electronics, high-volume disposables, and mechanical implantables and useables. We also sorted business units into two cohorts based on high or low:
- Predictability—How good the company was at achieving its goals for product development projects?
- Revenue contribution—How much new products contributed to the revenue of the company over time?
To assess company performance, we looked at two metrics:
- The NPD Predictability Index. Predictability measures how reliably an organization executes on its development pipeline. The measure is based on each company’s estimation of how frequently it met revenue targets for the first-year postlaunch, product cost, margin, quality/performance, and prevention/mitigation of quality issues.
- New Product Revenue Contribution. This measures revenue growth from all new products, including core, adjacent, and transformational, launched from 2015–2017 to total revenue in 2018. It does not include sustaining engineering work (i.e. fixes to existing products). We use this metric to assess whether a company is refreshing its revenue base with new products. New products are critical to overall revenue growth for a company. They can create stickiness to core products while also allowing companies to explore new technologies and test consumer trends. However, if the products do not resonate with customers and convert to sales, the investment in I&PD is lost. This metric, in addition to other metrics such as the Pipeline Loading Index (PLI; see Appendix for definition), can help companies assess whether the investment in NPD is worthwhile in the context of overall and relative revenue.
Key findings
Revenue top performers focus more on transformational products, market understanding
Top-performing companies on the New Product Revenue Contribution metric had a threefold increase in their 2018 revenue from products launched between 2015 and 2017 compared to others. They came from all three product type cohorts and serve a variety of therapy markets. This indicates that better performance neither depends on the types of products a company develops nor the markets it participates in, but instead on how it allocates its spending and manages its product development.
Further analysis of the top-performing companies highlighted several key differences in how they allocate their spending (figure 1).
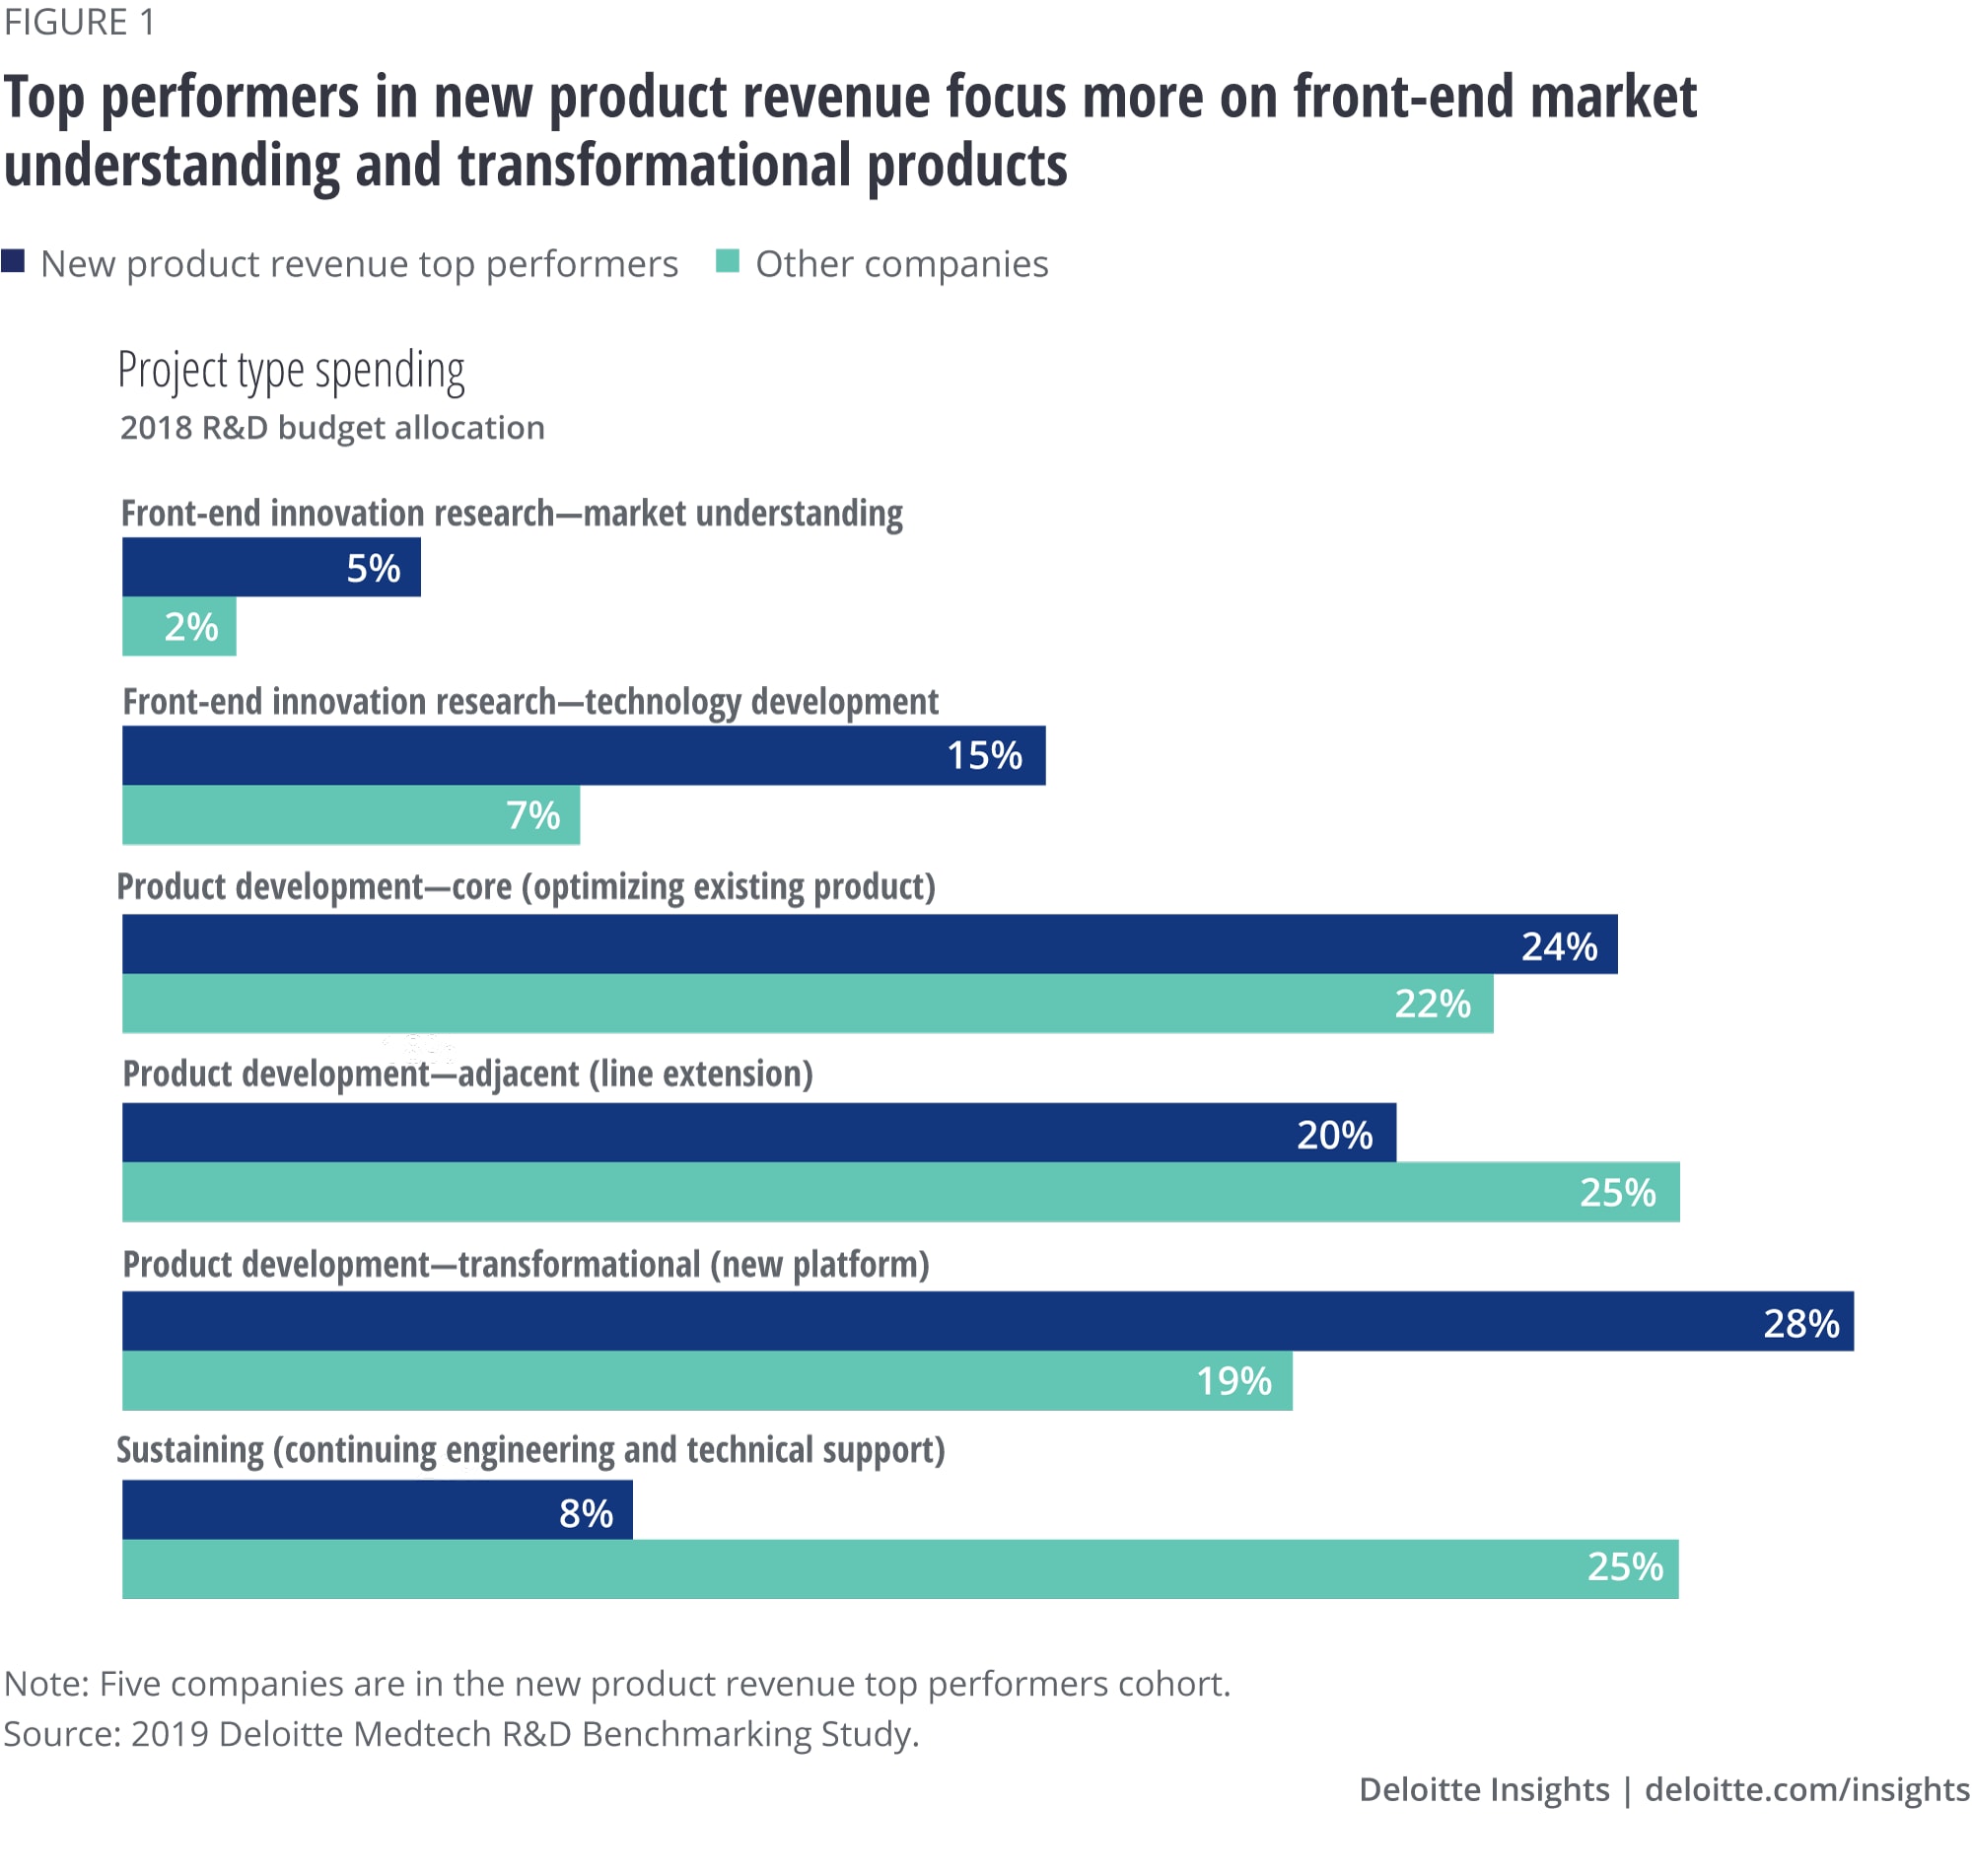
- Increased focus on transformational products: Top-performing companies in this cohort reported allocating nearly twice the amount of R&D budget to transformational products as other companies for 2018. This indicates that these companies are actively investing in being innovation leaders in the market in order to drive higher growth.
- Higher spending on front-end market understanding: Top performers reported allocated nearly twice the amount of investment in front-end market research than the average of the rest of the business units. Just as investing in early technical derisking improves predictability, high-performing companies appear to be investing in understanding the market to derisk the investments in market-leading transformation products.
- Less focus on sustaining products: They also spent a mere third of their budget on sustaining products compared to companies with lower transformational product revenue, signaling a shift in attention from existing products toward innovation.
Follow-up interviews also supported these findings. Top performers do indeed favor investing in market understanding early and throughout the product development process. These investments include not only typical market research but also active engagement with customers, product users, and in some cases, patients, in order to understand true unmet needs that can be the source of transformational product value.
Top performers also employ forward-thinking product strategies that schedule the resourcing of early-stage technologies and new transformational products to drive product innovation life cycles within the markets they serve. Although the nature of the required market and technology research activities varies, the commitment to those efforts results in a continuous stream of market leading products.
The commitment to deliver new products may also be why top performers spend less on sustaining engineering than other companies—the regular release allows them to take older products off the market without negative impact on revenue. Older products tend to consume greater amounts of sustaining investment.
Predictability top performers spend more on technology research and external collaboration
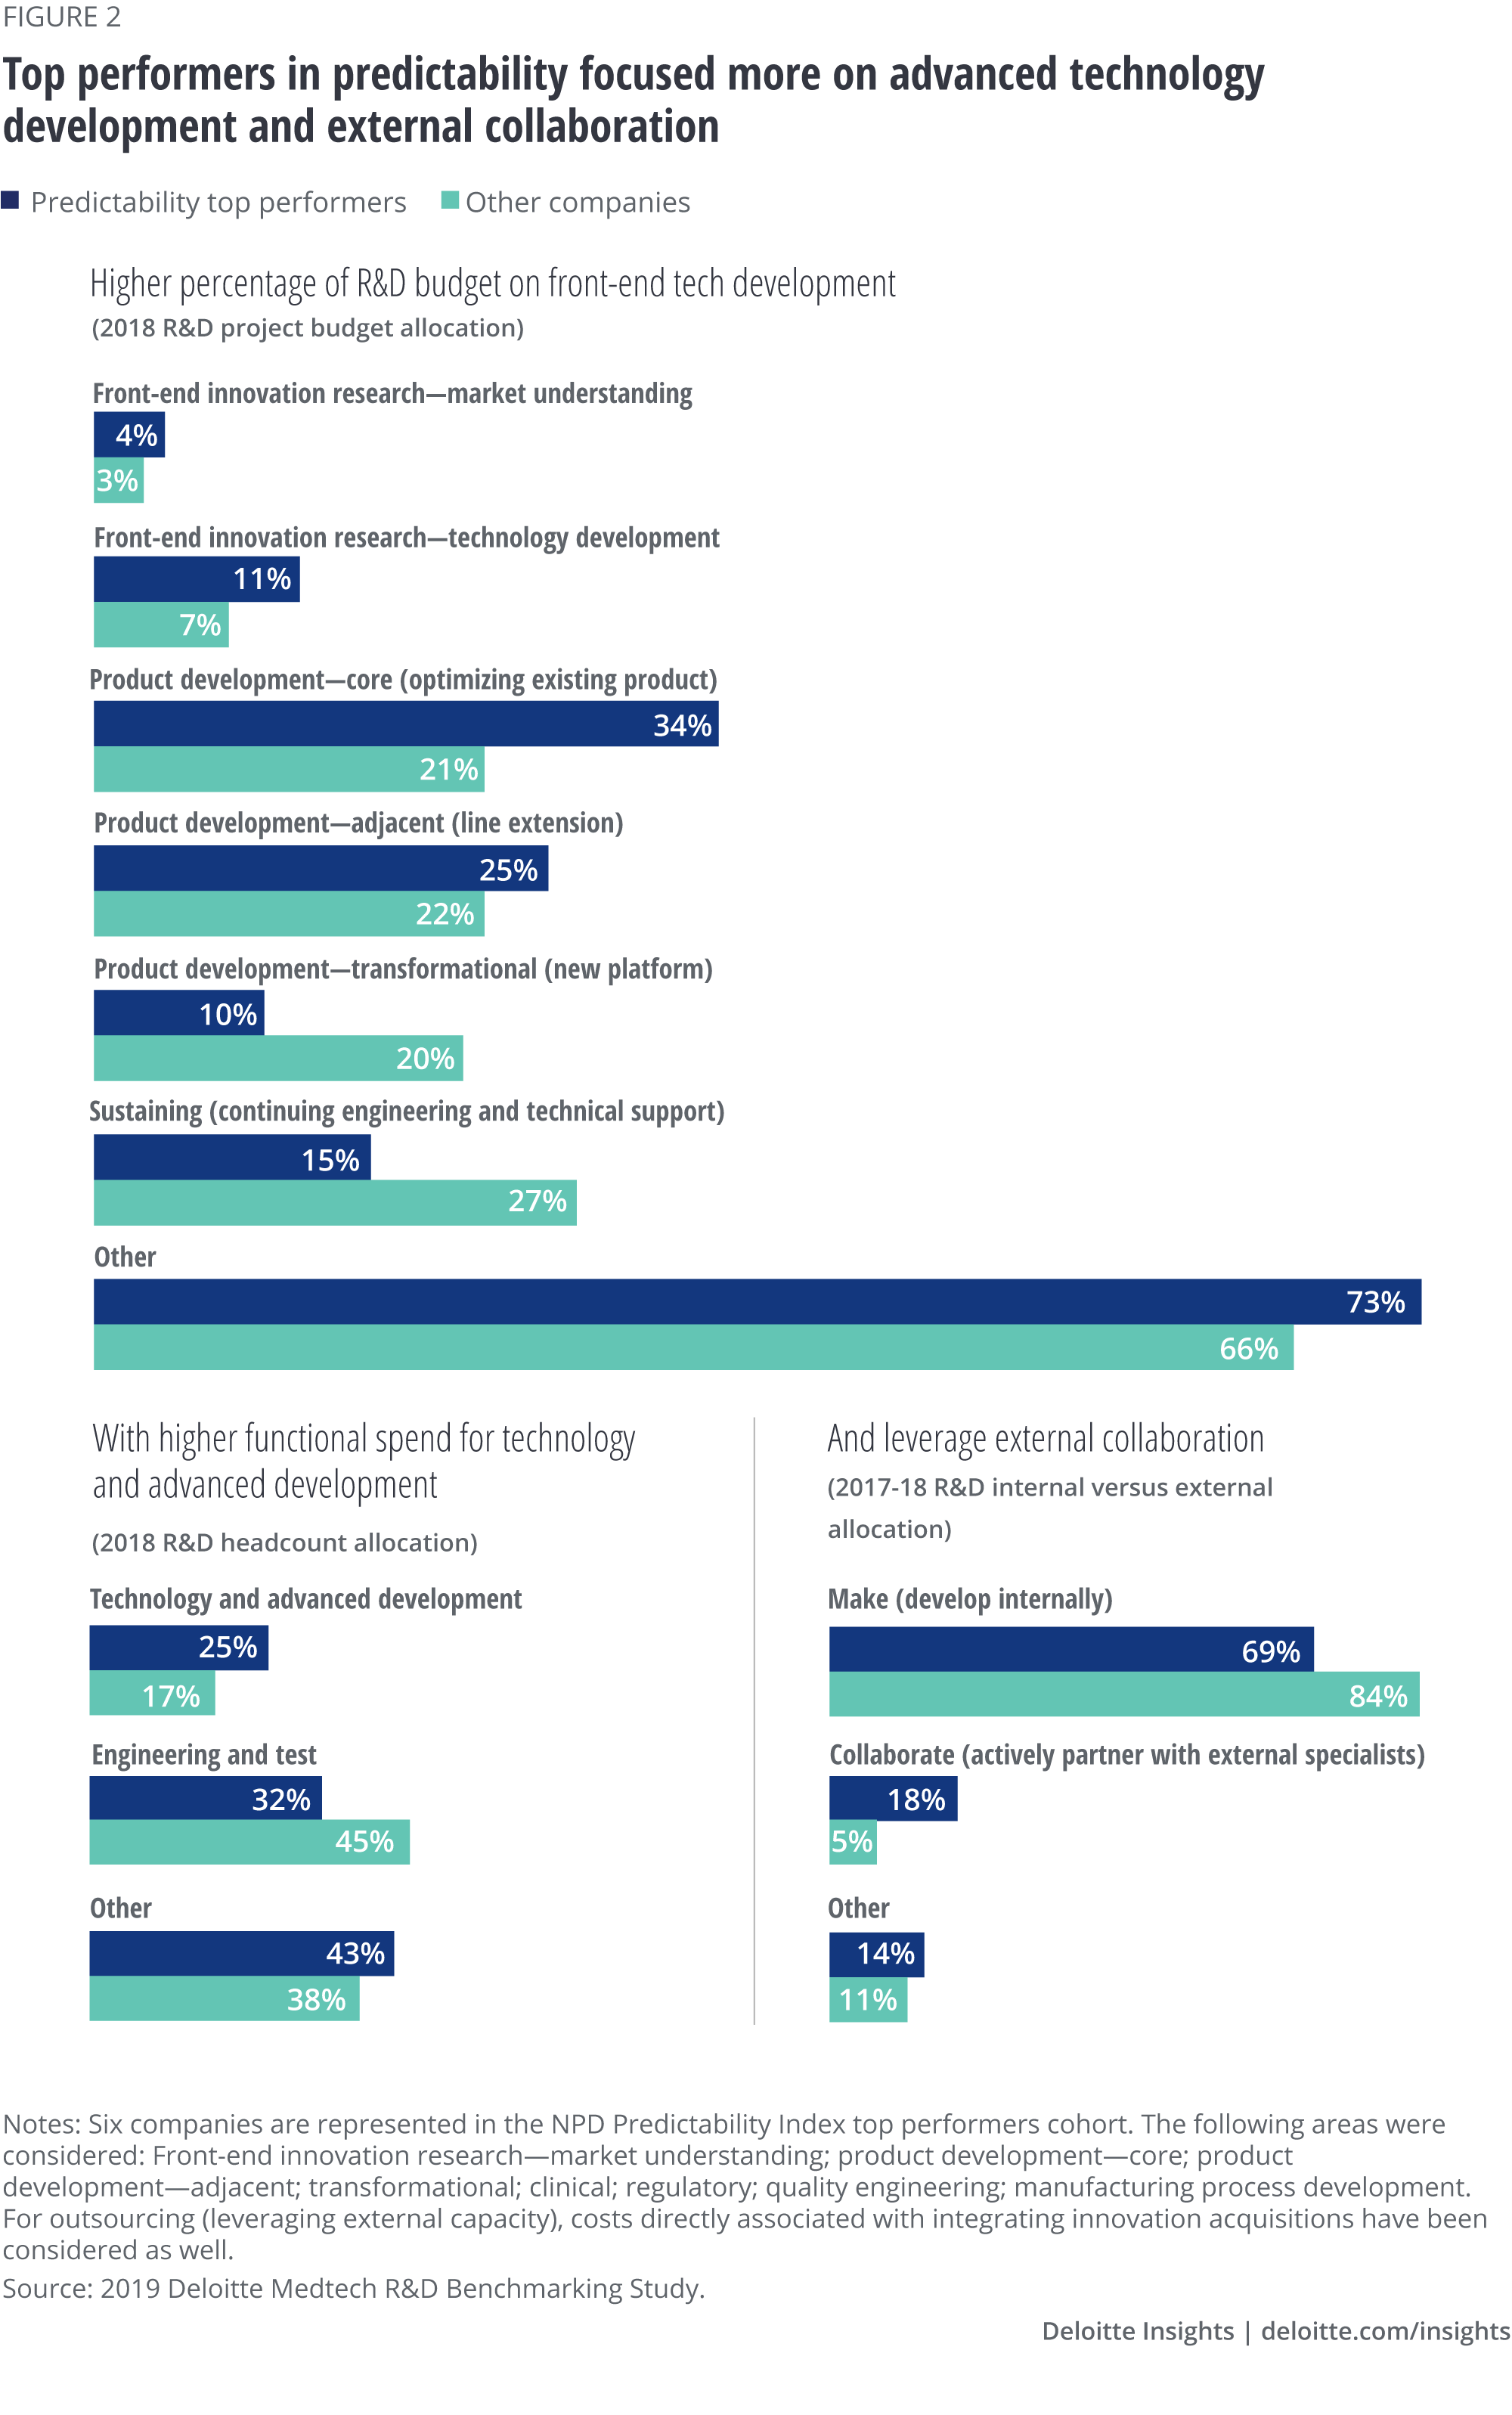
Top-performing companies scored higher on all elements of the NPD Predictability Index compared to other companies (figure 2). Further analysis revealed that they allocated:
- More than twice the R&D budget to front-end technology research. This early investment can help companies uncover and address technological risk, enabling more targeted later-stage development, or informing no-go decisions on technology that is likely to fail.
- Nearly triple the budget to external collaboration activities compared with other companies.
- More headcount to advanced technology development than others.
Follow-up interviews with top performers in this cohort confirmed that actual management practices are in line with these findings. They employed specific practices that reinforced technical derisking of projects prior to committing to full development. These include well-defined metrics and approaches to tracking project progress during development. Most importantly, they anticipated, escalated, and resolved project issues in a timely manner.
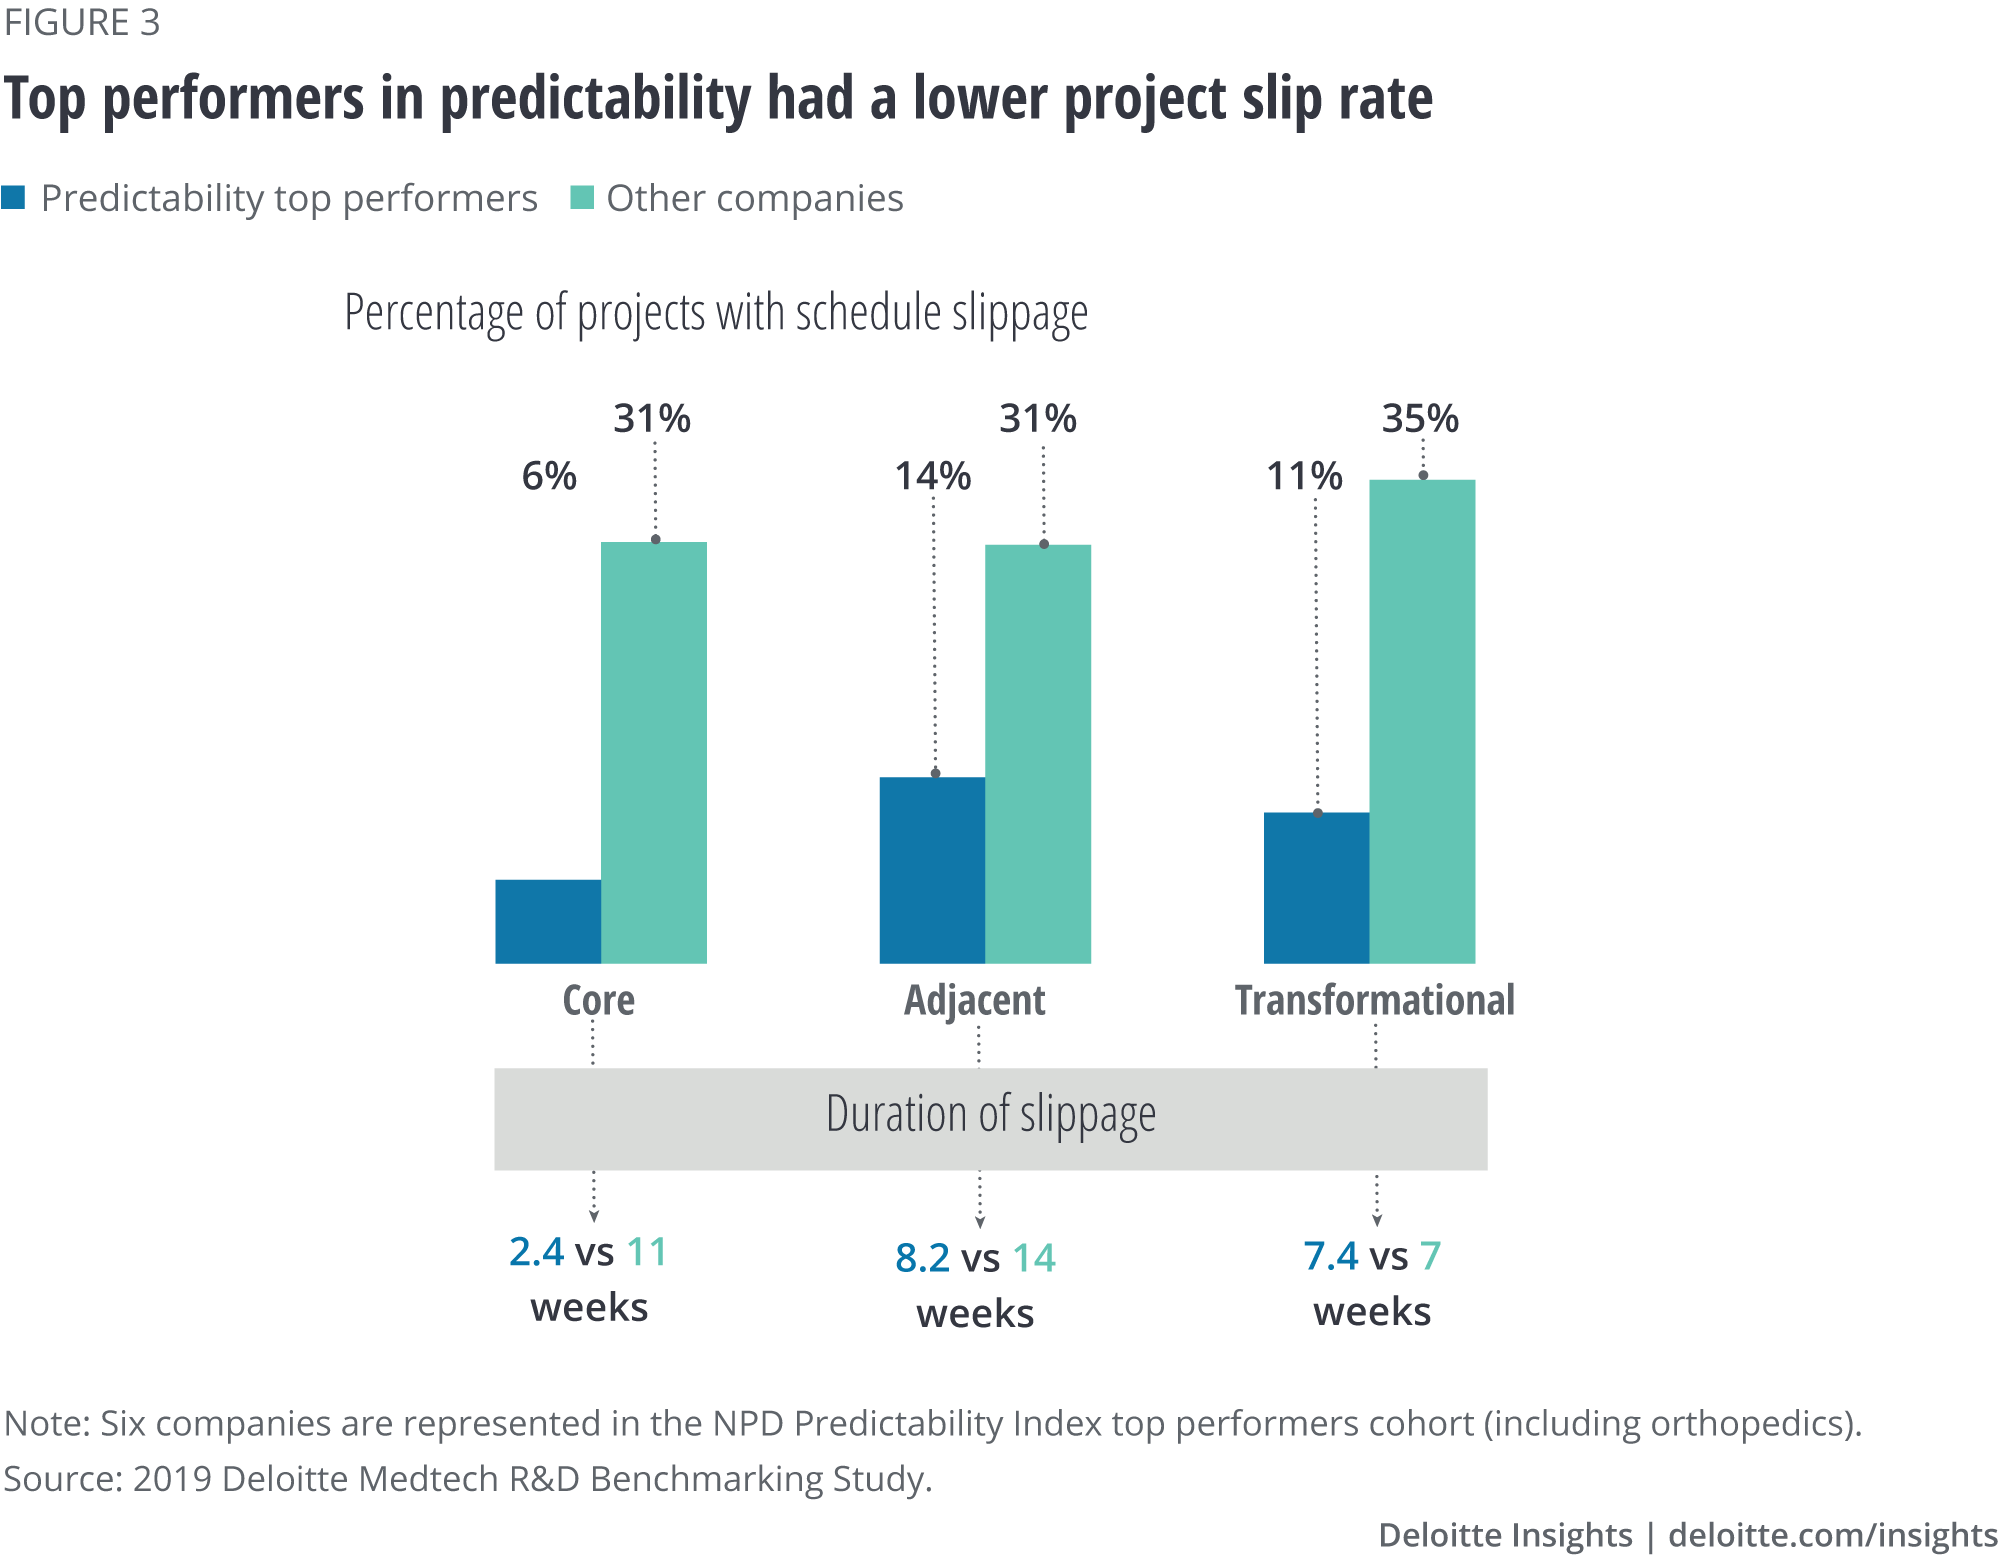
Project slip rate
Predictability top performers also had a lower project slip rate (figure 3), which was not part of the index but is helpful in assessing a company’s execution predictability. Project slip rate is the difference in the estimated time to market compared with the actual time to market. Better slip rate performance was true across different categories of project type. The best-performing companies are in a position to achieve better predictability in both project execution and market outcomes.
What else is helping top performers stand out?
Top performers in both predictability and new product revenue contribution maintain a more realistic product development pipeline than other companies. Our PLI assessment indicates that these companies demonstrated a better alignment between historically proven capacity and the amount of work in their pipeline (see Appendix for details). This type of effective resource management was confirmed in follow-up interviews with companies in both groups. The bottom line—top-performing companies do not overload their development pipelines, thus resulting in a more focused allocation of their resources and increased overall productivity.
The top-performing companies also use emerging practices such as agile development methodologies and advanced IT development tools to support engineering and clinical development. Many companies have used agile for software development for years, but medtech companies have generally been slower to adopt these methods. This is likely based on the misplaced belief that they are incompatible with the risk and regulatory requirements of medical devices. In some cases, the use of these practices by leading companies was focused on accelerating the cycles of early development experimentation to help improve predictability, and in other cases, to accelerate the integration of digital technologies into their product portfolio transformation efforts. Leading companies have, in some cases, even understood how to appropriately adopt these practices into hardware innovation.
Findings from product type cohort analysis
Analysis of the responses across product type cohorts found that:
- On average, companies making high-volume disposable products spent the greatest percentage of their I&PD budget on sustaining engineering activities. This difference may likely be due to the relatively high manufacturing process intensity needed for these types of products. Resolving the most common sustaining engineering problems such as changes in suppliers or quality issues can require significant investment. Our discussions with survey participants confirmed this perspective.
- On average, companies making integrated electronics products spent the greatest percentage of their R&D budget on transformational product development projects. This may be due to the recent, rapid acceleration of investments in innovation of digitally connected medical devices. Given the combined software and hardware nature of integrated electronics, device companies have often been leading the industry. While our discussions with survey participants confirmed this perspective, they also told us they plan to focus spending on more transformational digitally connected medical devices in the other product type segments.
The road ahead for medtech I&PD leaders
Benchmarking can be a vital tool for executives to use in increasing the ROI of I&PD. When used effectively, it can provide insights into business practices that lead to better performance. It can also help companies understand differences in resource allocation requirements and performance goals between types of products. As the research findings indicate, some of them have managed to implement winning product development strategies while some are still figuring out how to get there. As companies revisit their I&PD strategy, here’s what they can consider:
- Engage leadership across functions (both business and technical): I&PD is often the most cross-functional activity within an organization. Having cross-functional leadership alignment on company performance is vital to future improvement success.
- Prioritize performance improvement goals: Revenue growth? Predictability? Both? Something else? Medtech leaders should align their appetite for improvement with the level of change they are willing to create. Using comparative data can help guide an organization to areas that are truly underperforming. It can be easy to “want it all” but not be willing to match the level of change effort needed to achieve the goals. The bigger the goals, the broader and deeper the changes in business practices may need to be.
- Be honest and objective about what business practices you are actually employing: Many organizations may have solid business practices on paper, but their organizational behavior does not live up to those practices.
- Don’t reinvent the wheel when playing catch up: If a company’s benchmarking data demonstrates a significant gap in a performance metric, they can look at other companies that are already using practices to close that gap. Seeking assistance in understanding those practices and how quickly it might be possible to deploy them can be beneficial.
- Be open to truly leading practices: Emerging practices such as agile methodologies come from outside the medtech industry. Similarly, advances in information technology in I&PD support systems such as simulation, automation, and clinical evidence generation can open the door to implementing practices that were not operationally viable previously. However, adoption of leading practices depends on how well they can be linked to performance improvement objectives, not just because they seem new and different.
Improvement is a continuous journey. Even great I&PD companies routinely reassess their performance and are looking for ways to improve. After all, isn’t that part of what it means to be an innovator?
Appendix
Definitions
Project types
- Core: Projects that: 1) are a key focus of a business; 2) have similar design or product upgrade based on previous experience at different scale or conditions; 3) have significant existing test and operating experience; and 4) have no major technical feasibility uncertainties and existing technical design data.
- Adjacent: Projects that: 1) have products with ~30%+ new design of systems, subsystems, or components; 2) have limited prior test, operating experience, and existing design data; and 3) have several technical feasibility uncertainties and/or execution risks.
- Transformational: Projects that: 1) have major new core technologies incorporated into the new product and 2) have “all new” products leveraging little or no design and technology content from an existing product in the organization’s product portfolio.
Additional metrics
Pipeline Loading Index (PLI) measures the capacity of a company to complete projects in its pipeline. We compare active I&PD projects to historical I&PD execution performance based on cycle time, inventory, and throughput. We also compare the demonstrated historical average capacity of the company to launch products in the past few years to its current pipeline of products. An index value close to 1 indicates a relatively balanced pipeline; less than 1 indicates potential underutilization of capacity; greater than 1 indicates a potentially overcommitted pipeline.
Deloitte's services for the life sciences industry
Life sciences companies continue to respond to a changing global landscape and strive to pursue innovative solutions to address today’s challenges. Deloitte understands the complexity of these challenges and works with clients worldwide to drive progress and bring discoveries to life.
Learn more
Get in touch

- Doug Billings
- Managing director, Medtech
- Deloitte Consulting LLP
- dbillings@deloitte.com
- +1 617 449 5149
© 2021. See Terms of Use for more information.
Related content

More from the life sciences collection
-
 Improved clinical efficiency and quality Article4 years ago
 -

-
 The future of medtech Video4 years ago
 -
 Medtech leaders prioritize technology and consumers Article4 years ago
 -
 Real-world evidence’s evolution into a true end-to-end capability Article2 years ago
 -
 New payment models in medtech Article5 years ago