


Mission analytics has been saved

Mission analytics Data-driven decision making in government
27 September 2016
 Mahesh Kelkar India
 Peter Viechnicki United States
 Sean Conlin United States
 Rachel Frey United States
How can government agencies better use data to improve their resource decisions? It all starts with making their mission measurable—and asking the right questions to connect operational data with mission outcomes.
Management by the numbers
Michael Lewis’s 2003 book Moneyball told how Oakland Athletics general manager Billy Beane used data to build a better baseball team for less money. Through the use of statistics and data analytics, Beane determined which key performance measures contributed most to the ultimate “mission” of winning baseball games.
Beane’s data, for example, told him that players who took a lot of pitches and walked often contributed to victory more than hitters with a high average. Armed with this information, Beane learned how to allocate resources wisely. As a small-market team, Oakland just didn’t have the money to match other clubs. But because Beane used data analytics to guide his decisions on whom to draft, sign, and trade, Oakland fielded a highly competitive team on a tight budget.
Beane’s evidence-based approach has changed the way modern baseball teams make personnel decisions. The days of talent scouts who signed players based on gut instinct and a stopwatch are over. Today, virtually every team has its own cadre of stat geeks who use data analytics to inform key decisions.
And it’s not just baseball. Big data and evidence-based decision making are transforming the world, from health care to retail sales—and increasingly in the public sector as well.
Data analytics can allow governments to allocate their resources for maximum effect. But unlike baseball teams and for-profit companies, government agencies face unique challenges in defining and measuring success.
In this report, we examine some cases in which new data tools are achieving results through what we call the “mission analytics framework,” and offer some guidelines for avoiding common data and measurement pitfalls.
How to survive grant seasons
At the Department of Justice’s (DoJ’s) Office of Justice Programs (OJP), summer is a busy time. That’s when OJP distributes most of its public safety grants, totaling roughly $2 billion each year, to more than 2,000 grantees.1 OJP personnel still call this “red-book" season,” a term dating from times when all grant applications were recorded in huge red binders.
Calling it the busy season is an understatement. “Everything stops during those two to three months—it’s all hands on deck to deal with the amount of grant applications that come in that very short timeline,” says Lara Allen, a 15-year veteran at OJP.
During her tenure, Allen has seen a great deal of change in OJP practices. Before 2011, OJP’s grant review process depended heavily on the individual knowledge of grant managers for pre- and post-award decisions.2
“We had no standard approach to oversight. At the time, we had seven offices in the building all looking at grant data differently, collecting it differently, doing different things with it, monitoring it differently with no consistent approach—despite the fact that we all actually share the same grantees,” recalls Allen.3
In Moneyball terms, these grant managers were the old-time baseball scouts, making decisions based largely on their personal judgment and experience.
Around 2011, though, this began to change. Allen realized that OJP already possessed the data it needed to bring some objectivity to grant reviews. Allen and her colleagues within the DoJ began to use operational data for decision support, moving from intuition toward more objective techniques.
OJP began pulling disparate data systems together, and automated its review processes to increase the accuracy and consistency of its decisions while reducing the burden on its grant managers. The new processes had demonstrable impacts. Grant reviews can now be performed quarterly rather than annually. The time needed for grant managers to capture grantee data in OJP’s database has been slashed from 30 minutes to almost zero. These improvements led to more accurate decisions and gave the entire office more confidence in its actions.4
Resource allocation decisions now are based on hard data rather than subjective opinion. How much grant money should someone receive? What risk does a particular grantee represent? How many grant managers, and which, should be monitoring high- and low-risk recipients? These are some of the questions that OJP can answer more effectively.
Lara Allen and her colleagues at OJP aren’t alone in moving to data-driven resource allocation. The desire for more objective mission management has a long history in federal, state, and local governments. Efforts to replace intuition with objectivity span decades and have come from across the political spectrum.
A significant milestone for these efforts came in 1993, when the Government Performance and Results Act (GPRA) required federal agencies to include performance management as part of their strategic planning. The GPRA was revisited almost two decades later, in 2011, through the GPRA Modernization Act (GPRAMA).5
And at the state and local levels, the past two decades provide a number of examples of governments striving to develop a data-driven culture. Some key highlights of these efforts are shown in figure 1.

- GPRA: Federal agencies required to include performance management as part of their strategic planning and report on their results6
- NYC Compstat: New York Police Department’s statistical system for tracking crime7
- Baltimore CitiStat: City of Baltimore’s data-tracking and management tool8
- PMA: Bush Administration’s red/yellow/green scoring system for federal agencies comprising five government-wide and nine agency-specific goals9
- PART: Bush Administration’s questionnaire-based methodology for assessing performance of more than 1,000 federal programs10
- Maryland StateStat: State government performance measurement and management tool11
- OMB’s evidence-based policy push at the start of the Obama administration12
- GPRAMA: Federal agencies required to publish strategic and performance plans and reports in machine-readable formats13
- NYC MODA: New York City Mayor’s Office of Data Analytics (MODA) turns data into actionable solutions14
- FedStat: OMB’s latest data-driven effort to measure mission performance15
Despite numerous efforts, however, successful data-driven resource allocation processes were still quite rare—until recently. Since around 2010, two factors have rendered data-driven mission management much more achievable: dramatic advances in information technology, and the rise of data science, visualization, and analytics. More and more sophisticated IT tools, many of them open-source, have emerged, as have many more individuals skilled in data science.
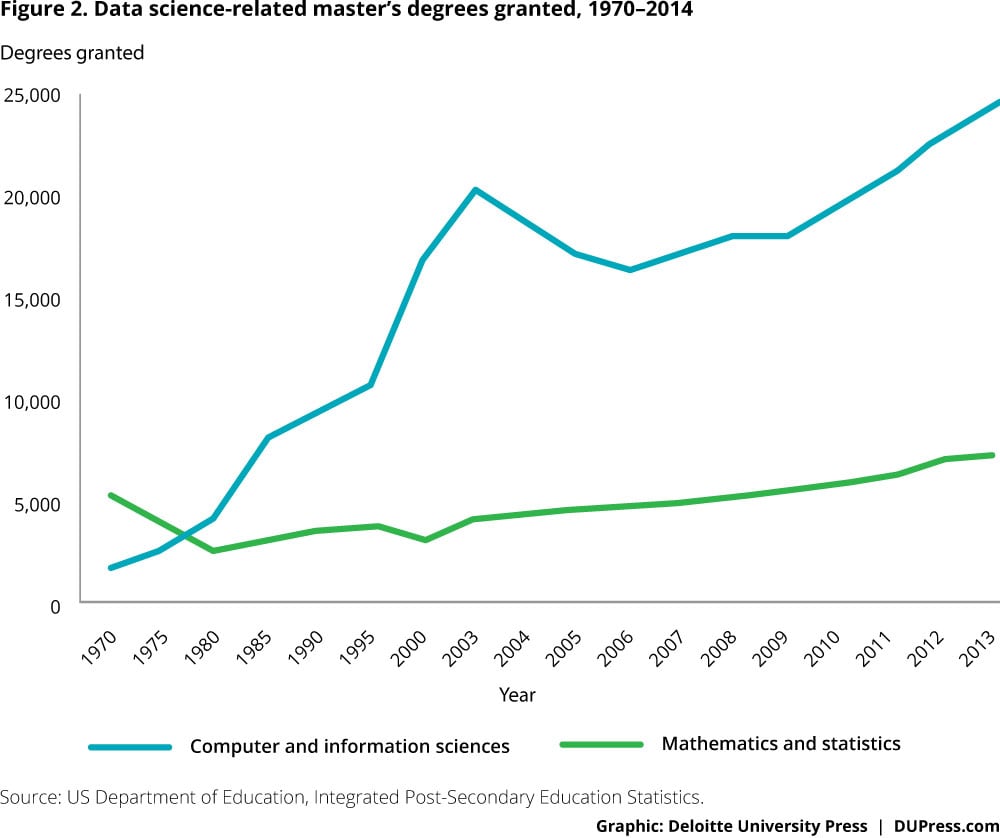
A few statistics illustrate this growth. The number of universities worldwide granting degrees in data science has risen to more than 500 as of June 2016.16 The number of data-science related degrees granted has risen as well (figure 2).
These developments have made it easier for government officials to access and understand the statistics that illuminate mission success—to make sense of operational data and turn it into usable insights for the critical mission of resource allocation.
Use smarter analytics to save time, money, and energy
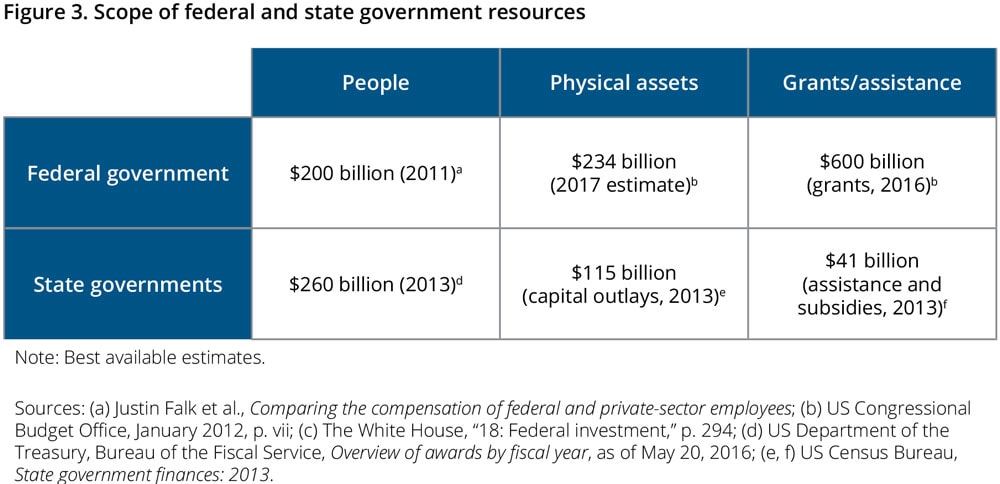
Governments manage three main categories of resources: people, physical assets, and money (figure 3).
People
Human capital is often the biggest and most critical resource that an agency has to manage, often exceeding a third of the total budget.17 Data analytics can help agencies decide how to deploy staff for maximum effectiveness.
Success story: Pennsylvania child support collection
America’s child support agencies possess a treasure trove of useful historical data on the cases they manage—on income, monthly support obligations, employers, assets and arrears, prior enforcement actions taken, and more. But agencies rarely make effective use of them. In general, the child support enforcement process has been reactive, contacting noncustodial parents (NCPs) only after they fail to meet their obligations.18
Pennsylvania’s Bureau of Child Support Enforcement is one exception, however. With 15 years of historical data, the bureau used predictive modeling to develop a “payment score calculator” to estimate the likelihood of an NCP beginning to pay court-mandated child support; of falling behind at some point in the future; and of paying 80 percent or more of accrued amounts within three months. Based on this score, caseworkers can follow a series of steps to keep a case from becoming delinquent, such as scheduling a conference, telephoning payment reminders, or linking payers with programs that can help them keep up, such as education, training, or job placement services.
Analytics also can be used in managerial decisions about casework priorities and assignments. More difficult cases can be assigned to caseworkers with more experience or specific skills. Managers can direct workers to focus attention on cases with the most significant potential for collections. And in cases in which the likelihood of prompt payment appears to be very low, caseworkers can intervene early by establishing a nonfinancial obligation or modifying the support amount according to state guidelines.
By using data to inform day-to-day practice, Pennsylvania is the only state that meets or exceeds the 80 percent standard set by the federal Office of Child Support Enforcement for all five federal child support enforcement performance metrics.19
Equipment and physical assets
The second major category of resources includes physical assets, from weapons systems to field offices. Modern analytic tools support more objective decisions for allocating these assets.
Success story: Using data to better manage overseas offices
US Immigration and Customs Enforcement (ICE) enforces federal laws governing border control, customs, trade, and immigration to promote homeland security and public safety.20 ICE maintains more than 60 field offices in 45 nations to assist in border enforcement and the investigation of transnational crimes. Both activities depend on the cooperation of foreign counterparts, including police forces and border control organizations.21 To further this cooperation and fulfill its mission, ICE chooses the locations and sizes of its offices carefully.
We flipped it around because we had the data and discipline. Data to help us manage funds and discipline to execute it.— Corey Hill
Until 2014, decisions on ICE international offices were made based on anecdotal evidence or periodic surveys of field operatives and headquarters personnel. But in 2015, ICE leadership decided to apply a more data-driven method, with a system that combined the agency’s operational data with public information and qualitative data from the field.
The ICE database allows analysts to compare the workloads and activities of its offices in each nation. ICE officials use it to identify countries where an expanded presence could have a positive impact, or where an office could be closed without sacrificing mission performance.
Money
The third critical resource government employs to achieve its mission is funding, such as grants, loans, and guarantees. For the federal government, grant funding is a $600 billion question: How should government agencies decide which organizations should receive a grant?
Establishing connections between goals and outcomes can be a challenge. For instance, measuring the impact of a federal public safety grant on crime rates can be painstaking, inexact, and open to interpretation. While entirely objective grant decisions may not be possible, new analytic techniques provide a solid, evidence-based framework.
Success story: Grantmaking at the Federal Railroad Administration (FRA)
Until fiscal 2009, the Federal Railroad Administration (FRA) was a comparatively small operating administration within the US Department of Transportation (DOT), with the narrowly focused mission of ensuring safety on the nation’s railways. Its grantmaking budget was approximately $30 million per year until fiscal 2008.22 The scope of the FRA’s mission changed dramatically in fiscal 2009, however, with the passage of the American Recovery and Reinvestment Act (ARRA). Overnight, the funds in the FRA’s purview jumped from $30 million to $8 billion; by 2015, its obligated grants portfolio had risen to $17.7 billion.23
In response, the FRA built an “enterprise data store” containing all relevant information about its high-speed rail grants, for both current projects and future investments. The store’s data allow the FRA to forecast the effect of investments on outcomes.
The FRA considers outcomes important to ordinary citizens, such as peak speeds on busy passenger-rail corridors. As FRA executive director Corey Hill puts it, "So what does [a rail] construction project get you? It doesn’t just get you X new station platforms, Y linear feet of track, or even Z new signal houses. That’s just stuff. What it really gets you is safety, reliability, better performance, and more access [for] people.”24 The FRA’s projections for proposed investments along the 304-mile-long Chicago-Detroit-Pontiac rail corridor, for instance, showed that an investment of $500 million could increase the corridor’s top speed from 80 mph to 110 mph, reducing travel time by 30 minutes for the corridor’s 477,000 users.25
Today, the FRA can more clearly communicate the impact of its budgetary decisions to DOT and Congress. “We flipped it around because we had the data and discipline,” Hill says. “Data to help us manage funds and discipline to execute it.”26
The four stages to becoming a data-centric organization
Many government agencies want to use data to improve their resource decisions, but may lack a clear roadmap for doing so. Our research shows that most agencies that transform themselves into data-centric organizations go through four stages. We call this the mission analytics journey (figure 4).
Step 1: Make your mission measurable
The first step is to define the mission in ways that make it quantifiable. The premise is that specific and challenging goals, combined with continual analysis and feedback, can improve performance.27
That’s easy to say, of course, but it can be hard to know just what to measure. Agencies that have done so successfully typically break down the list of potential measures into inputs, outputs, and outcomes.28 Inputs are factors such as funding or resources. Outputs are products of the government activity itself, and may be less directly relevant to citizens. Outcomes are the consequences of direct relevance to citizens, and equate most closely to actual mission goals.29
Success story: ERS’s Data Product Review Council
The Economic Research Service (ERS), a division of the US Department of Agriculture (USDA), is one of 13 federal statistical agencies. ERS’s mission is to “anticipate economic and policy issues related to agriculture, food, the environment, and rural America, and to conduct high-quality, objective economic research to inform and enhance public and private decision making.”30 The data produced by ERS are extensively used by other USDA divisions, by policymakers within and outside the federal government, and by customers worldwide. Some of ERS’s most popular and influential products chart our nation’s food insecurity, dietary choices, and farm economy.
The product reviews have helped us to have a more structured approach to our resource allocation decisions.— Lewrene Glaser
ERS’s more than 350 employees manage a portfolio of about 80 different data products. ERS leadership performed a strategic assessment in 2012 that found that, although its data products were universally valued by customers, it was unclear which products aligned best with the broader agency’s goals.31 As ERS Administrator Mary Bohman puts it, “We wanted to be able to state clearly which data products were most important and respond to Congressional and other stakeholder questions on why we were allocating our resources to certain products.”32
To tackle this issue, ERS created the Data Product Review Council (DPRC). The Council devised a method of measuring the impact of each ERS data product.33 Through interviews and usage monitoring, ERS was able to score and rank each of its products into three distinct categories: premier, core, and other.34 Premier products are those that are most influential and clearly linked to the USDA’s five mission goals, while core data products are used by other ERS projects. Once its data products are scored according to mission centrality, ERS can then measure how well it is achieving its mission overall. This new clarity of vision allows ERS to ascertain where to allocate the efforts of its employees and its other resources.
Based on these insights, ERS eliminated or scaled back effort on certain products that were less important to its mission. For instance, ERS archived an atlas of Chinese agricultural production after a DPRC review, acknowledging that staff resources were better directed elsewhere.35 “The product reviews have helped us to have a more structured approach to our resource allocation decisions,” says DPRC chair Lewrene Glaser, “allowing us to make better decisions about some marginal cases where the benefit may not be worth the investment.”36
In other words, ERS identified outcomes that support USDA’s broader goals, and the DPRC has helped ERS achieve those outcomes more effectively and meet budget reductions as well as allocate resources to new initiatives. A welcome byproduct of the DPRC’s efforts is improvement in data quality procedures: DPRC has helped standardize and codify data quality measurements and improvement plans of all the datasets it reviews. ERS has achieved all these benefits by making its mission measurable.
Step 2: Collect mission-critical data
Defining and refining mission-critical measures is only the first step on the mission analytics journey. The enterprise then must create a platform that allows for the collection, storage, and dissemination of all relevant data. Too often, mission-critical data are trapped in stovepiped databases or organizational silos, or outside the agency entirely. Different datasets may have to be brought together to gain a full picture of mission performance.37
Consider a child welfare agency. To assess how well it is meeting its mission, the agency might wish to measure outputs, such as the number of homes visited by case workers, or outcomes, such as the percentage of children successfully reunited with their families.38 Stovepiped systems can make such reporting difficult. Moreover, the child welfare agency may want to consider data beyond its traditional boundaries, such as dropout rates, arrests, and teen pregnancies, to assess how well their children do as they age. Access to such data should be maintained through processes designed with data quality as an explicit goal, creating what we call a “mission-data ecosystem.”
Success story: Mission-data ecosystem at the Federal Railroad Administration
We noted above how the passage of the ARRA in 2009 and subsequent appropriations made the FRA’s high-speed rail grant budget skyrocket, creating huge challenges for the agency. At the time, the FRA did not have an enterprise system for grant management; data on each project were stored in individual spreadsheets or even on paper in desk drawers.39
To meet the challenge, the FRA developed its Program Management Tracker (PMT), a comprehensive database including information for all of its grant projects. The database is organized around important components of FRA operations—grant documents (originals and amendments), deliverables, status of environmental reviews, grant monitoring reports, and invoices.40
As the FRA began work on the PMT tool, its staff realized that much of the data they needed were already being collected, either by the FRA itself or by other DOT divisions. The challenge was assembling them within a unified central database, an exercise that required data-sharing agreements with other DOT offices and the replacement of legacy data systems with more modern capabilities.41
The FRA completed the first version of the PMT in fiscal 2011. The next stage of the project involved the creation of an operational dashboard to visualize data. This dashboard displays the status of the FRA’s entire portfolio of investments, allowing it to make better decisions about which projects to fund and where to focus its organizational attention.42
Step 3: Use analytics to move from data to insights
The third step in the journey is to build tools to pull meaning out of the data compiled and measured during steps 1 and 2. Performance information has little significance in itself. It should be translated into meaning to become valuable.
But how do we move from data to insight? A plethora of advanced analytical tools purport to do this. Our research, however, shows that the tool is less important than determining the right questions to ask. In fact, three are critical:
- What? “What is current organizational performance?”
- So what? “What does current performance mean for the mission?”
- What if? “If we applied resources or solutions differently, what effect would it have on the mission?”
These questions are really what connects operational data to mission outcomes, and what separates the mission analytics framework from more generic business intelligence tools.
Performance information has little significance in itself. It should be translated into meaning to become valuable.
When an organization builds solutions to answer these questions from operational data, our research highlights the need to be agile. Agility has become a buzzword in some software development circles, but here it captures a critical concept: the need to start small and iterate continually. Applying analytics to mission management and execution requires agencies to tackle questions and generate meaningful answers rapidly. Though these answers may not be perfect, they will help guide further refinement of data collection and analysis. Over time, the analytics solution will converge on something maximally useful for the organization.
Success story: Identifying at-risk children in the District of Columbia
Reunification—returning children in foster care to their families of origin—is a critical mission objective for child welfare agencies. Nationally, more than 400,000 children are in foster care. Nearly 30,000 more children enter the system each year than exit it, and that gap has been widening since 2012. Child welfare agencies across the nation typically struggle to return children to their parents quickly (reunification) and help them remain there (stability).43
The District of Columbia’s Child and Family Services Agency (CFSA) decided to tackle reunification by learning from its own successes and failures. It built a statistical model that, based on the specific facts of a client’s case, would predict the extent to which a successful reunification was probable or unlikely. The predictive model can segment children into different groups, flagging those least likely to have a timely and stable reunification. More importantly, the model identifies why children face these risks, and which factors are under the CFSA’s control.44
Step 4: Translate insights into organizational action
Insights without actions are of little value. Agencies that successfully use data analytics to improve their operations rely on feedback mechanisms to translate insights into concrete operational changes.45 But of course, the best feedback mechanism in the world is worthless unless it’s used. This is the fourth and final step of the mission analytics framework, and the final link connecting data to agency missions.
Success story: Reducing pending benefit applications
Virginia, like many other states, has an integrated system for benefits eligibility. It allows residents seeking multiple services (such as medical assistance and the Supplemental Nutrition Assistance Program) to apply just once for all. The offices that process these eligibility applications, however, are often understaffed and overworked.46
In 2015, Virginia’s Department of Social Services (DSS) took a different approach to the problem, centered on “managing by the numbers.” The DSS gathered existing administrative data on the progress of applications and claims through its systems. Analytical reports on these data helped map how applications flowed from office to office and even from worker to worker. These diagnostic reports showed outliers, both positive and negative; the positive instances could provide best practices, while the negative outliers required interventions. Virginia further used the information to understand which offices could benefit most from additional training.
The DSS took the final step of the journey to data-driven mission management by applying insights from analytics to reallocate its resources, introducing special training to reduce bottlenecks in key offices. Using these insights, the agency reduced processing time and thus wait times for benefit applicants. By August 2015, Virginia had reduced its average application processing times from 24 days (before implementation) to 18 days.47
Obstacles to data-driven mission management
While these success stories are inspiring, the journey to data-driven mission management is not without challenges.
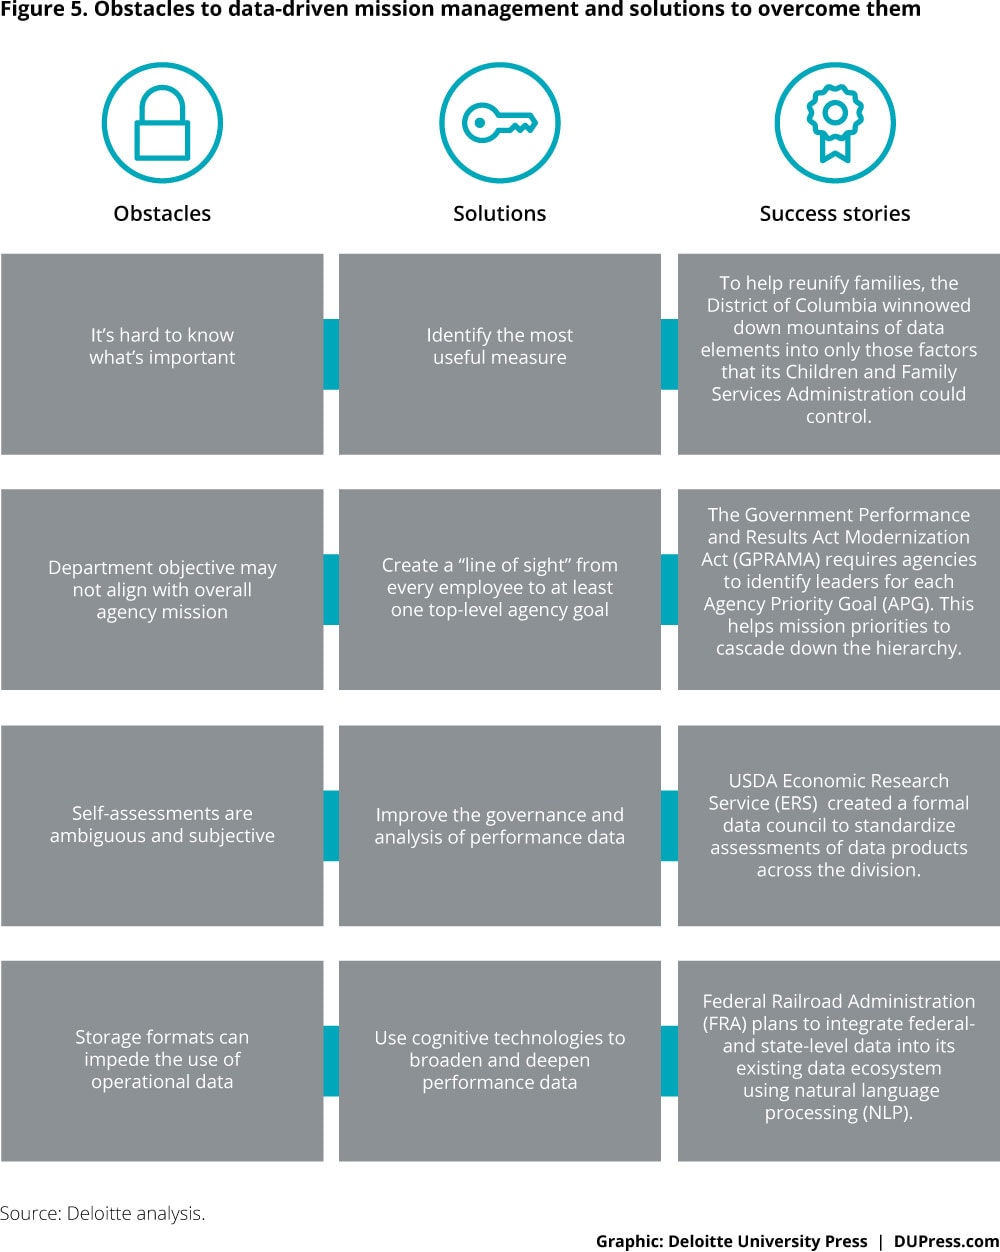
Obstacle 1: It’s hard to know what’s important
Measures of success can be difficult to define. Consider an urban police department. While it’s easy to measure its activities and outputs, from patrol hours to arrests, how can its leaders identify which aspects of its mission most need improvement? And if more arrests come at the cost of hostility in the community, for instance, is an increase in arrests an “improvement”?
In government, challenges in defining success and identifying the measures that contribute to it can make it difficult to develop key performance indicators, or KPIs.
Obstacle 2: Departmental objectives may not align with the overall agency mission
State and federal agency structures can make it difficult to link departmental goals with larger objectives. Every federal national security agency, for instance, has a Freedom of Information Act (FOIA) office, charged with responding to FOIA requests in a timely and accurate way. Some of these offices may have improved their performance dramatically, perhaps cutting response times for customers or increasing customer satisfaction.
But how do those improvements relate to overall agency performance? It can be difficult to measure the overarching impact of such improvements, though surely an FOIA office does have an important role to play within the overall mission.
Obstacle 3: Self-assessments are ambiguous and subjective
It is unreasonable to expect agency officials to deliver objective self-assessments on their own performance, as the desire to highlight success could introduce ambiguity and subjectivity into the data. A recent GAO report on six federal agencies included ample evidence of this problem, finding that only one out of the six reported on the quality of its performance information in detail. The other five simply described their process without further details.48
Obstacle 4: Storage formats can impede the use of operational data
Some data highly relevant to the optimization of resource allocation—important details on why agency actions succeed or fail—are stored in formats that make them difficult to access. The documents may be scanned copies of handwritten notes or free-text fields in unstructured formats. For example, law enforcement case files may contain extensive notes that shed light on why individual cases take more or less time, the associated outcomes, and what sort of investigators are most effective. Without such data, a performance measurement system seeking to inform resourcing may give poor results.
One of the notions that should be debunked here is that one needs “perfect” data to proceed with analytics.49 More often than not, agencies are surprised to see the valuable insights they can gain from imperfect or seemingly insufficient data. And in all of the examples cited in this report, agencies worked with their internal data first before expanding their view to outside data sources.
Overcoming the obstacles to data-driven management
Our research has uncovered four approaches that can help government agencies overcome common obstacles to data-driven mission management.
Solution 1: Identify the most useful measures
The time needed to identify which measures are most informative and most closely connected to mission success is well spent. Measures should first be grouped into inputs, outputs, and outcomes. Inputs and outputs should be further grouped to separate the ones that are under the agency’s control from those that are not. Only then can the hard work of building a statistical model connecting inputs, outputs, and outcomes begin.
This is how Washington DC’s Child and Family Services Agency approached its efforts to boost performance. The CFSA selected the inputs and outputs it could control and built a predictive model connecting them to important child outcomes such as the reunification rate.50 Without understanding which metrics drive mission success, agencies risk wasting effort on metrics that fail to gauge what matters most.
Solution 2: Create a “line of sight” from every employee to at least one top-level agency goal
It’s very helpful for employees to understand how their work contributes to the overall agency mission. To promote this link, government agencies can disseminate “line of sight” information connecting each employee’s role to one or more high-level goals.
The US military is a helpful model. The United States’ armed forces do pretty well at conveying to all personnel their individual contribution to the overall mission. After all, it’s safe to say that most cooks in the US armed forces know that good, healthy food has a positive impact on troop morale.51
At the federal level, the GPRAMA recently required each agency to identify its most important performance goals, or Agency Priority Goals (APG).52 Agencies are also required to appoint a goal leader for each APG. This helps ensure that agency missions and priorities cascade down the hierarchy. A recent GAO review found that a majority of agency goal leaders believe their roles have positive effects on performance. They further noted that such positions provided “greater visibility for the goal, facilitated coordination, heightened focus on the goal, and improved access to resources.”53
Solution 3: Improve the governance and analysis of performance data
In many cases, the entity responsible for operations is also responsible for reporting on success, essentially acting as its own scorekeeper. Human nature being what it is, this encourages subjectivity in performance assessment. Instead, agencies may wish to move responsibility for collecting and reporting on performance measures to an independent entity, potentially under the direction of a chief data officer (CDO). Alternatively, they may consider increased investment in technological solutions to ensure performance data quality.
The past few years have seen a steady uptick in the number of government CDOs.54 Most of the current crop are focused on centralizing data and making it machine-readable and accessible to all users. More importantly, perhaps, CDOs are trying to change agency cultures by showing the value of operational data.
Unsurprisingly, such initiatives should be driven from the top. Barbara Cohn, who ran New York City’s data interoperability initiative between 2009 and 2012 and is currently CDO for the state of New York, notes the importance of political leadership to a data-driven culture. “There was an executive order from the mayor, there was strong leadership, there was structure, there were processes in place and standards that had to be met, and there were very clear objectives,” says Cohn.55
Solution 4: Use cognitive technologies to broaden and deepen performance data
Cognitive technologies are information-processing techniques that can perform specific tasks that, until recently, required human labor.56 Some of these technologies, such as natural language processing, speech recognition, and robotics, are seeing widespread adoption and making rapid progress.
Government often has “unstructured” forms of data that, if converted into machine-readable formats, could provide important performance insights—for example, the handwritten notes of field operatives or scanned eligibility documents often contain important information. Cognitive technologies such as optical character recognition (OCR) and natural language processing (NLP) can be used to convert such data and integrate them with existing databases.57 The use of cognitive technologies is still new in government, but as these techniques continue to improve and costs continue to fall, they will play an increasingly important role in data-driven management, tapping previously “hidden” sources of data.
Today’s “extraordinary” will become routine
The journey toward data-driven resource allocation requires political leadership, a commitment to sustained technological progress, and a willingness to measure and report on success transparently. Done right, it can dramatically boost performance.
We’ve seen a number of pioneering government organizations achieve significant results through data-driven mission management. While it is still the exception rather than the rule in government, the adoption of data analytics is likely to increase rapidly. It’s reasonable to expect that most agencies will report key performance indicators in near-real time via transparency portals. Citizens, should they choose to make use of these portals, should be able to view these KPIs.
Data-driven mission management is poised to follow the pattern of other innovations in government. Consider shared services. When the concept of sharing management functions was first imported from the private sector into federal institutions in the early 1980s, it was seen as a radical notion and faced stiff resistance.58 Today, shared functions such as payroll services have been widely implemented. In 1980, for instance, virtually every federal department maintained its own payroll; today, just four payroll agencies serve all federal employees.59 As more agencies saw the benefits of shared services, and more successful examples of implementation could be seen, the innovation spread.
Mission-driven analytics have the similar potential to allow government agencies to do more with limited resources. The technology has advanced to the point at which data can be captured, collected, and analyzed efficiently. Linking data to an organization’s mission may soon become commonplace. More and more public leaders, like those described in this paper, will work to create a data-driven culture that promotes agency missions and the fulfillment of public purpose.
© 2021. See Terms of Use for more information.
