Living in inflation’s wake
US inflation rates peaked nearly two years ago, yet the lingering cost-of-living shock continues to influence Americans' financial well-being and spending habits.


When US inflation peaked during the summer of 2022, it was all hands on deck for consumer businesses managing through the shock. Spiking prices put immense pressure on margins and customers alike. The strategic implications spanned the breadth of organizations—from pricing strategies, product mixes, and volume expectations to marketing and promotions.
Learn more
Fast-forward nearly two years, and rates have eased significantly. Yet many signs suggest inflation has fallen much faster than Americans have acclimated to the new price reality. Consumer companies still operate in an environment where higher prices shape their customers’ sense of financial well-being and spending decisions.
Inflation’s ongoing impact on financial well-being and spending
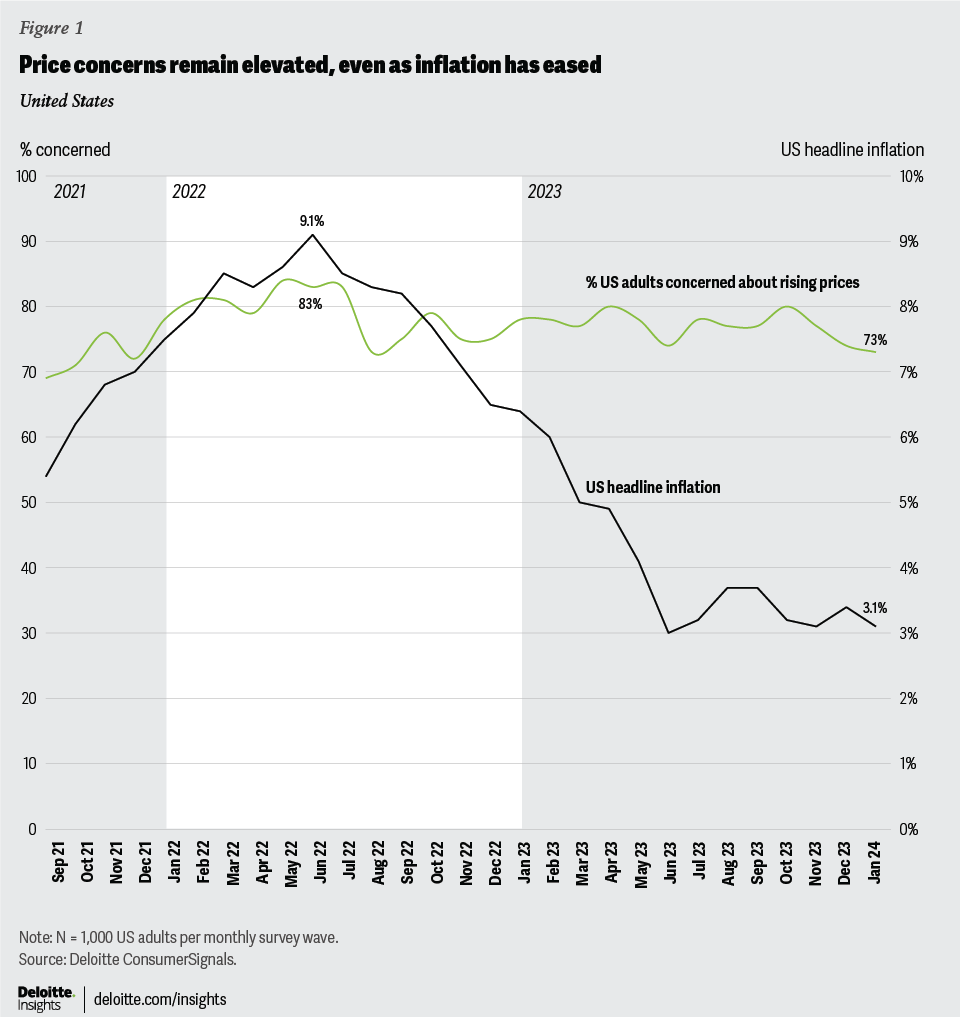
When inflation hit 9.1% in June 2022, the percentage of Americans concerned about rising prices rose to 83% (figure 1). Nearly two years later, that figure has only eased to 73%, even as inflation hovers at a much improved 3%.

Persisting concern could be driven by a stubborn inflation rate that has yet to hit the Fed’s 2% target.1 But the bigger reason is probably a lot simpler. Consumers’ needs and wants became more expensive very quickly.
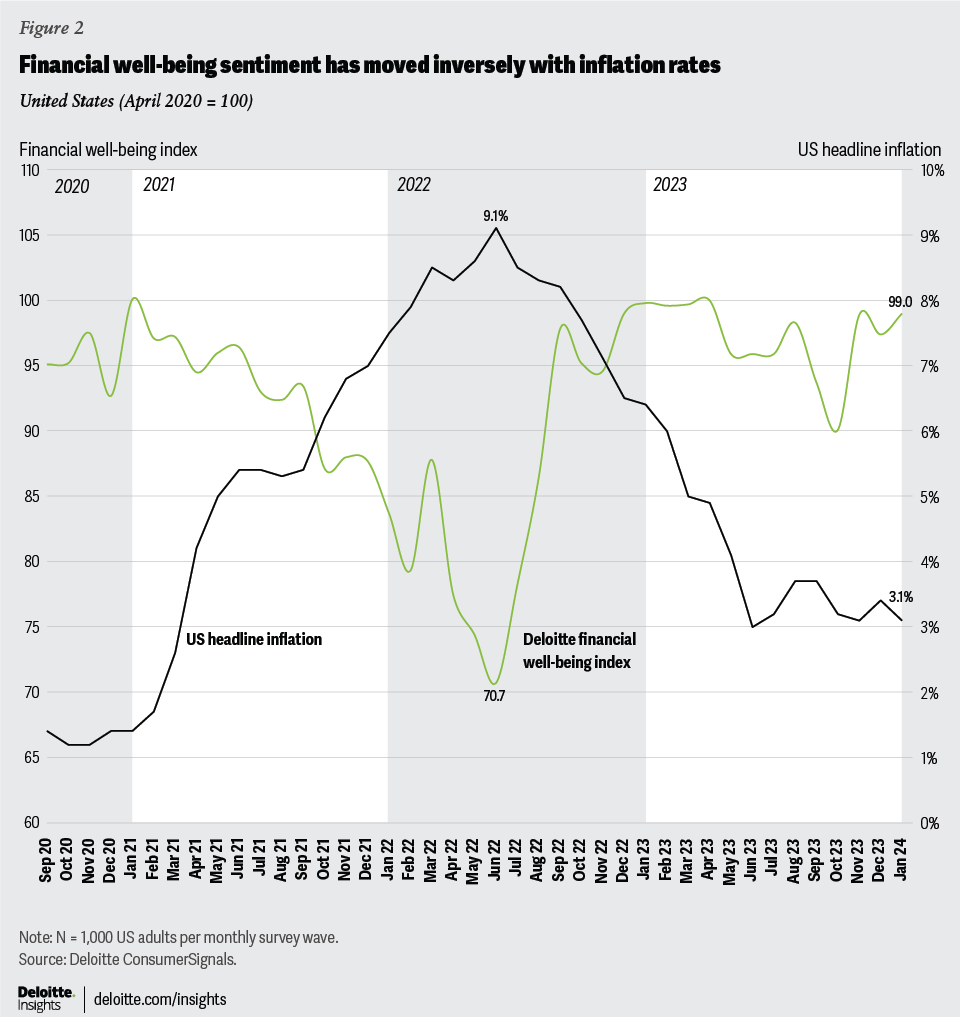
Since early 2021, Deloitte’s financial well-being index has generally moved inversely with inflation (figure 2). The index, which captures changes across six dimensions of financial health,2 hit a four-year low (70.7) in June 2022, the month inflation peaked at 9.1%.

As inflation eased, Americans’ sense of financial well-being improved significantly. Six consecutive months of dropping rates coincided with a 28.3-point increase in the index by the end of the year. Over that time period, the percentage of Americans concerned about their level of savings fell from 62% to 44%.3 The amount concerned about making upcoming payments fell from 32% to 20%.4 Those delaying large purchases fell from 56% to 42%.5
Yet, the initial boost in financial well-being appears to have run its course. Financial well-being sentiment plateaued over the past year, remaining nearly unchanged between January 2023 (99.8) and January 2024 (99.0). While easing inflation provided a quick hit of optimism, Americans likely still need time to adjust to prices that are nearly 20% higher than three years ago.6
Evidence of inflation’s lasting grip doesn’t stop with financial well-being. It’s also apparent in how consumers think about spending—both how much and where.
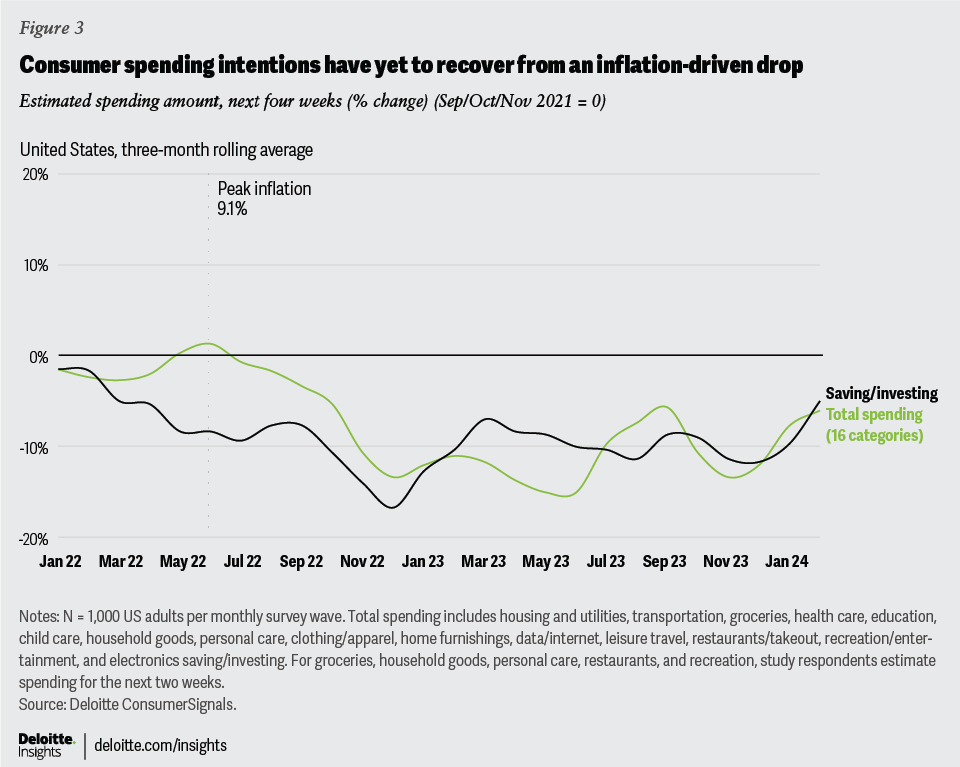
Peak inflation in 2022 coincides with the start of a year-long drop in consumer spending intentions (or the amount consumers expect to spend in the month ahead). While maintaining a slight uptrend since June 2023, total spending intentions are still yet to fully recover (figure 3).


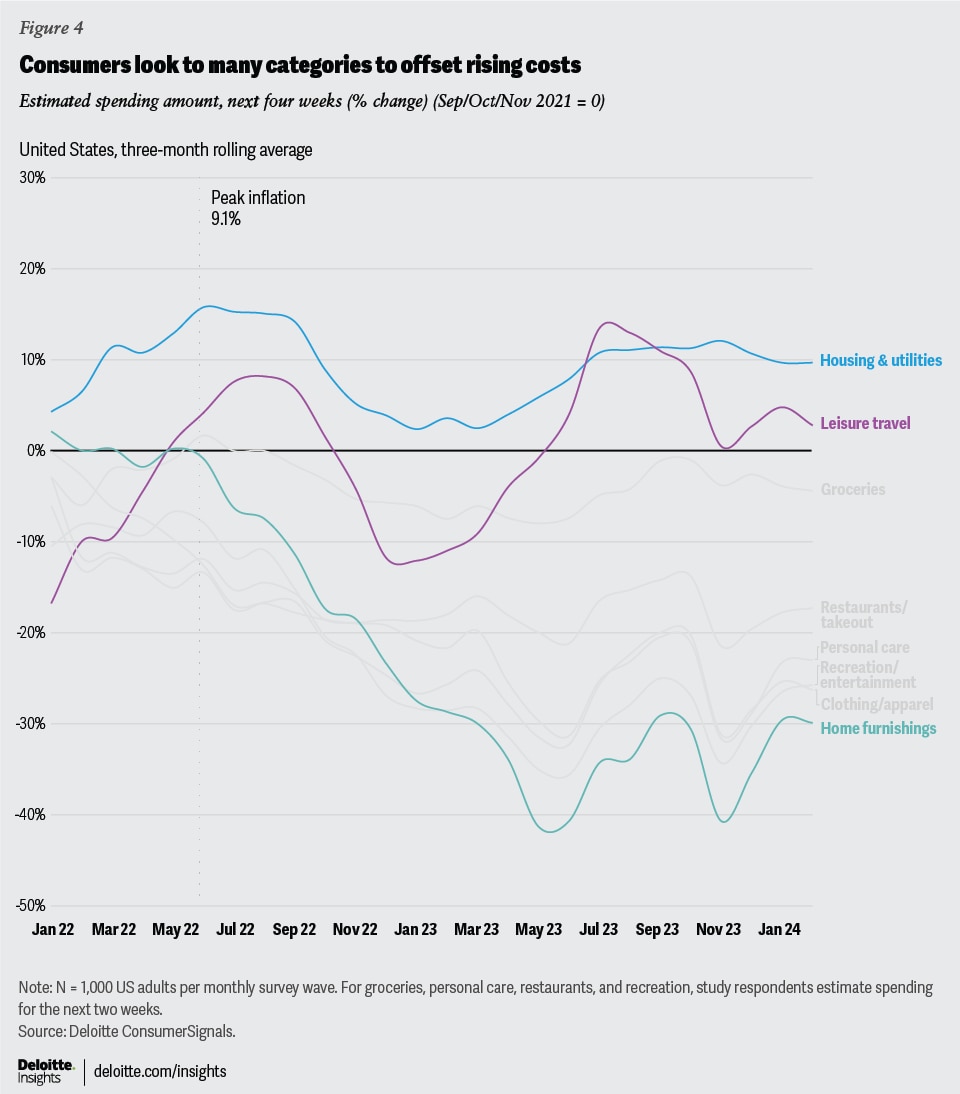
Trends vary significantly by category, potentially offering insight into how consumers continue to reshape their wallets to navigate the price pressure. Perhaps unsurprisingly, spending intentions for housing remain the most elevated. Rising costs in categories like housing are often more difficult for people to evade.
At the same time, similar dynamics aren’t playing out in other essential categories. Like housing, food has become more expensive. But spending intentions for groceries have generally remained flat, strongly suggesting consumers likely continue to employ cost-saving strategies at the grocery store. Throughout 2023, Deloitte’s food frugality index has echoed the trend, measuring strong increases in the percentage of Americans leaning on lower-cost ingredients, sticking to essentials, and reducing food waste.
Then there are categories that consumers lean on to help offset rising costs elsewhere—and there are many. Spending intentions for discretionary categories like restaurants and recreation and entertainment are still much weaker than they were in 2022. But strong pullbacks have also been evident in categories some might assume to be less discretionary, such as clothing and personal care.
And amid the balancing act, the COVID-19 pandemic may still have a lingering influence. Strong pandemic categories like home furnishings continue to see some of the steepest cuts. Meanwhile, spending intentions for leisure travel remain exceptionally strong.7
Toward calmer waters
Higher prices seem to continue to weigh on financial well-being and spending confidence. But how long will it take for Americans to acclimate to higher prices? And what sectors are most likely to benefit when they do?
Historical patterns from previous inflation waves can offer some insight into timing.
Some of America’s longest-running consumer surveys lean into pocketbook conditions and track well with inflation.8 A recent analysis of these indices suggests it takes around two years for consumers to acclimate to new price environments.9 If that pattern repeats and economic conditions hold steady, Americans could start feeling better by the fall.
If they do, specific sectors are more likely to benefit than others.
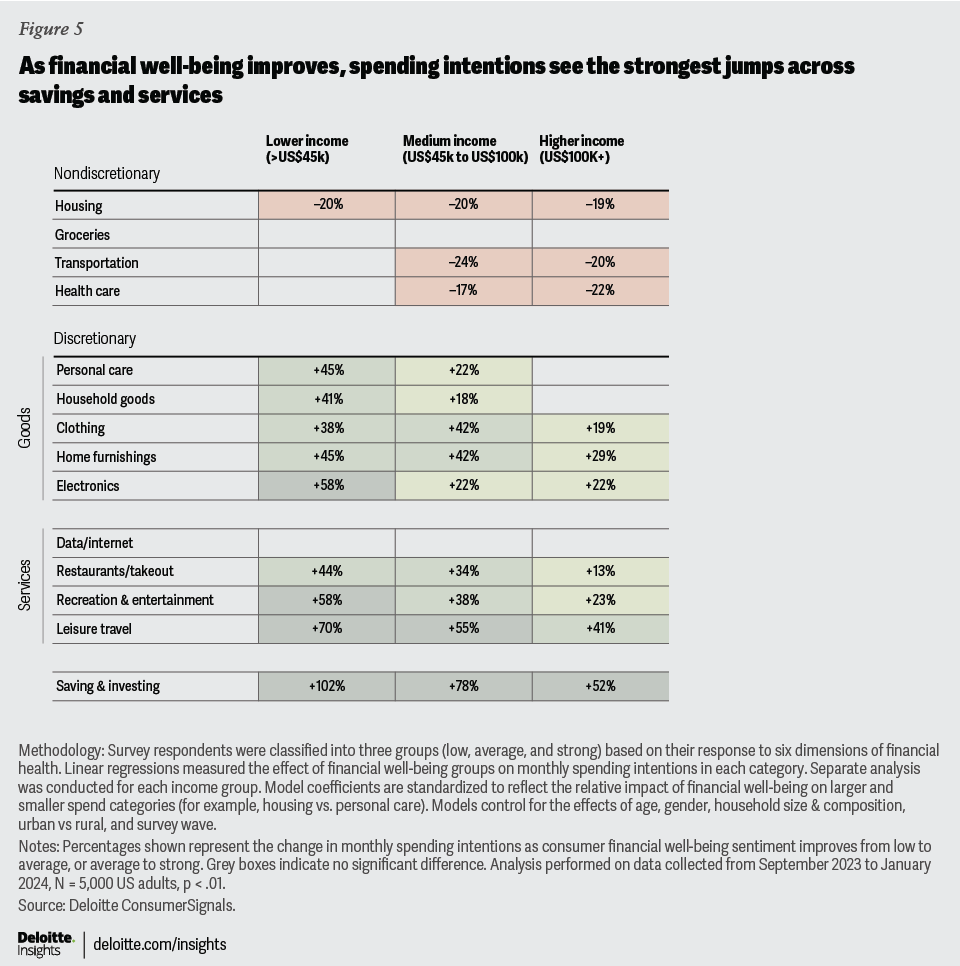
As financial well-being improves, services and savings will likely capture the lion’s share of incremental spending intentions (see figure 5 and the methodology used to control for the effects of income, age, household composition, and other variables that correlate with spending). Improvement in financial well-being appears to significantly influence lower-income households as they start to spend on goods and services that they may have been avoiding during leaner times.

Regardless of household income, consumer companies’ stiffest competition for incremental dollars likely comes from banks, brokers, hotels, and airlines. The most significant difference in spending between individuals with a strong versus weak sense of financial well-being is their ability to save (figure 5). If financial well-being improves, businesses may see a consumer focus on repadding depleted savings, particularly since the US personal savings rate has been traveling well below the long-term average for two years.10
Regarding leisure travel, lower- and middle-income Americans’ spending intentions jump between 50% and 70% when financial well-being improves from low to average or from average to strong (figure 5).

Changes in financial well-being seem to have less influence on higher-income households. For higher earners, a weaker sense of financial well-being can often translate to spending cutbacks. For lower earners, however, weakened finances often mean not spending. As a result, when financial well-being improves, the impact is amplified in lower-income households.11
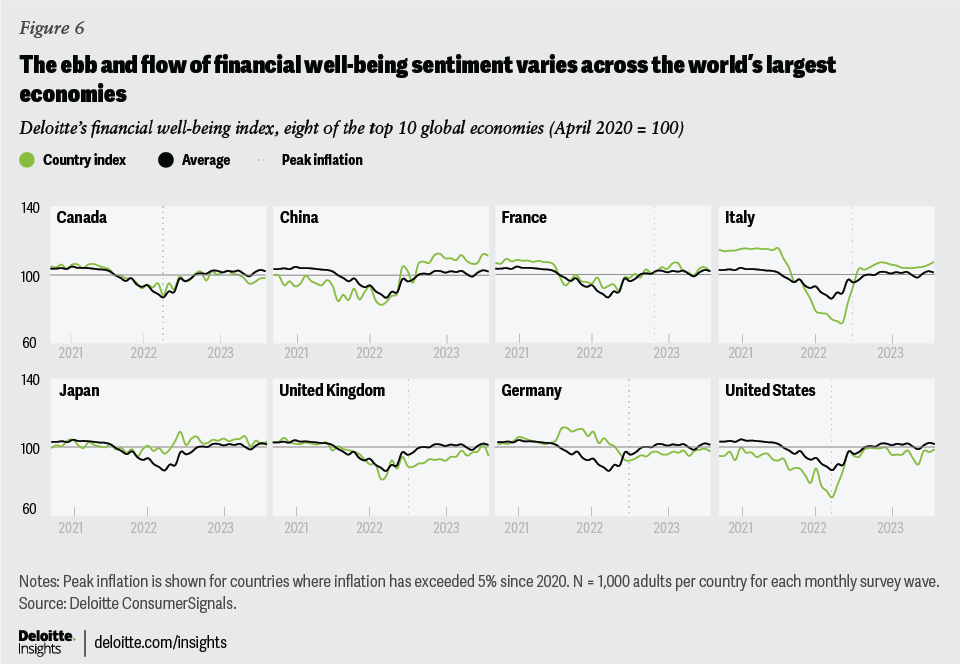
A similar relationship between inflation and financial well-being is likely playing out globally. But the strength of the relationship and timing is likely a country-specific story. The ebb and flow of financial well-being and the timing of inflation’s peak vary significantly across the world’s largest economies (figure 5). In countries such as Germany, Canada, and the United Kingdom, the inflection points between peak inflation and financial well-being seem to coincide. The trends are less clear in other countries, such as Italy and France.
That said, consumer psychology and the relationship between improved financial well-being and spending intention is likely universal.
Ultimately, as the sting of inflation wanes, consumers could be due for a boost in financial well-being. This could catalyze spending confidence to break free from a long-term plateau. The consumer companies that benefit most might best position themselves in the goods and services categories consumers are more likely to turn to when that day comes.
Methodology
To explore the impact of financial well-being on consumer forward-looking spending intentions, study respondents were categorized into three groups (low, average, and strong) based on their responses to the six dimensions of financial health that comprise Deloitte’s financial well-being index. Linear regressions were used to measure the effect of financial well-being group inclusion on monthly spending intentions across 16 categories.
Spending intentions represent the dollar amount respondents estimate they’ll spend over the next four weeks in each category. Spending on groceries, personal care, restaurants, household goods, and recreation and entertainment are asked in a two-week spending window.
Models were performed on each spending category across three income groups. Data shown in figure 4 represents model coefficients that are standardized to reflect the relative impact of financial well-being on spending intentions for larger- and smaller-spend categories (for example, housing vs. personal care). Percentages reflect the change in monthly spending intentions as financial well-being group inclusion changes from low to average, or average to strong. Models control for the effects of age, gender, household size and composition, urban vs. rural, and survey wave.
Analysis performed on data collected from September 2023 to January 2024; N = 5,000 US adults. P < .01.


