Article
6 minute read 01 December 2021

Traditional TV wanes: Television is about to dip below half of all UK video viewing

TV’s viewership decline in the United Kingdom’s bellwether market heralds a new era for the video content ecosystem

Paul Lee

Paul Lee

United Kingdom

Klaus Böhm

Klaus Böhm

Germany

Kevin Westcott

Kevin Westcott

United States

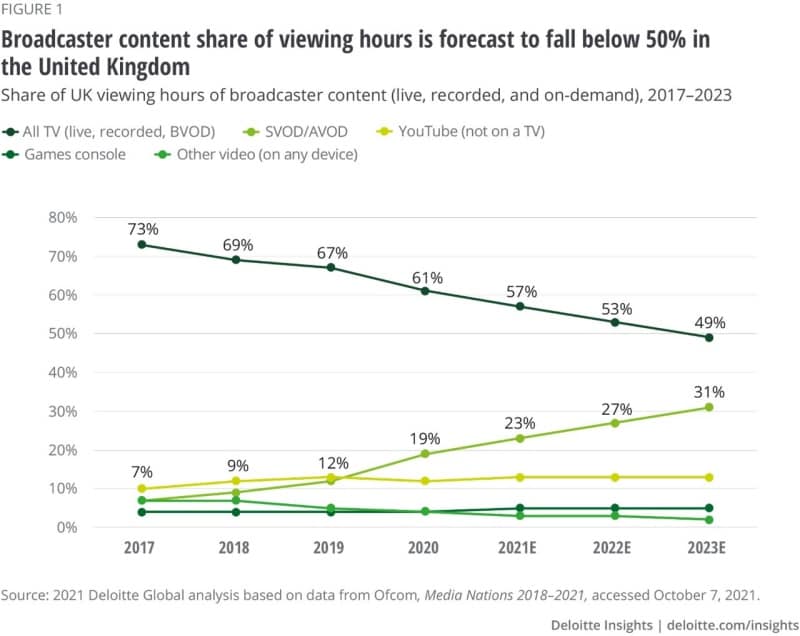
TV’s golden age may be nearing the beginning of its end. Deloitte Global predicts that, in the United Kingdom, 2022 will be the final year that traditional television from broadcasters, whether live, time-shifted, or on demand, collectively makes up more than 50% of video viewing on all screens. We expect traditional TV broadcasters’ share of viewing hours among UK consumers, which was 73% as recently as 2017, to fall to 53% in 2022 and then to 49% in 2023 (figure 1).

Readers may be asking: Why are we focusing on just one market that, with £14 billion annual revenues from video,1 is not even the world’s largest? In short, it’s because the United Kingdom’s trends are likely to foretell those in dozens of other markets with a similar composition of providers: public service and commercial broadcasters,2 pay TV companies (satellite, cable, and IPTV); video-on-demand providers (subscription, broadcaster, and ad-funded); social media; and games consoles.3

A long-expected event with great symbolic weight

Predicting a decline in traditional TV outputs is not controversial; broadcasters’ percentage of video-watching hours has been falling for years. What sets this prediction apart is the symbolism of broadcaster content dropping under half of all viewing in one major market—and the likelihood of this trend being replicated in other similar markets around the world.

One element of these business models should be segmentation by age, as video viewership shows significant age-based variations that appear to be deepening over time. In the United Kingdom, broadcaster content made up 61% of all viewing in 2020 overall, but among 16–34-year-olds, that figure was just over half that, at 32%,4 and among 16–24-year-olds, it was 26%. Among 16–34-year-olds, broadcaster content had made up 49% of viewing as recently as 2017: over three years, that share fell 17 percentage points.5 Conversely, subscription-based video on demand (SVOD) share among this age group rose from 11% to 29% over the same time period.6

Conversely, SVOD, social media (that was not watched on a TV), and games consoles had a much higher share of viewing among 16–34-year-olds.7 SVOD captured 29%, social media 23%, and games consoles 10% for this demographic, versus 19%, 12%, and 4% overall.8

Stratification by age is also evident in the US market. Among the age 18+ group, 3.7% of all video viewed in Q3 2020 was on games consoles, but viewership was tilted heavily toward youth. Children between ages 2 and 11 watched 9% of the country’s games console video content in that quarter, while 12–17-year-olds watched 18%.9

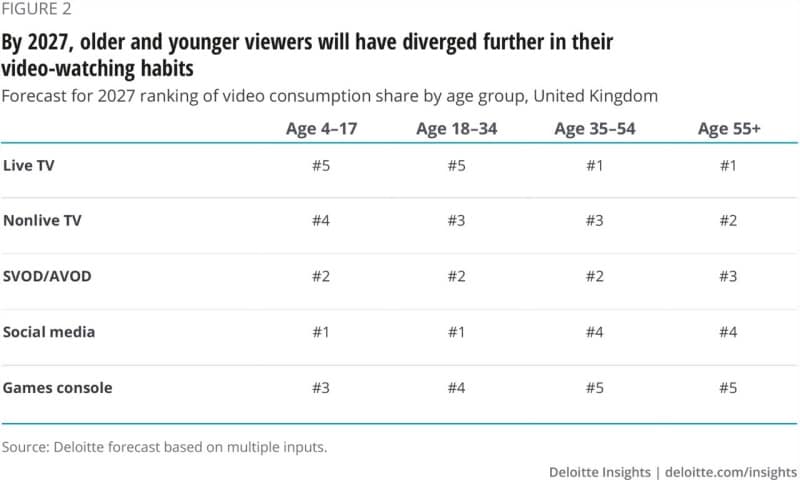
Extrapolating five years out to 2027, video consumption patterns will likely become even more stratified by age.10 In the United Kingdom, we expect social media to dominate among younger age groups (under 34) and broadcaster content among the remainder, with SVOD/ advertising-funded VOD (AVOD) the second or third choice across all age groups (figure 2). The absence of broadcaster content from the viewing diet of the under-34 age group is likely to have wide ramifications for the efficacy of advertising, with younger viewers becoming increasingly hard to reach.

Competition will likely be feisty as TV broadcasters fight to regain lost ground while other media platforms jockey for position. Today, television broadcasters’ competition comes predominantly from the combination of SVOD/AVOD, social media, and games consoles.11 (For context, three decades ago, traditional TV’s primary screen-based competitor in the home was the videocassette recorder, a technology that readers under 30 may not recognize.) This trend is comparable to that in other global markets with a similar market model.

The leading competitor over the past five years has been VOD, whose share in the United Kingdom we forecast to rise from 7% in 2017 to 27% in 2022, and again to 31% in 2023. Most of this growth has historically been in SVOD; in 2022 and beyond, we expect AVOD to increase its share as new services are launched and existing services to gain momentum.12 But while VOD is likely to be the biggest gainer, we expect competition within the space to ratchet up, with churn being a consequence.13 About 15% of VOD subscribers in the United Kingdom are likely to cancel at least one service in 2022, even if they resubscribe within a few months.14

For its part, social media has long held a sizable share of screen time among UK consumers, with more than 10% every year since 2017 and a forecast 13% share in 2022. It thrives on smaller screens and among younger viewers. Growing its percentage of all screen time will require making inroads among older viewers, whose total annual video consumption is multiples of that of younger people: 42.3 billion hours among age 55+ viewers in 2019, compared to 9.5 billion for 4–15-year-olds and 20.1 billion for 16–34-year-olds. The rate of growth among social media companies is impressive: Video-centric TikTok reached 1 billion monthly average users faster than any other social media company.15

As for games consoles, long a mainstream feature in UK homes, they will likely compete more strongly for attention in the medium term as the base of console gamers grows and gaming becomes increasingly continuous and less occasional. At the ripe old age of 50, consoles in 2022 are well positioned to gain more viewing time, albeit from a modest projected 5% share of 2022’s total.

The bottom line

Despite TV’s imminent fall from its historic dominance, its ebbing share of video viewing is hardly a death knell. TV ad revenues have largely held up despite the decline in hours watched. Between 2010 and 2019, TV viewing hours fell by 21% across all viewers in the United Kingdom,16 but ad revenues declined by only 14%, from £5.8 billion to £5 billion.17

The main reason for this is that TV is still the only game in town when it comes to aggregating the large audiences that matter to major brands. TV’s reach remains unmatched: 20 million people in the United Kingdom watched YouTube on TV sets during March 2020, but while impressive, that’s far lower than TV’s 91% peak weekly reach in the same month.18 Granted, single TV shows with truly gigantic audiences are less common than they were a decade or so ago. In 2010, 170 ad-funded TV programs in the United Kingdom attracted more than 10 million viewers; in 2020, that number had dropped to 30. But in that same year, fully 569 programs boasted 5–10 million viewers each on ITV (the United Kingdom’s largest broadcaster) alone.19 No other medium comes close to this size of audience.

On the other hand, TV may find it increasingly difficult to maintain pricing for ad time that delivers acceptable value to advertisers. TV broadcasters over the past decade have been making up for revenue lost due to shrinking viewing hours by raising ads’ price per thousand people reached, especially among younger demographics. If TV viewing continues to fall and the cost per thousand viewers continues to rise, advertisers may be compelled to seek alternatives. This will likely be broadcasters’ preeminent concern over the next few years in any market seeing declines in viewing share similar to those forecast for the United Kingdom.

How can TV sustain itself under these circumstances? One response would be to create a single measurement system that aggregates viewing behavior across all forms of television, whether live, time-shifted, or on demand. The United Kingdom’s CFlight is such a system, though it is so far unique, and broadcasters elsewhere will face challenges in replicating it: CFlight took two years to develop and required collaboration among companies that had previously competed for decades. Broadcasters could also offer advertisers campaigns that include inventory on the third-party video-on-demand services that have made the most gains in viewing time, especially among those watching on a TV set. A third tactic would be to analyze the efficacy of advertising by size of screen and type of media, betting that TV will come out ahead. While any screen can show video, the impact of an ad shown on a 50-inch screen, with sound to match, will typically be far greater than one shown on even the largest smartphone, with sound muted.

For TV to thrive going forward, the industry should regroup to face the new reality that it will be, not the dominant form of home video entertainment, but only one of many strong contenders for viewers’ attention. Its market position is still strong, and its viewing experience is still compelling, and TV broadcasters may be able to make content for global VOD companies, but the industry should make sure it does the best job of selling its strengths.

  1. Revenue is for pay TV, broadcast and online advertising, subscriptions, pay-per-view and digital transactions. Source: Ofcom, “Figure 3.1: Commercial TV broadcast and online revenue (2016–20),” Media nations 2021, August 5, 2021.View in Article
  2. In some cases, viewers will see content on third-party video-on-demand channels that was originated by and possibly branded as broadcaster content, such as ITV’s Love Island, or the BBC’s Peaky Blinders accessed via Netflix. This would not be included in the traditional TV count.View in Article
  3. The majority of social media is watched on smartphones, tablets, and PCs; mobile games have not been included in this calculation.View in Article
  4. Ofcom, “Figure 1.17: Average minutes of viewing per day, all aged 16-34, all devices (2020),” Media nations 2021, August 2021.View in Article
  5. Ofcom, Media nations 2021: Interactive report, accessed October 7, 2021.View in Article
  6. Ibid.View in Article
  7. For shares of viewing for other age groups for multiple years see: Ofcom, Media nations 2021: Interactive report.View in Article
  8. Ofcom, Media nations 2021.View in Article
  9. Calculations based on data from Nielsen, Nielsen total audience report: Advertising across today’s media, March 25, 2021.View in Article
  10. Julian Aquilina, Joseph Evans, and Jamie McGowan Stuart, Video viewing forecasts: trends accelerated, Enders Analysis, February 18, 2021.View in Article
  11. DVDs also compete, but minimally, with 1% share of viewing. DVD sales peaked globally in 2006. CRN, “DVD sales likely nearing peak: report,” December 8, 2005.View in Article
  12. Globally, Viacom’s Pluto TV, which was as of June 2021 still a predominantly US-based business, is expected to surpass US$1 billion in advertising revenue in 2021. Ben Munson, “Pluto TV on track to pass $1B in ad revenue by Q4, ViacomCBS CEO says,” Fierce Video, June 7, 2021.View in Article
  13. In 2022, we expect various factors to drive churn, including: the launch of new SVOD services, some of which may include tentpole content that was previously on another service; over the medium term, multiple niche services will launch, focused on genres ranging from Japanese anime to history documentaries; the end of introductory offers—SVOD services with scant usage may be discarded; television hardware vendors, such as Roku, are developing new revenue streams via AVOD services, some of which will displace existing services; broadcasters launching stand-alone AVOD services, such as Viacom’s Pluto TV; and the lifting of lockdown restrictions, leading to less time being spent at home. For more information on churn strategies in the US market, see: Chris Arkenberg et al., Digital media trends, Deloitte Insights, 2021.View in Article
  14. Paul Lee and Suhas Raviprakash, “Subscription video-on-demand: The one where the going gets tough,” Digital consumer trends 2021, Deloitte, September 21, 2021.View in Article
  15. TikTok, “Thanks a billion!,” September 27, 2021.View in Article
  16. Julian Aquilina, Joseph Evans, and Jamie McGowan Stuart, “Figure 1. Breakdown of total video viewing, UK individuals 4+ (mins/person/day),” Video viewing forecasts: trends accelerated, Enders Analysis, February 18, 2021.View in Article
  17. TV advertising revenues from spots, BVOD, sponsorship, product placement, ad-funded programming. Revenues adjusted for inflation. Gill Hend et al., TV advertising: Evolving the model, Enders Analysis, April 29, 2021.View in Article
  18. TV’s weekly reach among the UK population aged 4+ peaked at 91 percent in March 2020. Ofcom, BARB data: COVID-19 analysis, April 9, 2020.View in Article
  19. Gill Hend et al., “Figure 3. Number of commercial TV programmes with audiences above 3 million,” TV advertising: Evolving the model, Enders Analysis, April 29, 2021.
    View in Article

The authors would like to thank the following individuals for their contributions to this chapter: Sophie Beerlage, Sam Blackie, Neil Clements, Rupert Darbyshire, Andrew Evans, Michele Gabriel, Alexander Mogg, Suhas Raviprakash, and Matthew Sinclair.

Cover image by: Jaime Austin

Telecommunications, Media & Entertainment

Deloitte’s Global Telecommunications, Media & Entertainment practice focuses on helping companies thrive in the sector’s continually evolving business landscape. Our breadth of knowledge can help organizations uncover opportunities and understand trends that can spark new growth.

Ariane Bucaille

Ariane Bucaille

Global Technology Sector Leader

Subscribe

to receive more business insights, analysis, and perspectives from Deloitte Insights