
More growth options up front has been saved

More growth options up front Big data enables a new opening step in the growth decision-making process
18 July 2014
- Greg Banks
In the past, growth decisions were limited mostly to the ideas that executives could envision on their own. Today, with big data, executives can consider growth options that they might otherwise not even have imagined.
Introduction
Despite deploying some of the best minds and decision-making processes, US intelligence leaders were surprised by the terrorist attacks of September 11, 2001. Many pundits have offered explanations as to why these attacks surprised the experts. The 9-11 commission report focused on the difficulties in sharing information across 27 domestic agencies.1
In hindsight, we can point to an additional possible explanation: In 2001, US intelligence leaders could not leverage big data. More specifically, they could not collect and connect vast quantities and varieties of data, and they could not deploy big data analyses to detect unseen patterns. So they had no choice except to rely upon decision-making frameworks from the 20th century. But today this is no longer the case.
In the years since 2001, US intelligence organizations such as the National Security Agency (NSA) have reportedly built some of the world’s most advanced big data capabilities. In fact, the Washington Post won a Pulitzer Prize for its 2013 series of articles describing how the NSA regularly collects and analyzes data from global telecommunications carriers, social media companies, and large technology providers.2 With this big data in hand, US intelligence leaders can identify troubling patterns up front. And they are much less likely to be surprised than they would have been in 2001.
These powerful new big data options are not limited to the intelligence community; they are rapidly expanding across the business community as well. In fact, business leaders in many industries are now augmenting their traditional decision-making processes with a new opening step enabled by big data. Yes, business leaders have long used data to help them make decisions, but big data adds whole new dimensions. In the past, growth decisions were limited mostly to the ideas and concepts that executives could envision on their own. Today, with big data, executives can consider growth options that they would have not even imagined. Big data is not the same as more data. To borrow a quote from Russian revolutionary Vladimir Lenin: “Quantity has a quality all its own.”
Big data-enabled options are coming to light in virtually every industry and walk of life.
Growth decision making before big data
When it comes to making decisions on growth, for decades the process has been influenced by signature frameworks from scholars such as Bruce Henderson (1915–1992) and Igor Ansoff (1918–2002).3 Each provided us with a compelling approach to decision making, and each—as was the norm in the late 20th century—summarized his process with a two-by-two matrix (see figure 1 for Ansoff’s version). These matrices have stood the test of time, helping executives wring the most out of limited data and becoming enablers of critical decisions. They are as valuable as ever. But the process is changing regarding the use of these matrices, because big data is bringing forth entirely new options.
 Big data-enabled options are coming to light in virtually every industry and walk of life. Big data might surprise leaders of a political party by revealing a correlation between citizens’ medical histories and their partisan voting propensity. Big data might show automotive industry leaders a never-before-seen connection between vehicle colors and a college football schedule. As you’ll read in this article, all of these types of previously unseen patterns are changing the process for decision making.
But first let us briefly reflect back on leading practices before big data.
The largest North American car rental company was founded in 1957 by decorated World War II pilot Jack Taylor.4 For the first several years, the company operated exclusively in the St. Louis area under the name of Executive Leasing. But during the 1960s and 1970s, Taylor and his leadership team changed the company’s core business from leasing to renting. They also expanded the company’s footprint, across the United States and eventually internationally. And they changed the company’s name to Enterprise Rent-A-Car. While Taylor and his team were making these formative growth decisions, they could have easily emulated their larger competitors, such as Hertz and Avis, and focused on airport renters. But Enterprise leaders chose a very different route. As the company’s website explains, they chose to compete “off airport”:
In the 1960s and 1970s, Enterprise leaders realized that the best growth opportunities were not at the edge of America’s runways--but in the neighborhoods where customers lived and worked.5
We can readily imagine the Enterprise executive team using the Ansoff matrix, as shown in figure 2, to work through its options:
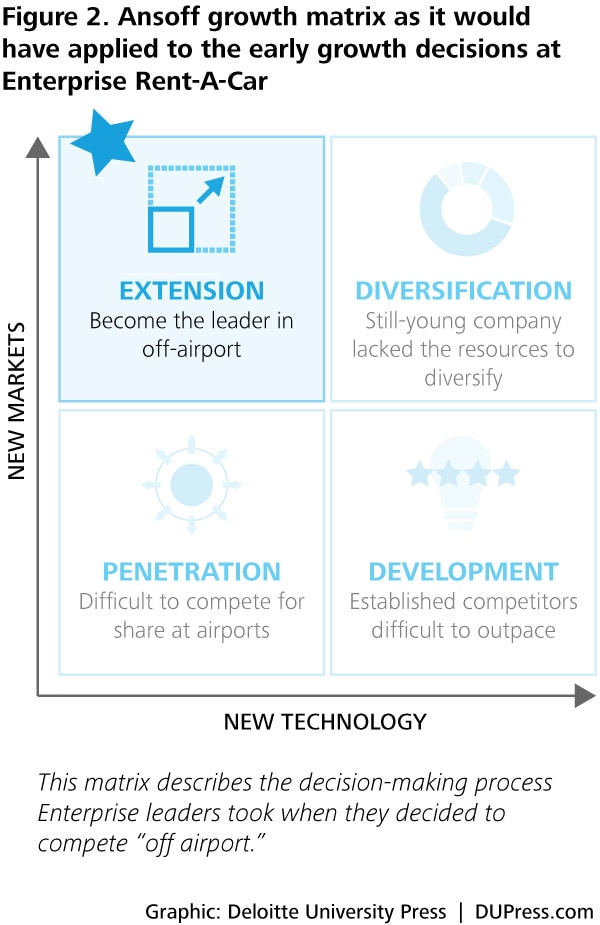 Diversification (upper right): At the time, the still-young company might have lacked resources to move far beyond its original leasing business.
- Penetration (lower left): Enterprise leaders would have likely found it difficult to compete for share at airports.
- Development (lower right): Again, established competitors would likely be difficult to outpace in areas such as technology.
Jack Taylor and his team ultimately decided on the option for a market extension (upper left), which Ansoff described as “new applications for existing products.” In the Enterprise story, the “new application” was off-airport locations, and the “existing product” was car rentals. Taylor leveraged decision-making processes from late last century and changed the entire car rental industry. Enterprise has since grown to more than 6,500 locations. And it has overtaken its airport-based competitors to become the largest car rental company in North America.
All of this was accomplished before big data.
Growth decision making after big data
Leading practices have changed, or rather been augmented. In recent years, executives in many organizations—in public and private sectors all around the world—have recognized the power of big data, and they are now adding a new opening step to their decision-making process.
To get started, organizational leaders need to integrate hundreds of distinct data sources into an upgraded, new, or outsourced technology platform. This type of integrated, secure, and private platform build-out typically requires 6 to 12 months to complete. Usually, the glue that holds the platform of data together is a series of 6- to 10-digit reference IDs. These reference IDs correspond uniquely to each of hundreds of millions of individuals. At the NSA, these individuals could be potential terrorists. At businesses, these individuals are usually customers and prospects.
The integrated data in these platforms are surely “big”—often measured in tens of terabytes—and they are collected from sources such as these:
- Profile data: complete individualized profiles (demographics, attitudes, affiliations) captured from direct contacts as well as purchased or procured from third parties
- Purchase history data: years of history at a granular level, including time of day, store or rental location, dollar amount, product models or colors, and more
- Behavioral data: customer and prospect behavior recorded in stores, on websites, on mobile devices, on video cameras, and through other channels and media (for example, in the rental car industry, this data would likely include driving habits, recorded from the vehicles)
- Network influence data: the interactive written, spoken, and video dialogue between customers and their friends, family, employers, and others
- Profit and loss data: the short- and long-term financial benefits and costs associated with each customer and prospect, including pricing, margins, and lifetime value equations
- Competitive data: key competitor locations, pricing, offers, win/loss ratios, shared customers, and so on
Once the technology platform has been completed and the data have been integrated around individual IDs, organizations are ready to augment their decision making. At this point, machine learning algorithms are often deployed. Machine learning is a type of artificial intelligence that teaches itself by relentlessly calculating correlations across trillions of intersections of connected data. Within minutes, machine learning algorithms can identify previously unnoticed correlations. And since these correlations are calculated in an unrestricted manner, some of them will be counterintuitive and some downright disturbing. It’s important to understand that machine learning works purely in the realm of mathematics. Human emotion and judgment do not enter until afterward.
Big data–enabled growth options are becoming critical for competitive success around the world and across industries.
Machine learning and big data are shining new light into many corners of our lives. The medical community can now analyze billions of web links to predict the spread of a virus. The intelligence community can now analyze global calls, texts, and email to identify possible terrorists. Farmers can use data collected by their equipment, from almost every foot of each planting row, to increase crop yields. And company leaders interested in improving their decision making can use machine learning to generate more growth options up front. Of course, many of the machine learning correlations will not lead to viable options. But, on the other hand, as depicted in figure 3 for a hypothetical car rental company, big data–generated correlations can often point to new and winning growth options:
- Diversification (upper right): Big data and machine learning might bring to light an unseen correlation involving renters of large SUVs. These renters might be transporting multiple people using inefficient routes. Rental executives might be able to grow their companies by offering a more efficient transportation option.
- Penetration (lower left): Membership in one car-rental loyalty program may correlate highly with membership in programs for other related industries. This might spur rental company executives to seek growth by providing special shared-member incentives.
- Development (lower right): Big data and machine learning might turn up a surprisingly high correlation between renting cars and completing driver education programs. This could lead to a growth option of bundling a one-stop service.
- Extension (upper left): A big data analysis of car renters might reveal a previously unnoticed pattern for weekend renters, who also spend heavily on taxis during weekdays. This could lead to a growth option of renting cars by the hour Monday through Friday.

Big data–enabled growth options are becoming critical for competitive success around the world and across industries. US-based Uber uses big data to match passengers with car services.6 European grocer Tesco leverages big data to capture a disproportionate share of sales from new families and parents.7 ComfortDelGro, a Singapore-based company, has built its distribution and pricing plans on big data.8 And global automaker Ford has become well known for using big data and machine learning to compete more effectively on a dealer-by-dealer basis.
The automotive industry requires a lot more customization than it did in 1909, when Henry Ford famously remarked that “black” was the only color offered by his young company. Today most successful manufacturers must offer multiple brands (Ford, Lincoln), models (Fusion, Fiesta, Flex), features (temperature control, power lift gate, sport suspension), and, yes, colors (blue candy, Kodiak brown, sunset metallic).9 The total combinations are staggering, with as many as 25,000 different parts in each vehicle.
Large global automotive companies need to select their best options for growth from a nearly infinite number of vehicle combinations and then distribute these vehicles in advance to over 10,000 dealers around the world. Each manufacturer needs to optimize the patterns for vehicles, features, and colors, so that local prospects can see, test, and buy their favorites. If auto executives lag on this capability, they can quickly lose competitive advantage in both sales and inventory costs.10
Until recently, automakers relied upon decision-making frameworks from last century. According to John Ginder, a manager for systems analytics with Ford Research & Innovation, many of these matrix-related decisions of the past are now considered overly reactionary. “If a dealer sold a red Mustang,” Ginder says, “we may send the same dealer another red Mustang, even if the next sale is not likely for several months.”11 Today, however, Ginder and his team have invested in a big data platform called SIMS (Smart Inventory Management System).
SIMS helps Ford executives envision in advance the dealer-level purchase options for Ford’s almost infinite number of vehicle combinations. Ford Research & Innovation executives likely integrated hundreds of data sources into SIMS and regularly use neural network algorithms (a type of machine learning) to provide dealer-level options. Once these options are visible, executives can make better decisions.
Michael Cavaretta, a colleague of Ginder, explains further: “One of the key benefits of big data and SIMS is to not have to rely upon samples.”12 Rather, as Cavaretta explains, Ford can now “see around corners” and identify many more growth options to populate its matrices. For instance, Ford vehicles with gold and blue colors might sell unusually well in South Bend, Indiana, due to school spirit (they match the local University of Notre Dame’s colors). But without big data and machine learning, this correlation may not even have reached the decision makers’ attention.
Seeing the patterns
Many of the people in the world, including customers and prospects in every industry, create steady streams of collectable, connectable data through devices such as phones, computers, televisions, automobiles, refrigerators, and medical monitors. When you search for a dentist (online, on the phone, or even as a pedestrian), carry your phone, comment on a photo, watch a movie, agree to terms and conditions, set your house alarm, or conduct your daily life, you’re creating data.
In addition, with the rise of the Internet of Things, many other devices contribute to the big data explosion. Transporters such as cars, trains, and planes; medical devices in hospitals, doctors’ offices, and even patients; engines in factories and planes; farm and agricultural equipment; even the water, wind, and air itself: they all now provide massive real-time streams of data.
Today it is possible to bring to light patterns that might never even have been hypothesized.
Not only has the volume of data increased, so has the interconnectivity. Through common computer languages like those used in IP protocols, data from virtually any source can be connected to another. Often this connectivity relies on IDs for individuals. And with this kind of connected data in hand, altogether new methods of conducting business become possible. As an example, marketers are starting to describe interconnected big data as enabling them to manage a “customer 360°” (see figure 4).

With a customer 360°, marketers can now interact with their buyers in a consistent, personalized fashion across time (for example, throughout a busy day), across space (for example, along their commute route), and across communication channels and media (for example, TV to phone to Web). Ever since the dawn of marketing, practitioners have aspired to interact with each customer in this type of personalized, one-on-one, always-on fashion. With big data and ubiquitous connectivity, the customer 360° is now moving closer to reality.
Similar to how big data is allowing marketers to turn aspirations into reality, big data is also allowing business analysts to turn their skills into new growth options. In the past, business analysts often limited their scope to a finite number of hypotheses. Today it is possible to bring to light patterns that might never even have been hypothesized. In fact, with machine learning, hypotheses can become a limitation. For example, analysts with a political party may use machine learning to profile party-loyal voters: What do these individuals do for a living? How do they spend their time? Where do they travel? With whom do they communicate? What do they purchase? What do they say to others? Machine learning algorithms systematically comb through the big data to find correlations, either positive or negative.
Political party leaders may never have hypothesized that their loyal voters consort heavily with individuals from the opposite side of the spectrum. However, if machine learning analysis turns up such a striking correlation, these leaders may pursue some type of targeted “growth option” to secure these loyalists’ votes.
We are seeing the rise of machine learning in both the private and public sectors.13 And with it has come the growing realization that decisions on growth opportunities can and should be augmented by big data. Business leaders provide us with many examples of this new opening step in the decision-making process. (See the sidebar “Machine learning provides a new growth option” for an example from wireless telecom carriers.) In addition to business leaders, the medical community, agriculturists, political parties, and even the NSA are now considering more options up front. While big data’s full impact upon society continues to evolve, there’s at least one thing we can see clearly already: Big data and machine learning can help organizations augment and improve the use of their traditional growth matrices.
Machine learning provides a new growth option for some of the world’s largest wireless carriers
Big data and machine learning are on the forefront of generating growth options. Here’s an example from our experiences in the wireless telecom industry.
Historically, leaders of wireless telecom carriers have used traditional decision matrices and focused their customer management resources on the first 90 days of each new customer’s relationship. During this “early life” period, customers are more likely to defect. So executives at carriers around the world focused diligently on reducing defection during days 1 through 90. Then, at day 91, these same executives often withdrew much of their company’s attention and relegated these same customers to relative anonymity.
This all made perfect sense, until big data and machine learning identified a new growth option and changed the options going into the decision matrix.
It turns out that once wireless customers move past day 91, not only does their defection risk go down, but their purchase propensity goes up. So just at the time when executives had historically dialed down attention, newly entrenched customers wanted to buy more!
Why was this opportunity not appreciated for so long? In the traditional decision-matrix world, the time period right after a customer’s 90th day did not seem particularly interesting. But leaders at several major carriers changed their choices when big data analyses revealed that purchase propensity for upgraded equipment, larger pricing plans, and more often peaks from roughly day 91 to day 120. Instead of withdrawing their company’s resources and attention from customers during this time, executives at some carriers have begun to redirect their attention toward driving additional purchases after day 90.
Based upon author’s experience at several wireless telecom carriers around the globe
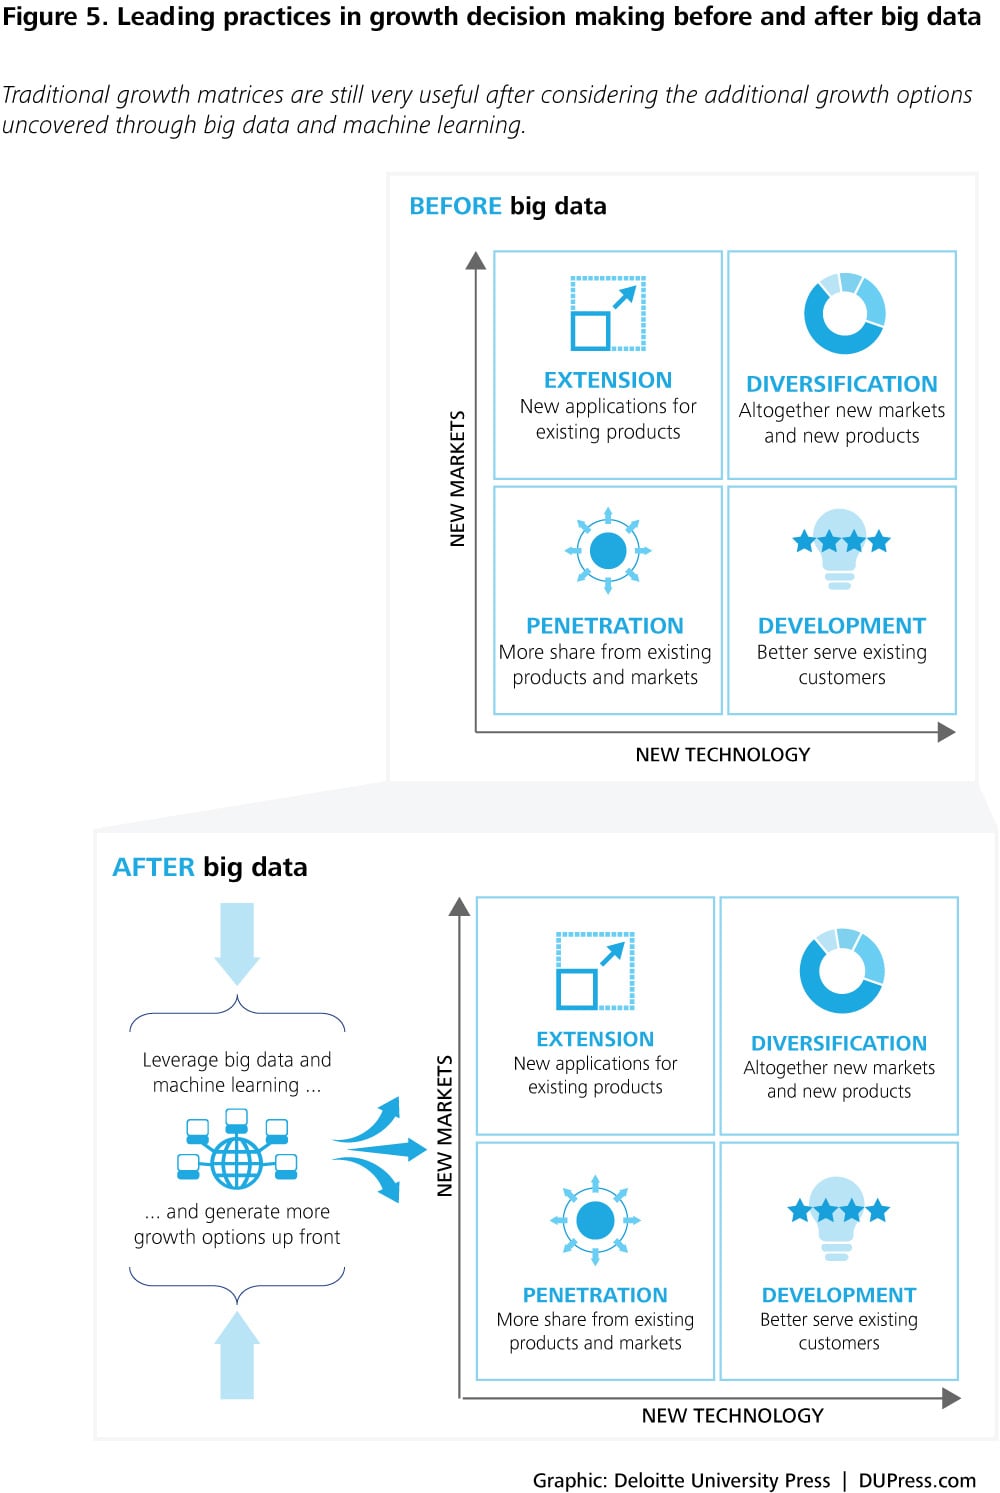
Traditional growth matrices are still valuable—but only after considering more growth options up front
As summarized in figure 5, leading practices have been augmented regarding the decision-making process for growth. With a decision matrix in hand, leaders can still rely upon a trusted tool that they have mastered over decades. And with big data in hand, these same leaders can now approach their decision making with a much, much larger number of growth opportunities to consider.
Specifically, in the era of big data and machine learning, company leaders should:
- Update their growth decision making to add an initial step, which leverages big data and machine learning
- Approach big data analyses without too many constraints
- Assemble a longer list of growth options up front, and then leverage the existing decision matrices to make the final selections
 Please note that we do not advocate discontinuing the use of traditional decision-making matrices. Quite the opposite—although big data is emerging as a competitive requirement, machine learning cannot replace executive judgment. Companies still need the wisdom of cohesive leadership teams to review all the options, leverage decision-making matrices, and make the correct growth choices. Visionary scholars of the late 20th century, such as Igor Ansoff and Bruce Henderson, were correct in their day and remain so today. Their decision-making matrices have stood the test of time. But even these visionaries could not have foreseen the power of big data. With analytical techniques such as machine learning to help us make sense of all this new and interconnected data, decision makers should now augment their existing processes—and generate more growth options up front.14
© 2021. See Terms of Use for more information.
