


Decoding corporate share buybacks: Is it at the cost of investment? has been saved

Decoding corporate share buybacks: Is it at the cost of investment? Behind the Numbers, November 2017
17 November 2017
Corporate profits and cash reserves are at an all-time high. However, many companies have been spending an increasing share of profits and cash on buying back their own shares while the share of profit spent on investment in equipment and structures is often falling. We examine these concurrent trends and attempt to answer whether corporate share buybacks can indeed reduce overall investment.
Introduction
Learn More
Explore the Behind the Numbers collection
Recent years have seen corporations accumulate unprecedented profits and cash reserves. Corporate managers have increasingly used this cash to buy back their own shares. This has attracted the attention of researchers concerned about the perceived focus of management on short-term stock prices at the expense of investment. We examine the overlapping trends of increasing share buybacks and decreasing the share of corporate profits spent on physical investment. We look at the suggested drivers of these trends—and at the question of whether share buybacks can indeed reduce overall investment.
What are share buybacks and why do they matter?
When a public company issues shares of stock, it distributes ownership of the company to the public. Shareholders buy parts of the company by paying a price for each share of stock they purchase. The company’s managers then operate to boost the price of shares in order to maximize shareholder value. In the medium to long term, this typically involves investing in equipment and new buildings to boost overall productivity, cash flow, and profits. As the company becomes more valuable, so do the shares held by each shareholder.
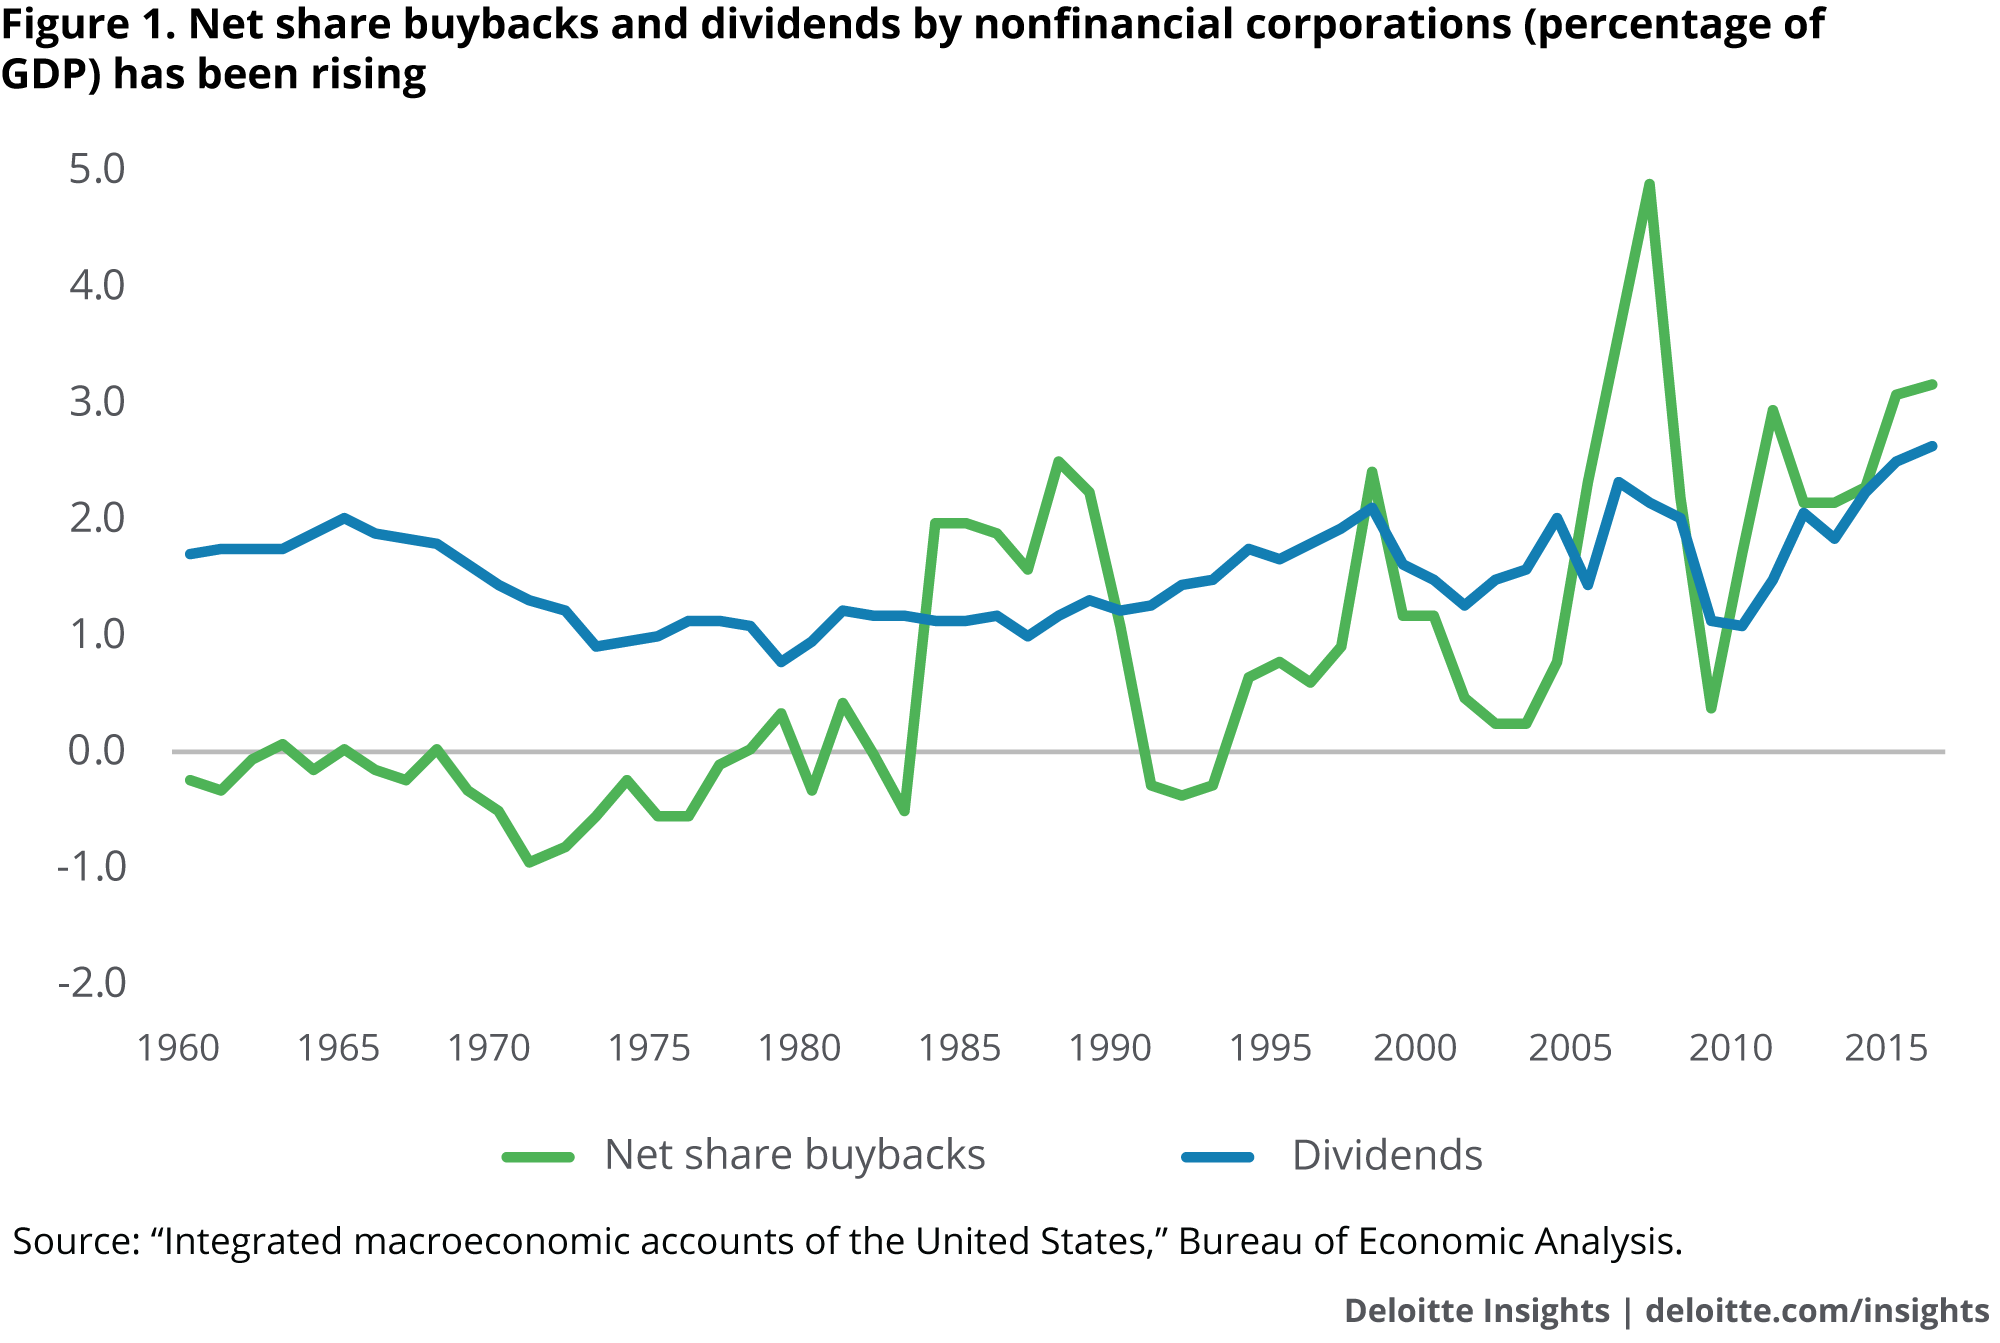
However, in the short term, the price of outstanding shares can be increased by simply reducing the number of shares in the market. A company can achieve this through share buybacks. A share buyback, as the name suggests, is when a company buys its own shares back from shareholders, either in the market or by making a formal offer, normally at a premium to the market price.1 A share buyback reduces the number of shares in the market and therefore increases the price and earnings per share of the remaining outstanding shares. The practice of share buybacks has been growing in popularity over the last couple of decades. In fact, 85 percent of the S&P 500 companies have resorted to share buybacks in the last decade.2 In addition to share buybacks, dividends distributed to shareholders have also been on an upward, albeit less obvious, trend (see figure 1).
Share buybacks, business investment, and corporate profits
While nonfinancial corporations' share buybacks and dividend distribution (that is, their financial operations) have trended upward as a share of GDP, investment in equipment and structures (that is, their physical investment or business investment) has remained relatively unchanged as a share of GDP. Nonfinancial corporate business investment as a percentage of GDP averaged 8.9 percent between 1960 and 2016.3 After a steady increase through the roaring 1990s, business investment as a percentage of GDP peaked in 2000 at 10.7 percent before falling back to its long-term average (see figure 2). The increase in share buybacks and dividend distribution while business investment has remained relatively unchanged (all as shares of GDP) comes at a time when much of corporate America has accumulated large profits and cash reserves and has access to cheap debt. This implies that a smaller proportion of profits is being spent on traditional business investment in equipment and structures. (For more details, refer to What’s the matter with investment?)4

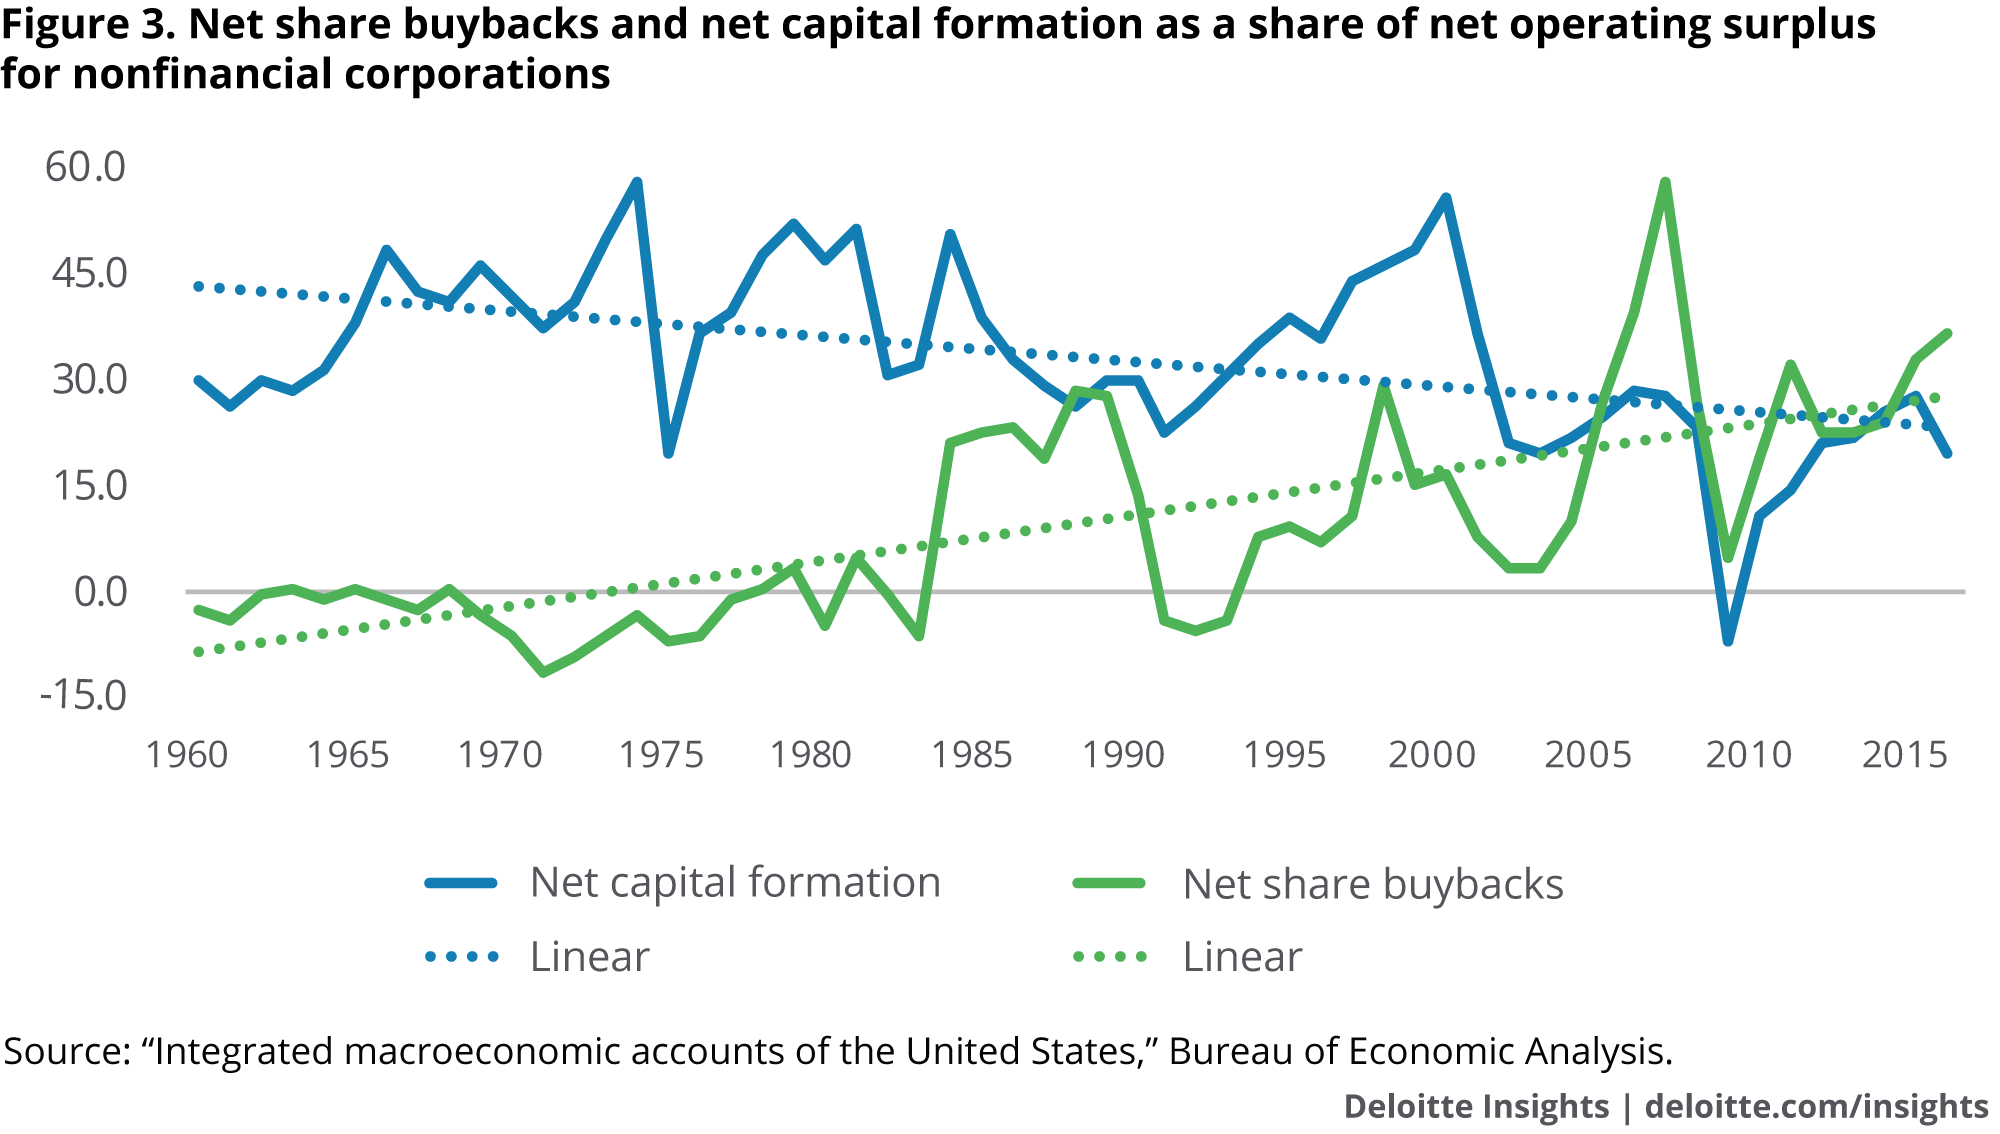
However, the concurrent trends (increasing share buybacks and decreasing business investment as a percentage of corporate profits) have caught the attention of several researchers (see figure 3). The general concern is that increasing share buybacks and dividend distribution among nonfinancial corporations is coming at the cost of business investment (which, if undertaken, would lead to long-term gains in productivity and overall economic value).
Theories behind the trends
Researchers have proposed several theories that attempt to explain the possible drivers behind the overlapping trends:
- One theory suggests that stock-based compensation for corporate executives has encouraged decisions to increase share buybacks. This theory is based on the fact that compensation for corporate executives is largely in the form of shares of stock and is therefore linked to the performance of the company’s shares, indicated by metrics such as earnings per share (EPS). In 2012, for instance, 500 of the highest paid executives received an average remuneration of $24.4 million, of which 52 percent was in the form of stock options and a further 26 percent was in the form of stock rewards. The hypothesis is that executives boost EPS by buying back shares to reduce the total number of outstanding shares. In doing so, they act in self-interest, boosting their own remuneration.5
- A related hypothesis is that activist shareholders have increasingly coerced companies into focusing on shareholder returns in the short term rather than boosting productivity and growth in the long term.6 This hypothesis points to a rise in activist campaigns. For instance, there were 231 activist campaigns in 2009, and this number rose steadily to 377 in 2015.7 This theory claims that because of increased pressure from activist shareholders, companies have spent on share buybacks, at the cost of investments in equipment and structures.
- Another theory is that increased industry concentration and reduced business dynamism have encouraged methods of boosting short-term shareholder value while reducing the incentive to invest for long-term growth. Therefore, practices such as buying back shares has gradually increased while the proportion of profit spent on business investment has declined. This theory draws on data that indicates rising industry concentration and reduced business dynamism. Data across several industries indicates that the share of revenue flowing to the top 50 companies in each industry has increased over time (1997 to 2012).8 Furthermore, returns on capital invested by public nonfinancial corporations in the United States has also become more concentrated. Returns flowing to the 90th percentile company was five times the median in 2014, up from just twice the median in 1990.9 Increased merger and acquisition deal volume has also contributed to industry concentration and erosion of competition.10 Data also shows that the firm start-up rate has been declining since 1980, while the firm exit rate has remained flat, indicating reduced business dynamism.11
- Yet another theory is that irreversible fixed investment is deferred due to uncertainty related to associated returns.12 Therefore, firms resort to short-term strategies such as share buybacks to deliver shareholder value rather than risking physical investment. However, improved global economic growth and clear policy prescription should support an acceleration in corporate investment spending if this hypothesis is true.
- Another reason is lower capital expenditure requirements, because of the rise of high-value technology companies that require lower spending on equipment and structure as well as due to reduced capital expenditure requirements in traditionally capital-intensive sectors such as the energy sector. This hypothesis is supported, in part, by the fact that business investment in intellectual property products (software, R&D, entertainment) has grown quicker on average since 2000, than investment in equipment or structures. As a percentage of nominal GDP, the dollar value of the net stock of private intellectual property products increased 2 percent from 2000 to 2016, while the dollar value of the net stock of private equipment decreased 2 percent during the same period. Reduced capital intensity in key industries helps explain why a lower share of overall profits is being spent on physical investment, therefore allowing firms to use profits, cash reserves, or cheap debt to boost stock values while also returning profits to shareholders. Large share buybacks have been a constant feature in the technology sector since 2000. In oil and gas, buybacks have varied along with the price of crude oil, spiking between 2006 and 2008 and again between 2011 and 2014 before declining in 2015.13 Share buybacks in both the oil and gas sector and the technology sector have been dominated by the largest companies, with total buybacks in technology being far larger than in oil and gas.14
These theories are all in keeping with the long-term trends of increasing corporate share buybacks and a reduced share of corporate profits spent on business investment. However, none of them prove a clear relationship between financial operations and physical investment in the nonfinancial corporate business sector. Nonetheless, while many nonfinancial corporations are indeed spending a smaller share of profits on business investment, increased share buybacks only transfer resources from corporations to shareholders. Therefore, while the onus of increased physical investment is shifted, the total savings available for investment does not change and therefore buybacks do not change the overall amount of investment. In fact, overall nonresidential private fixed investment, on average, has grown quicker than real GDP from 2000 to 2016.
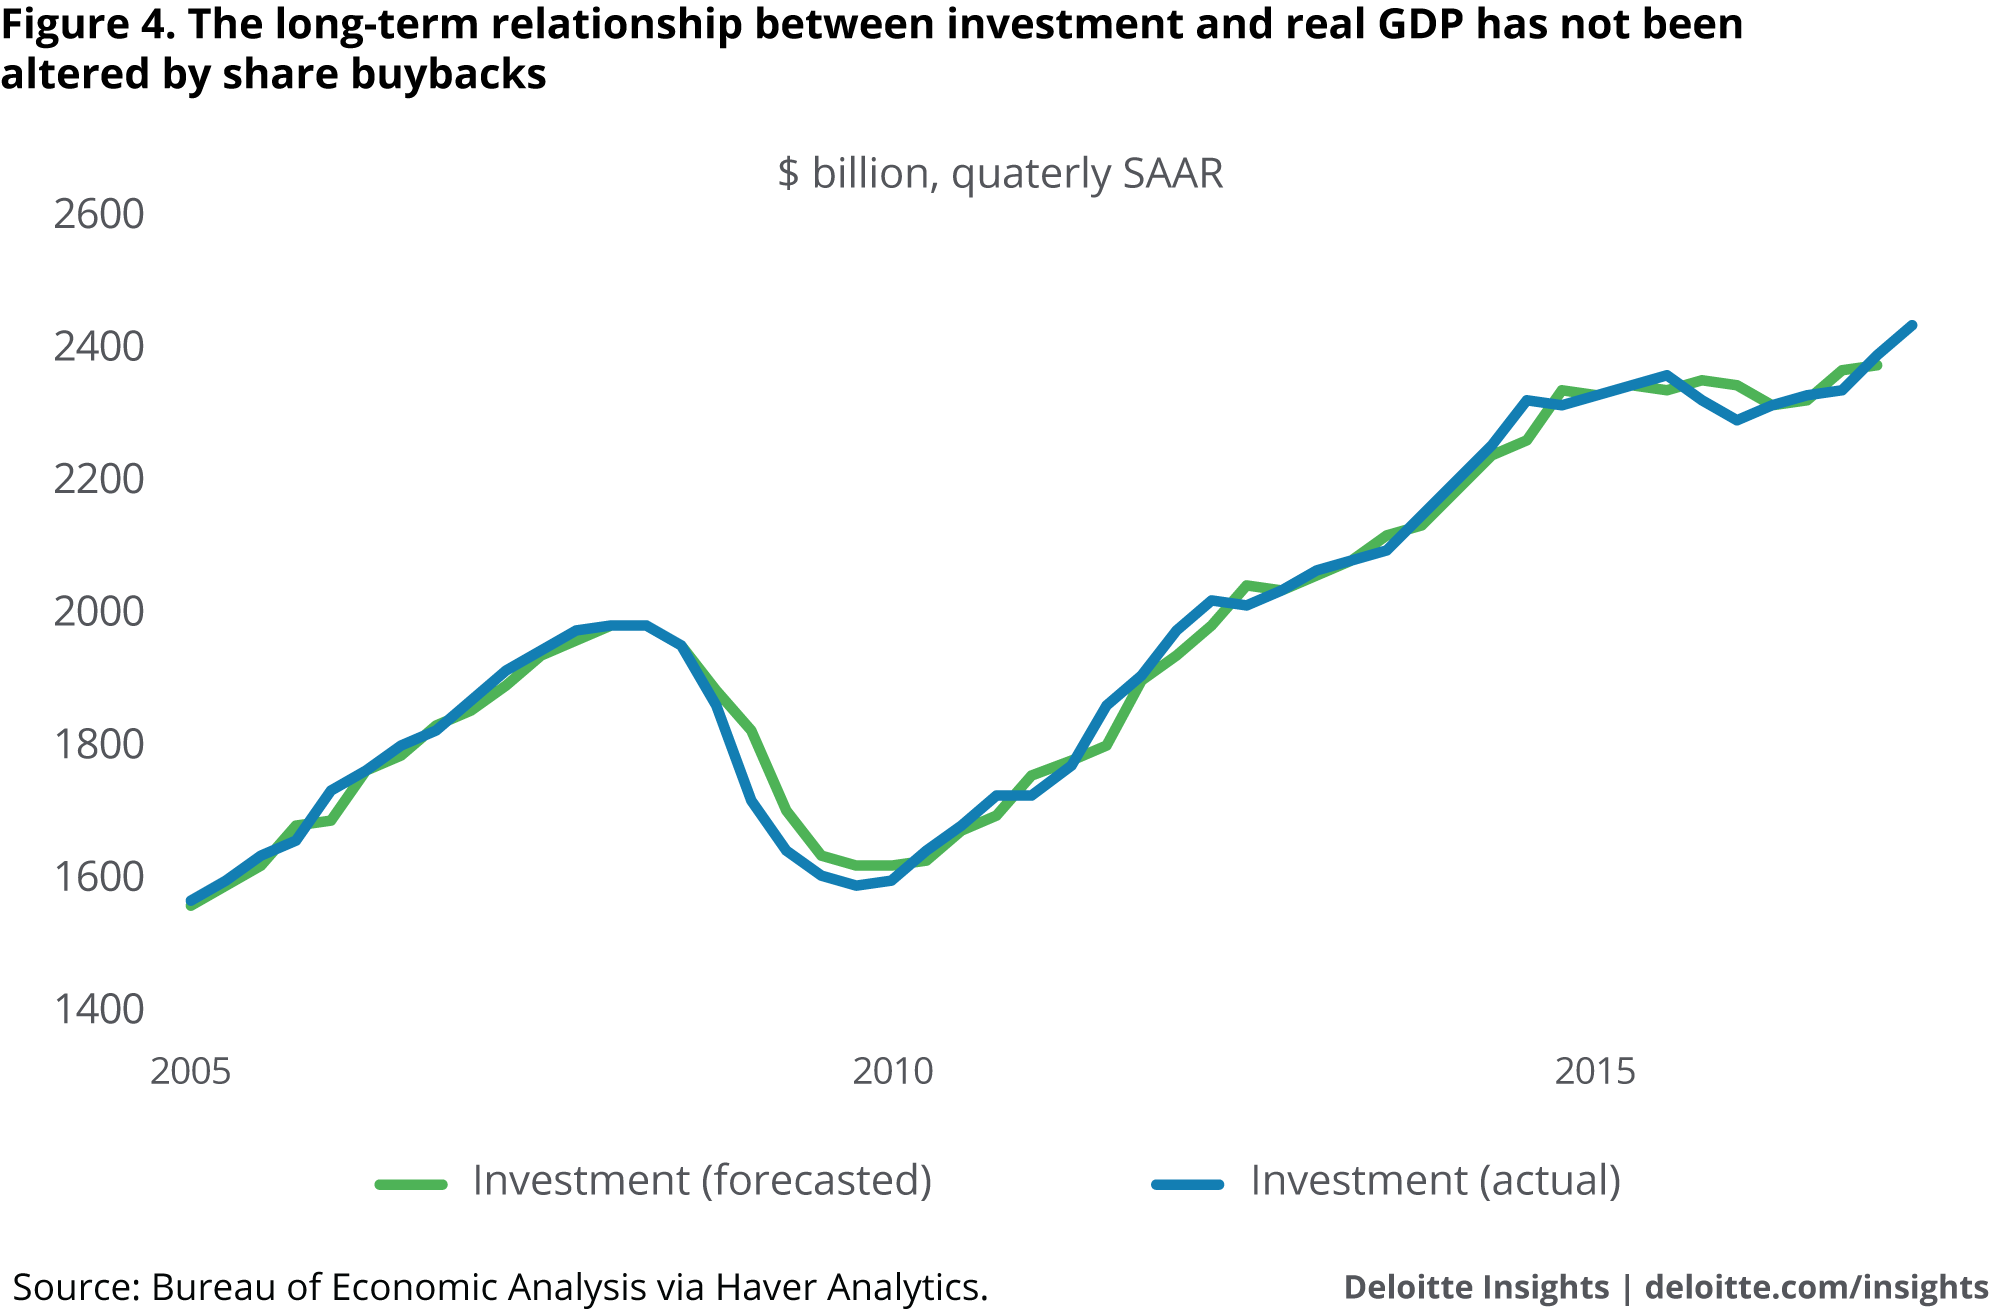
A statistical model for private nonresidential investment in the United States
In an attempt to add clarity, we present a simple statistical model of private nonresidential investment as a function of real GDP in the United States (refer to the sidebar, “Data appendix”). We use the model to forecast investment during the last decade (2005 to 2017)—a period during which share buybacks surged. The forecasted values of investment are then compared to the actual values of investment (see figure 4). The model shows an unbiased forecast implying that the long-term relationship between real GDP and private investment in the United States has not been affected by the sharp increase in corporate share buybacks over the last decade. This is because share buybacks likely do not change the total savings available in the economy for investment spending.
A global perspective
Interestingly, the concurrent trends of nonfinancial corporations spending a lower share of profits on physical investment while increasing returns to shareholders through buybacks and dividends is not limited to the United States. Data for the Organization for Economic Cooperation and Development (OECD) shows that these trends are evident across several developed economies.15 While some of the hypotheses applied to the United States might also apply to other developed economies, an overarching factor to consider is the effect of globalization.
In particular, we consider China’s growing role in global business. When businesses based in the developed world shift away from domestic suppliers to low-cost suppliers in China, business investment shifts overseas while domestic profits increase.16 The offshoring of capital-intensive work and the outsourcing of services to lower-wage countries helps explain higher domestic profits and lower domestic corporate investment and therefore a lower share of corporate profits spent on domestic investment.
The future possibilities for profit spending in the United States
Back in the United States, the future course of profit spending on physical investment is likely to be influenced by monetary and fiscal policy. The gradual removal of monetary accommodation would subsequently raise real interest rates if low inflation persists. This can make savings more attractive while raising borrowing costs and slowing profit growth for companies. Higher interest rates and persistently low inflation could therefore limit the share of profits spent on physical investment over the medium to long term. On the other hand, a fiscal spending package to rebuild and expand existing infrastructure in the United States could spur an acceleration in corporate investment. Additionally, lower corporate tax rates, especially lower tax rates on repatriated profits, could also have a positive effect on corporate investment. Repatriated profits, however, may also be used to repurchase shares. But a rising price-to-earnings ratio across equities will probably continue to make share buybacks increasingly more expensive. This is probably the reason behind the decline in buybacks over the last two quarters. Nonetheless, the practice of buying back shares will not reduce the savings available for investment, but may shift the investment decision away from corporations to institutional and individual shareholders.
Data appendix
We take quarterly data on GDP and private nonresidential investment for the United States. Quarterly data is seasonally adjusted and at annual rates in billions of dollars.
The variables, investment and GDP, are found to be cointegrated. We regress the log of investment on the log of GDP for a sample period of Q1 1980 to Q4 2004. This is the cointegration equation. Estimation yields the following results:
LOG(I) = C(1) + C(2)*LOG(GDP)
LOG(I) = -1.43 + 0.93*LOG(GDP)
Variable |
t-Statistic |
C |
-9.5 |
LOG(GDP) |
54.0 |
We then set up the error correction model for the same time period (Q1 1980 to Q4 2004).17 The error correction model regresses the log difference of investment on the first-order, the first-order log difference of GDP, and the error term from the cointegration equation. The error correction model is as follows:
DLOG(I) = C(1) + C(2)*DLOG(I(1)) + C(3)*DLOG(GDP(1)) + C(4)*(LOG(GDP(1))-COINT.@COEFS(1) COINT.@COEFS(2)*LOG(GDP(1)))
DLOG(I) = 0.124 + 0.56*DLOG(I(1)) - 0.23*DLOG(GDP(1)) - 0.056*(LOG(GDP(1))-COINT.@COEFS(1)-COINT.@COEFS(2)*LOG(GDP(1)))
Variable |
t-Statistic |
C |
0.96 |
DLOG(I(1)) |
5.57 |
DLOG(GDP(1)) |
-0.85 |
(LOG(GDP(1))-COINT.@COEFS(1)-COINT.@COEFS(2)*LOG(GDP(1) |
-0.897 |
We use the error correction model to forecast investment for Q1 2005 to Q2 2017 (actual and forecasted values are plotted in figure 4). Share buybacks surged during this period.
To check for bias in the forecast we regress the actual values of investment from Q1 2005 to Q2 2017 on the forecasted values during the same period. The regression yields:
I = C(1) + C(2)*IF
I = -3.62 + 1.00*IF
Variable |
t-Statistic |
C |
-0.11 |
IF |
60.54 |
C is close to zero and the coefficient on IF is indistinguishable from 1—this indicates the forecast is unbiased. Furthermore, it is evident that the long-term relationship between private investment and GDP has not been altered by the surge in corporate share buybacks. We conclude that corporate share buybacks merely transfer resources from corporations to shareholders without altering the savings available for investment.
© 2021. See Terms of Use for more information.
