
The path ahead Navigating financial services sector performance post-COVID-19
45 minute read
11 September 2020
While the economic impact of COVID-19 may have some similarities to the 2007–09 financial crisis, the implications for financial firms’ performance are likely to be different. Developed by the Deloitte Center for Financial Services, this series explores the pandemic’s financial impacts on specific financial services industry sectors to help leaders find the right path forward.
View sector performances
Impacts on mortgages and the housing market
The US mortgage industry is experiencing stress, after years of relative calm. As COVID-19 severely blunts the economy, and unemployment reaches levels unseen even in the previous financial crisis,1 many households are struggling to keep up with their mortgage payments.2 This is reminiscent of the 2008–09 global financial crisis, but there are some key differences.
Learn more
Learn more about connecting for a resilient world
Explore the Financial services collection
Learn about Deloitte's services
Go straight to smart. Get the Deloitte Insights app
This time around, the federal government has been quick to act to help alleviate the initial impact of COVID-19 on borrowers. The Coronavirus Aid, Relief, and Economic Security (CARES) Act, for instance, grants relief options for federally backed loans, which about 70% of homeowners have.3 As of May 31, around 4.3 million mortgages were in forbearance, representing 8.53% of the total outstanding mortgages.4 This relief, however, places a significant burden on mortgage servicers, which now have to pass along the missed borrower payments to investors.
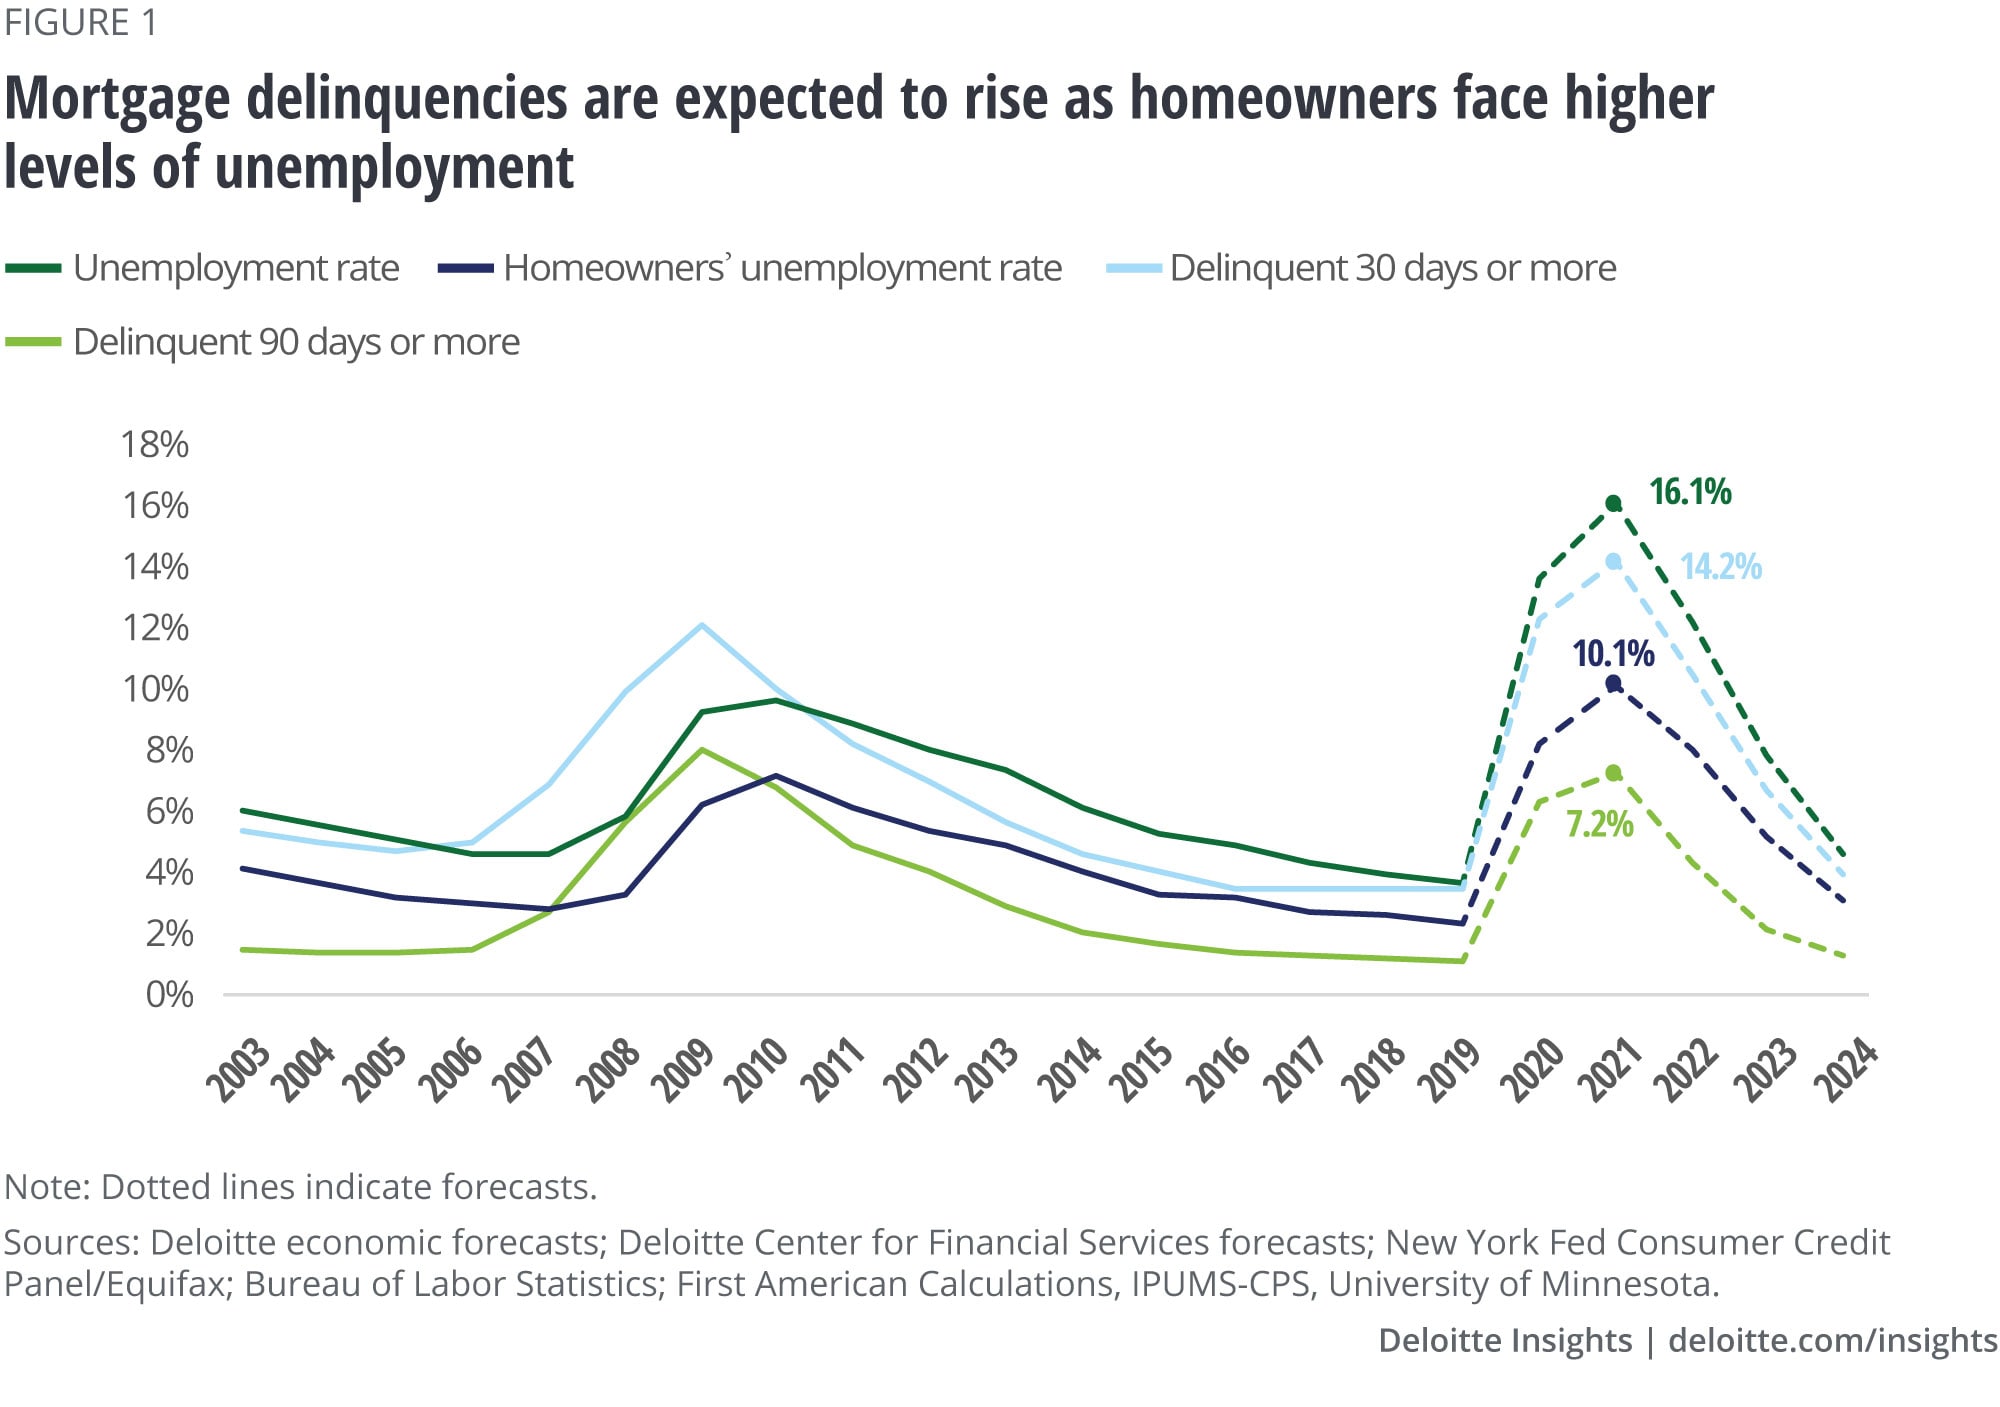
The mortgage industry was in a stronger position than it was going into the last financial crisis. Before the pandemic hit, most banks were sitting on a much healthier credit book and substantially lower levels of delinquencies and foreclosures. Demand-supply dynamics were stable, and housing inventory and prices were at more favorable levels than they were before the previous financial crisis.5
However, risks persist, especially in the nonbank sector. Lightly regulated independent mortgage companies, which typically have limited liquidity and capital buffers to withstand a shock of this magnitude, are now facing the brunt of the forbearance challenge. As the forbearance period nears its end and unemployment remains at elevated levels, delinquencies could rise to new levels. For instance, 30-day delinquencies are expected to peak at 14.2% in 2021 (figure 1), compared with a 12.1% peak in 2009 after the last financial crisis.
In this article, we discuss the emerging risks in mortgage servicing and default management. We will also suggest actions banks and nonbanks can take to become more resilient as they navigate through the current crisis.
Challenges are more pronounced in the nonbank sector
The mortgage servicing business faces several challenges. Managing liquidity so that servicers can provide efficient loan servicing generally tops the list. Meanwhile, concerns over a deluge of loan modification requests, coupled with a wave of delinquencies, are also on the horizon.
Not all servicers are in the same boat: The ability to honor deferred principal and interest payments varies by servicer type. While bank servicers are well-capitalized and have sufficient liquidity to manage these commitments, many nonbanks are facing a different set of realities. In particular, most pure play servicers that do not have origination shops to benefit from the refinancing wave in a low-rate environment are acutely challenged to fund these advances.
The rising liquidity concerns pose an existential risk to cash-strapped nonbank servicers, reminiscent of the 2008–09 financial crisis, when hundreds of nonbank servicers were forced to exit the mortgage industry.6 For many nonbanks, their lack of experience navigating through a downturn adds a layer of operational risk.
Importantly, these risks to nonbanks could spill over to the rest of the industry. Nonbanks are now equally important industry players: Their share in origination grew to 59% in 2019, up from 9% in 2009.7 In addition, nonbanks acquired billions in mortgage servicing rights (MSRs) from banks after the 2008 financial crisis,8 growing their servicing market share to 49% in 2019 compared to a 6% share in 2010.9
Regulators and government-sponsored enterprises (GSEs) have stepped in to alleviate servicers’ concerns with measures such as capping the duration for advancing forbearance payments,10 opening pass-through assistance programs,11 and allowing deferred payments to be treated as second liens.12 But despite these measures, legitimate, systemic risks to the housing market in the United States remain.
First, the mortgage servicing industry is facing severe capacity constraints. Servicing shops, whether part of banks or nonbanks, are overwhelmed with borrowers’ queries and requests, which can result in sub-optimal suggestions and resolutions. When consumers misunderstand or are confused about processes, questions about fair treatment can emerge, which could increase reputational and litigation risks in the future.13 For instance, more than one-in-five consumer complaints mentioning COVID-19 to the Consumer Financial Protection Bureau pertained to mortgages.14
Meanwhile, the industry may not be adequately prepared to manage the upcoming wave of loan modification requests once the forbearance period ends. Among some, if not most, servicers, the lack of standard procedures could make the loan modification process more daunting and stress limited resources.
Moreover, failure to help distressed and at-risk borrowers could negatively impact servicers’ ability to effectively minimize and manage delinquencies, loan modifications, and foreclosures.
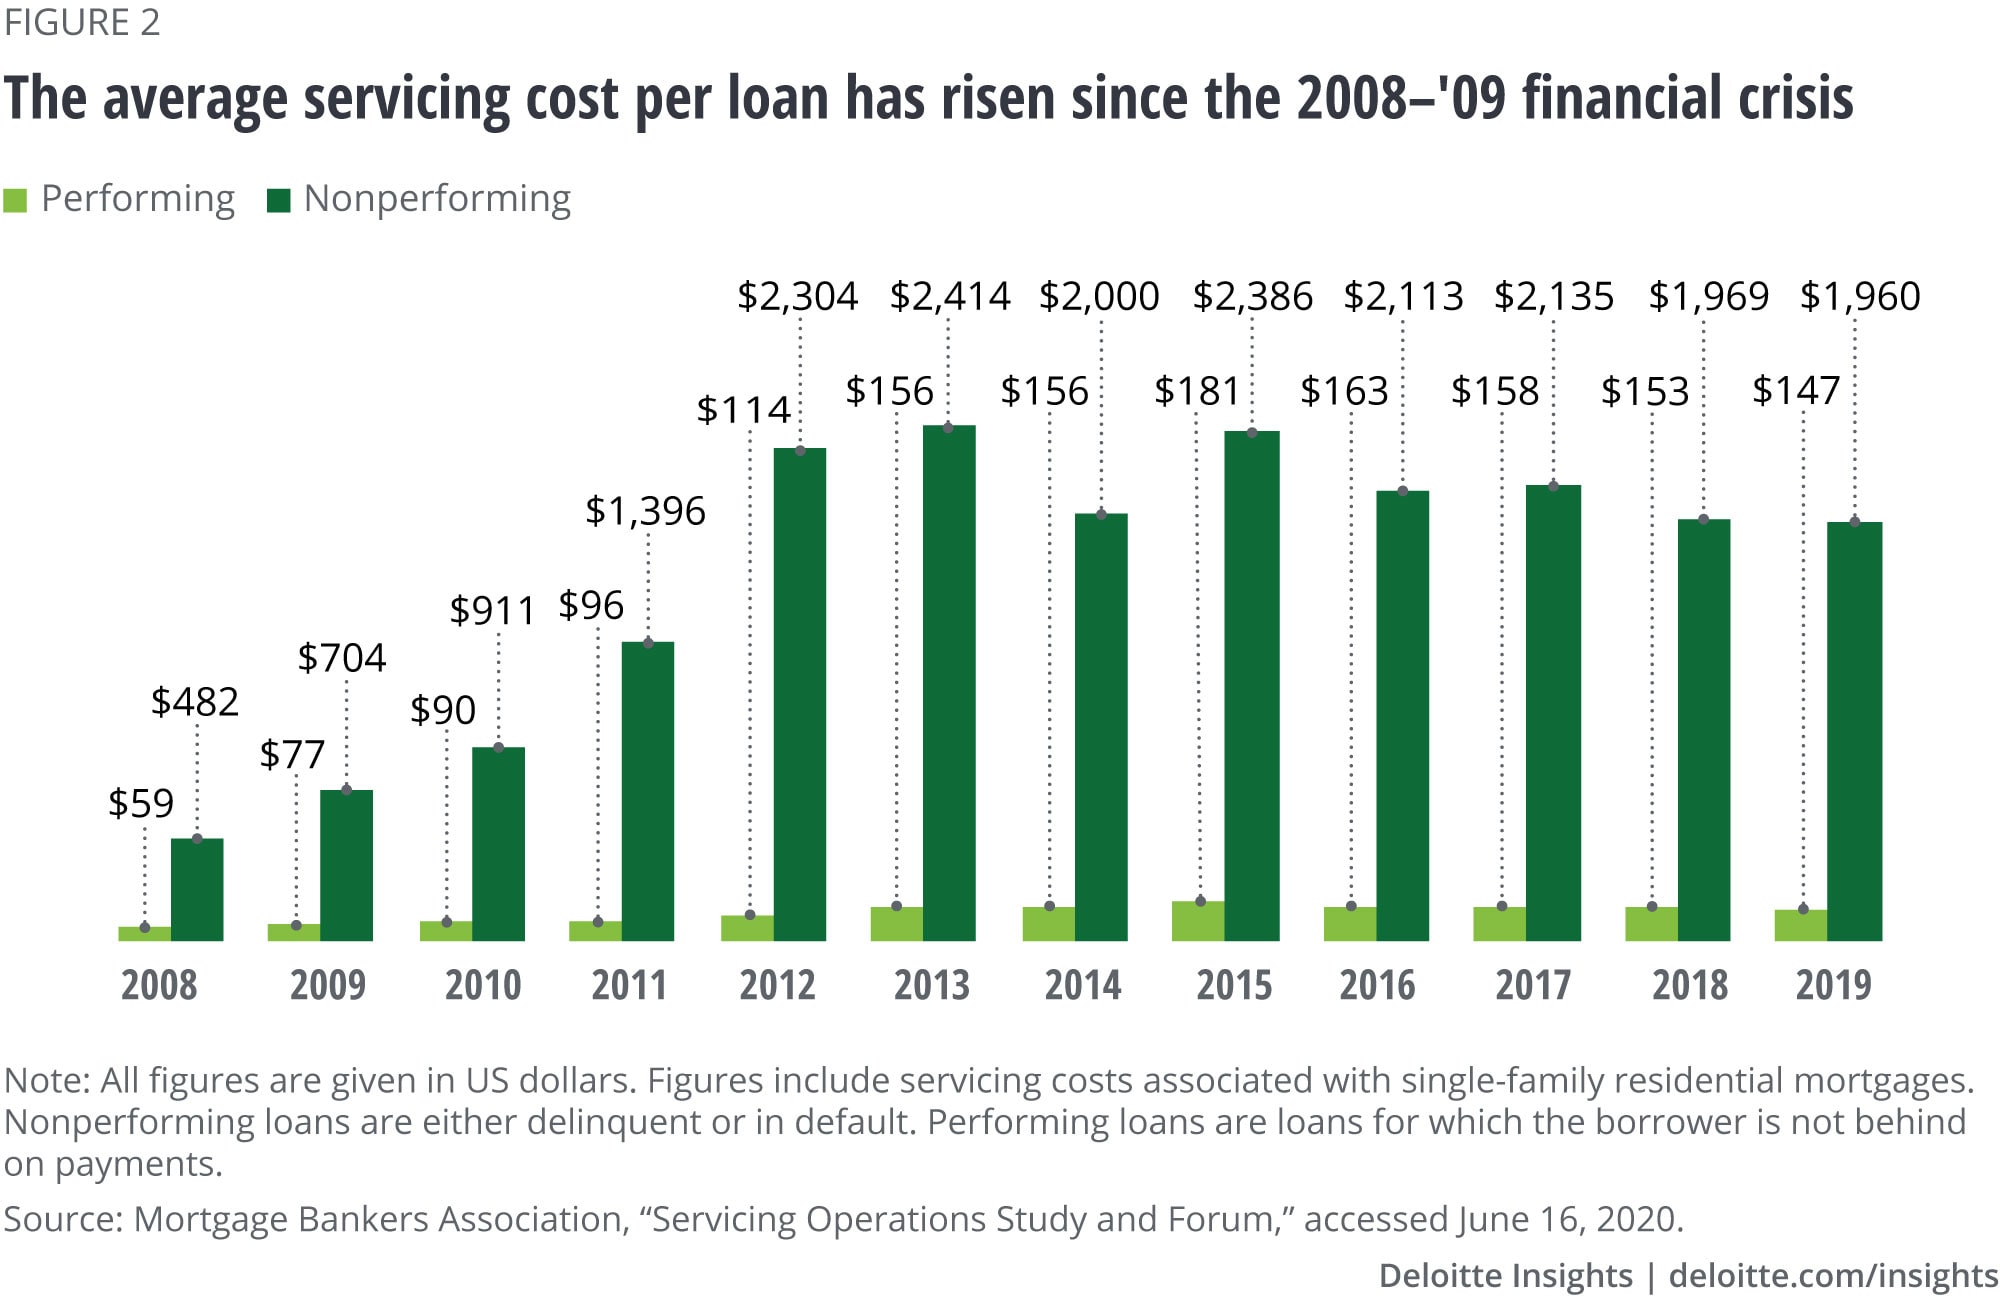
Collectively, these challenges will likely crimp servicers’ profitability. Fronting mortgage payments, bolstering capacity for forbearances and loan modifications, and managing delinquencies and/or defaults would add to the cost of servicing, which has already risen significantly since the last financial crisis (figure 2).
Think long-term, but take actions in the short term
These are trying times for mortgage servicers, but the issues are not completely new. Here are some important lessons from the 2008–09 financial crisis that could help servicers recover and eventually thrive:
Be more proactive
- Anticipate needs, then communicate and empathetically offer clear advice to distressed customers.
- Focus on identifying stress early to allow sufficient time to develop and put effective solutions in place.
- Actively engage with warehouse lenders and government agencies to manage liquidity constraints.
Example: Quicken Loans is actively focusing on educating its customers about their available options, including forbearance, loan modification, and refinancing, as they think about mortgage payments.15
Be more agile
- Adopt an iterative approach to continuously enhance processes put in place to improve efficiency and reduce risk.
- Focus on transferrable skills and cross-train employees to quickly scale operations in functions that need immediate attention.
- Engage third parties, wherever possible, to manage the flow of operations, especially staffing requirements.
- Ensure new, complex program guidelines and requirements, such as those of the CARES Act and GSEs, are fully and properly addressed. This can help firms manage operational risks and continue to adhere to applicable regulatory requirements and evolving supervisory guidance.
Example: JPMorgan cross-trained and relocated employees, so they could handle an expected influx of mortgage refinance applications.16
Be more digital
- Utilize data-driven models to identify which borrowers are most likely to face financial difficulties beyond the deferral period. Provide them with tailored loan modification solutions.
- Rapidly deploy digital/cloud-based servicing technology solutions to drive customer engagement, document workflows, and provide key integrations to current technologies to better serve customers.
- Enhance analytical and reporting capabilities to ensure all mitigation actions proactively offered to borrowers comply with the evolving set of federal, state, and local regulations.
Example: The Consumer Financial Protection Bureau, in a bid to help mortgage service providers during the pandemic, issued a “No-Action Letter Template,” that has already been incorporated into end-to-end digital platforms that automates default servicing management workflows and processes.17
Forecasting methodology
To forecast the impact of the COVID-19 pandemic on mortgage delinquencies from 2020 to 2024, our research team at the Deloitte Center for Financial Services studied the statistical relationships among national unemployment rate, the homeowners’ unemployment rate, and the 30-day and 90-day delinquency rates for the past 17 years.
Our insights can help you take advantage of change. If you’re looking for fresh ideas to address your challenges, we should talk. View our services page.
Contacts
Greg Klebes |
Gina Primeaux |
Val Srinivas, PhD |
View sector performances
Impact on workers' compensation
Since workers’ compensation insurance premiums are largely driven by insurable exposures—that is, how many people are employed—our analysis indicates that millions of layoffs and furloughs during the COVID-19 outbreak could prompt a drop in volume of nearly 20% in the second quarter of 2020, followed by a smaller decline in the second half that may extend into early 2021. Indeed, premiums written may not return to pre-pandemic levels until 2023.
In the first month after the COVID-19 outbreak, the US unemployment rate more than tripled, from 4.4% in March to 14.7% in April, which is the highest level since the Great Depression.18 And while that figure fell a bit in May, to 13.3%, this may have been due to data collection and reporting issues, which means May’s unemployment figure was likely to have actually risen to around 16%.19 In any case, there are tens of millions fewer workers for insurers to cover.
In addition, even if the virus recedes sooner rather than later, it is unclear how quickly employment will pick back up to pre-pandemic levels. The US and global economies are beginning a slow recovery while businesses continue to adapt to the outbreak’s long-term impact. Meanwhile, workers’ comp pricing is expected to remain competitive.20
Working with our actuarial team, we created a model to forecast workers’ comp net written premiums for 2020, 2021, and 2022. Our model projected three scenarios based on the potential speed of recovery from COVID-19: baseline, no end in sight, and fast bounce back (see sidebar, “Forecast methodology”).
The bottom line: Forecast findings
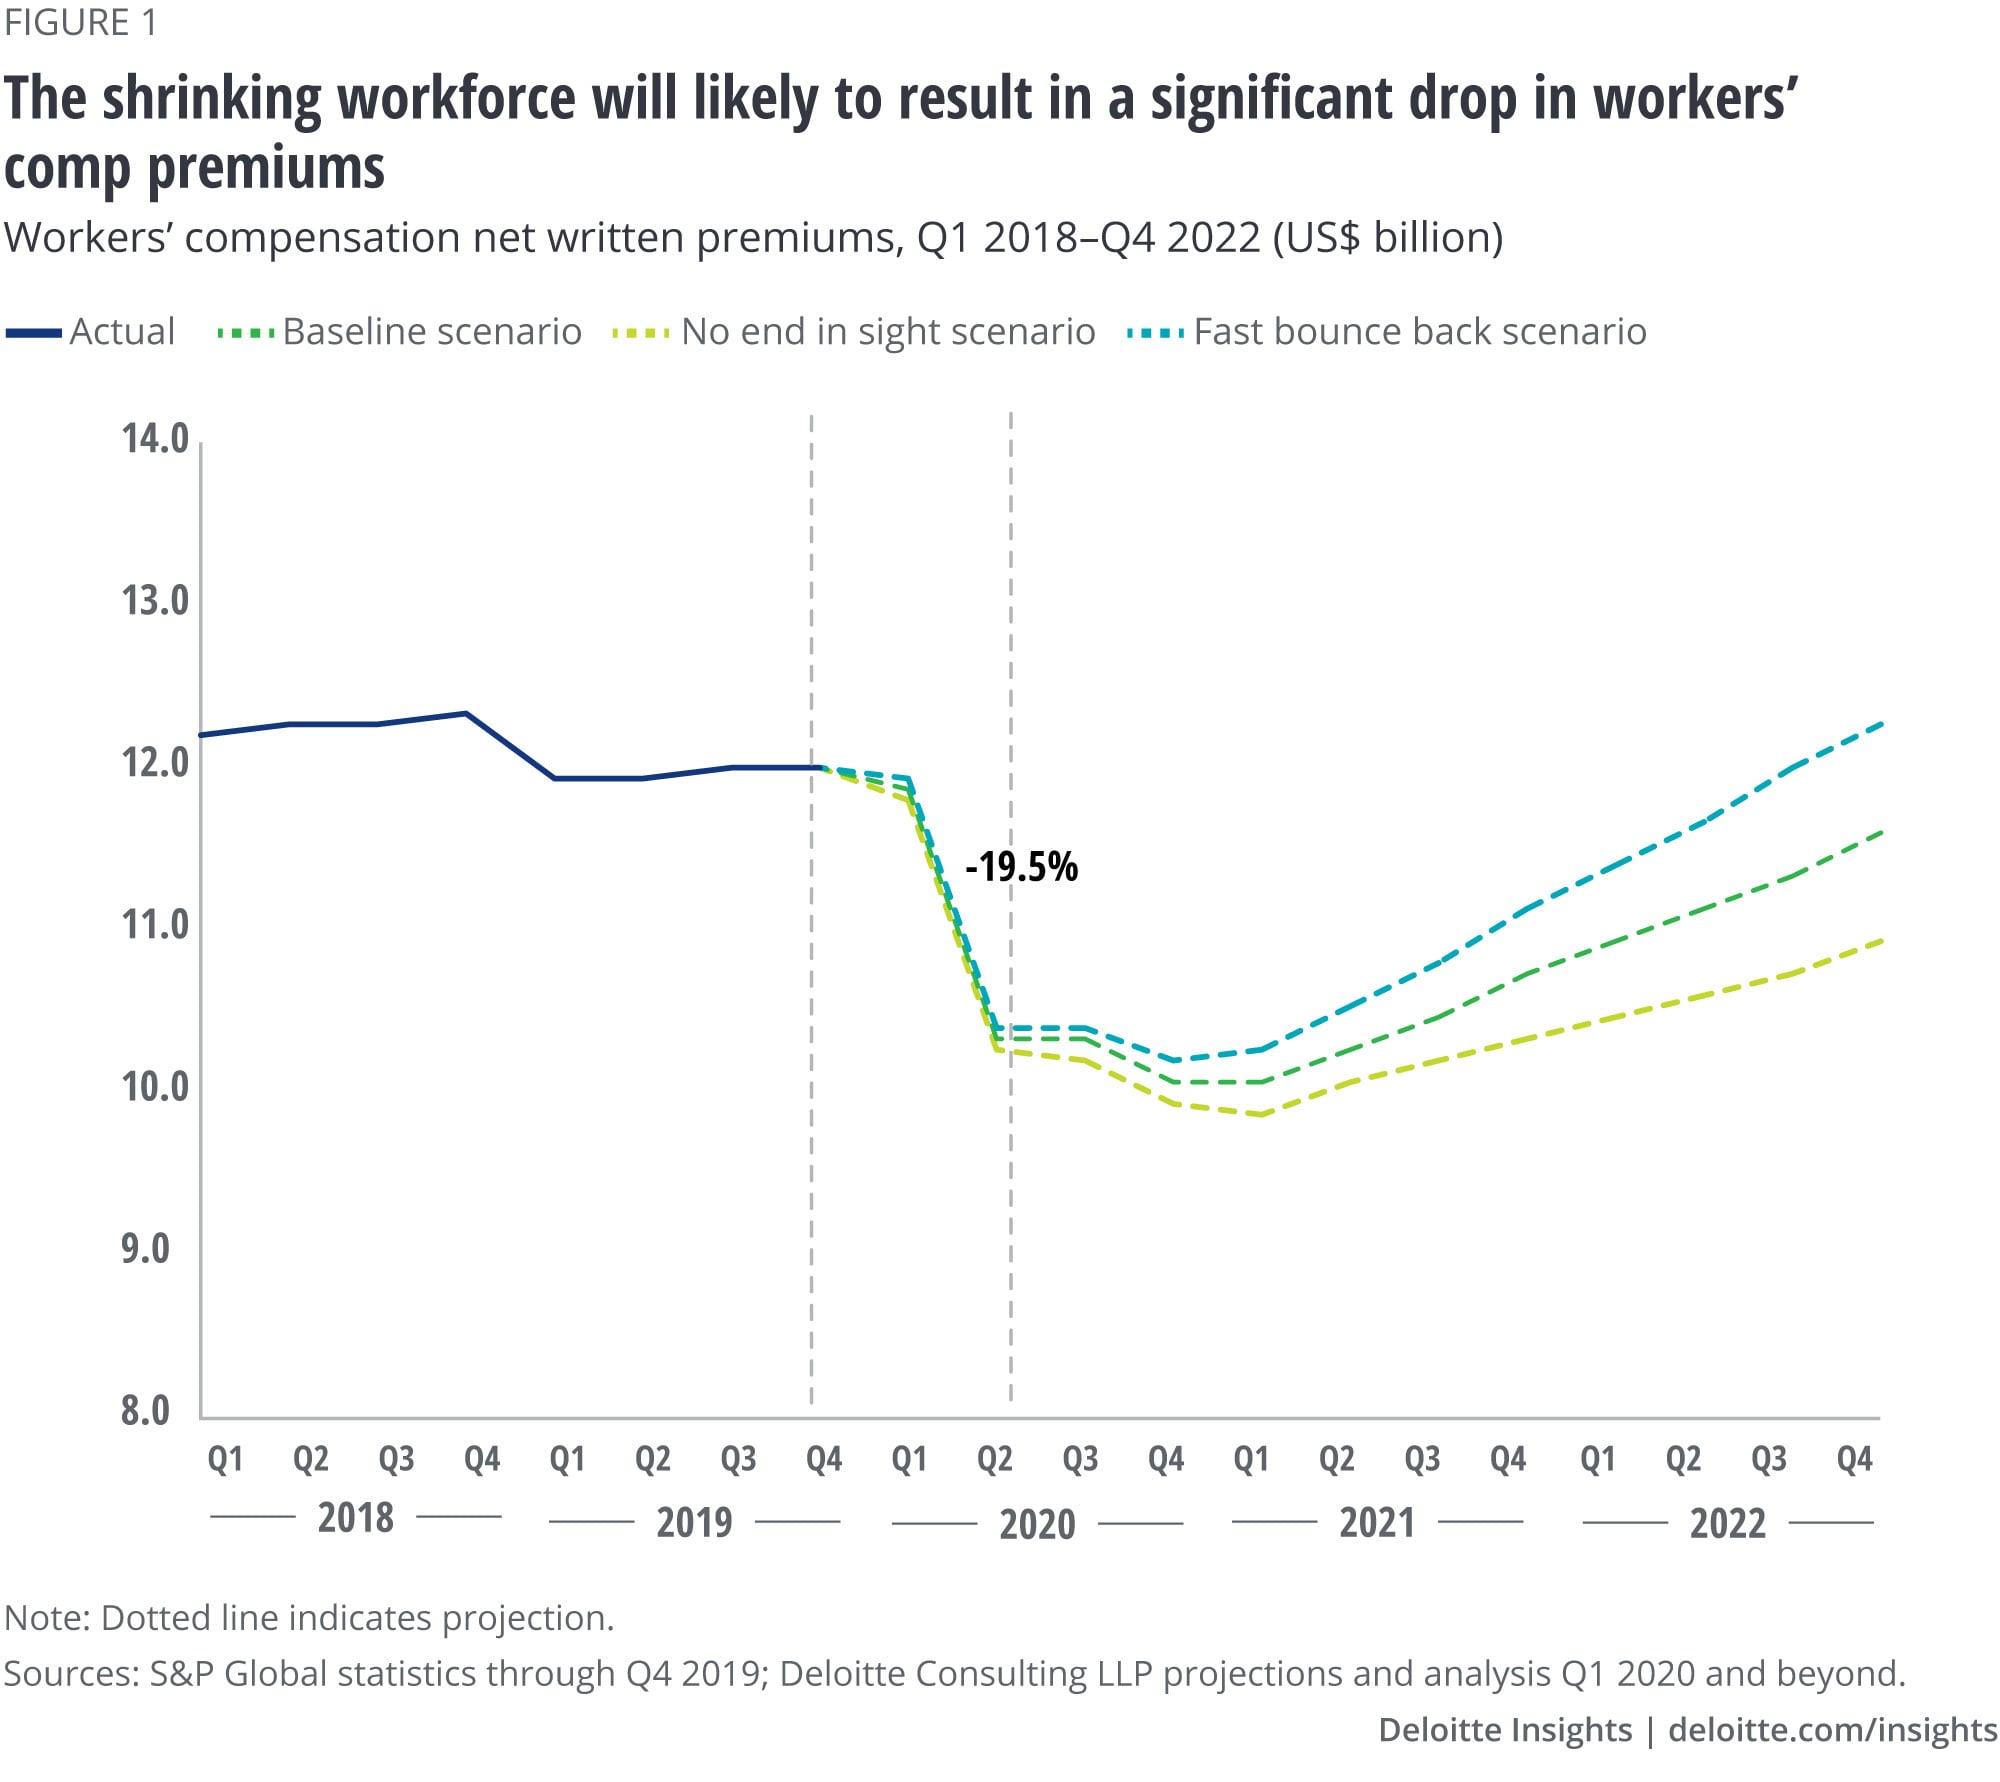
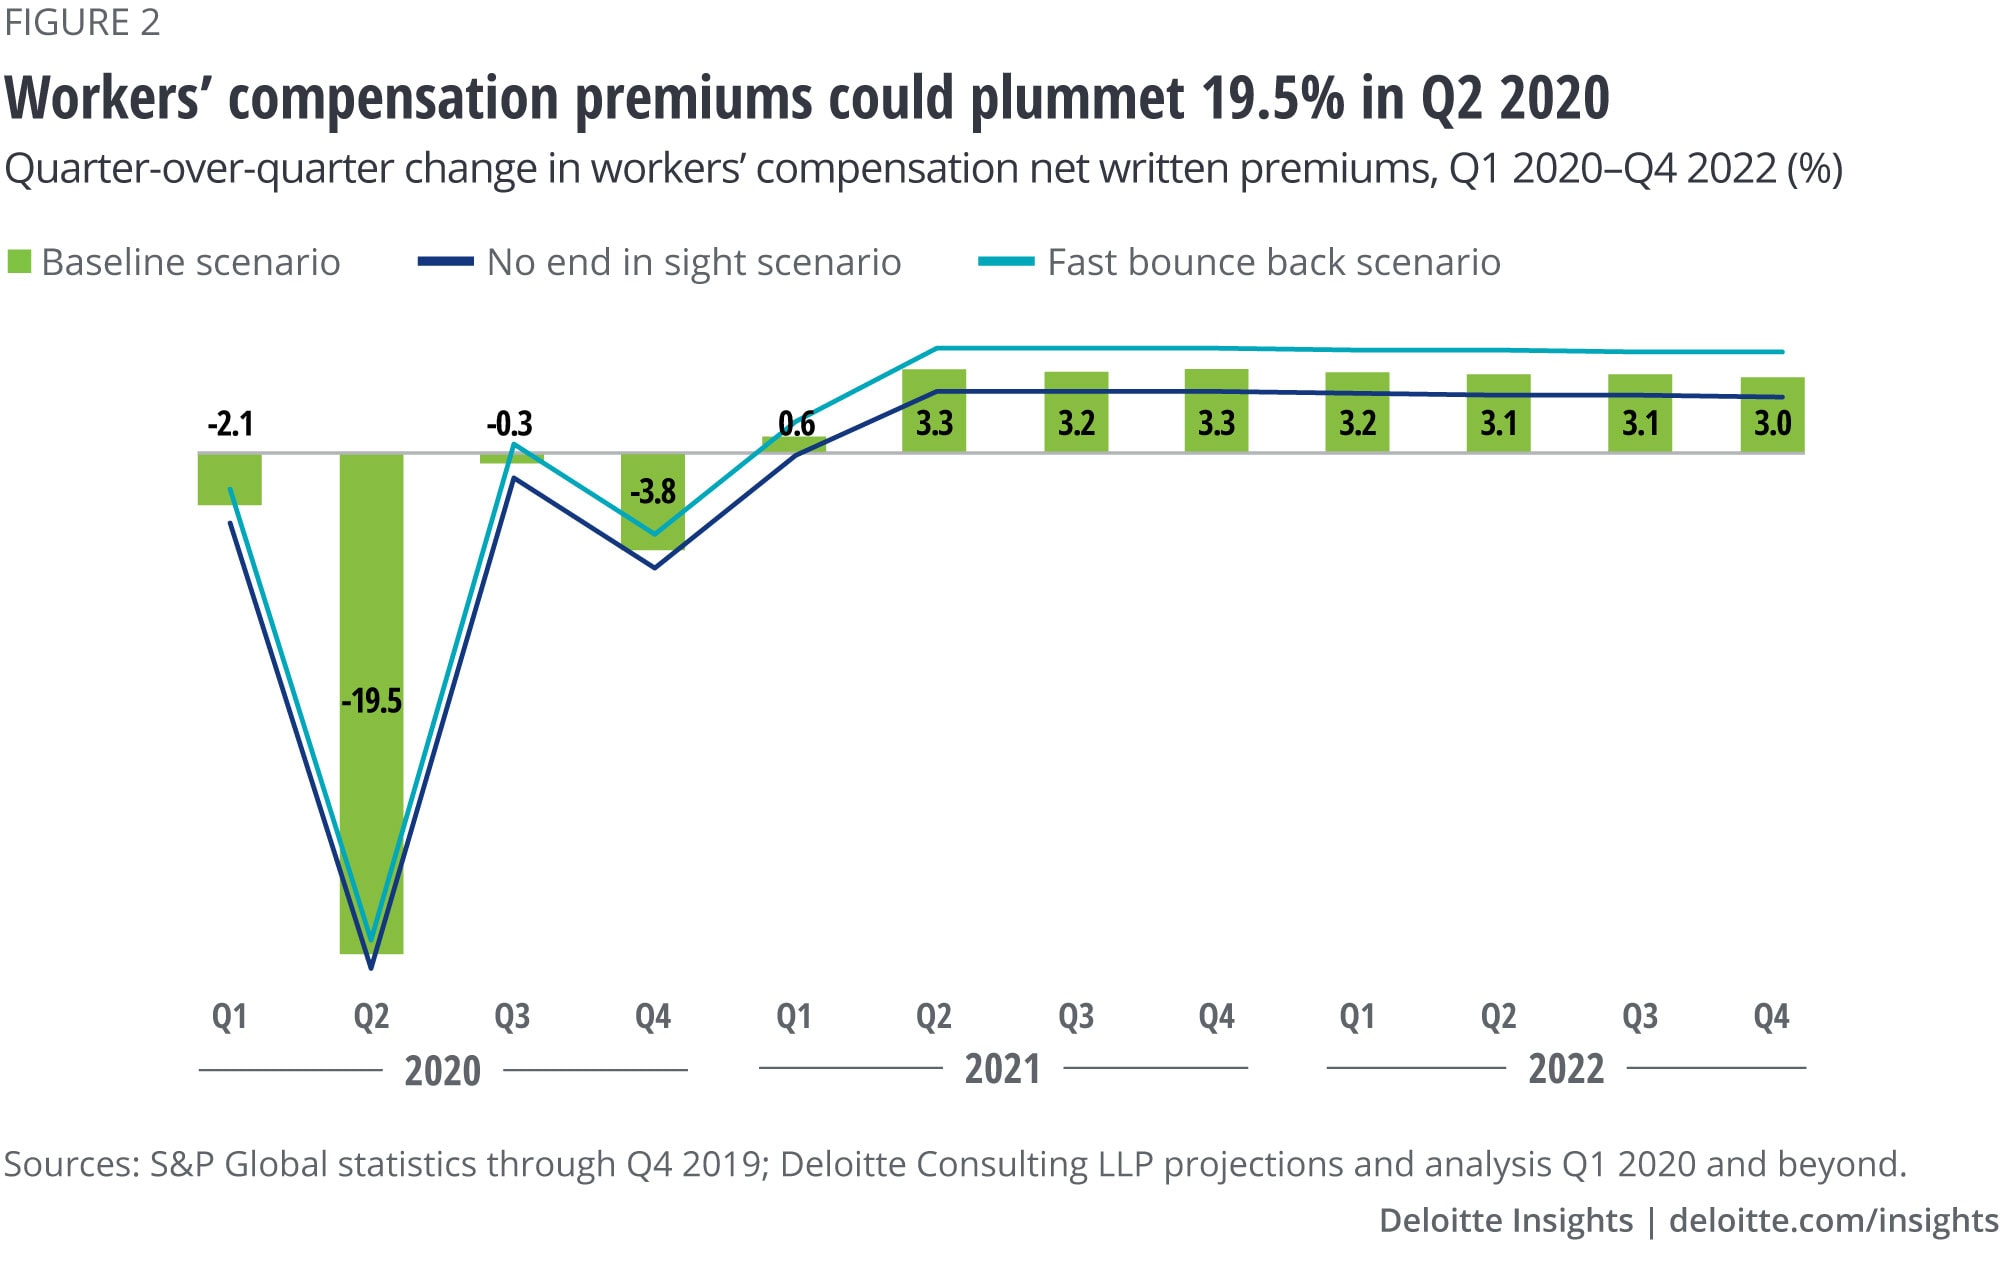
In the baseline scenario, workers’ comp premium volume could drop by 19.5% quarter on quarter (QoQ) in Q2 2020 and by a further 4.1% cumulatively in Q3 and Q4 2020, before bottoming out in the first quarter of 2021. Our analysis suggests that premiums may not return to pre-COVID levels until after our extended forecast period of Q4 2022 (figures 1 and 2). This is a significant fall compared to the 4% average annual growth rate of workers’ comp premiums over the past 10 years (2010 to 2019).21
If recovery is slower than this baseline (our no end in sight scenario), premium volume could drop by 20.1% QoQ in Q2 2020, and by a further 5.5% cumulatively in Q3 and Q4 2020. On the other hand, if the economy stages a fast bounce back, then the drop in premium volume may be 19% QoQ in Q2 2020 and a further 2.9% in Q3 and Q4 2020, cumulatively.
In all three scenarios, however, premium volume is not expected to return to pre-COVID levels before Q4 2022. This means that workers’ comp insurers may have to prepare themselves for an extended period of recovery.
Note: Carriers are required to file net written premiums on an annual basis only and not quarterly. Quarters can have higher or lower net written premiums based on when policies are bound. For the purposes of this analysis, Deloitte assumed equal net written premiums across four quarters for all projected years.
There are additional mitigating circumstances to consider when analyzing the outlook for workers’ comp on a more granular level. For example, the impact of a smaller workforce on premium volume could be exaggerated by the fact that industries such as construction, contracting, and transportation, which generate relatively higher median workers’ comp premiums, saw significant job losses.22
In addition, the National Council on Compensation Insurance has submitted an expedited rule change request to address the question of how to account for employees who are being paid but not working, to be classified under “idle time.” If approved, these payroll payments would not be used in the calculation of workers’ comp premium charges, which could further depress volume in the coming few quarters.23
In the meantime, insurers should expect a mixed bag for workers’ comp claims, with varying impacts across industries. However, uncertainty around claims in general could linger as regulatory and legal frameworks evolve and potentially push losses higher. Insurers should also prepare for a decrease in claim file closure rates and higher operational costs because COVID-related claims will likely remain open longer than the average.
Calls to action for workers’ comp insurers
Here are some actions insurance carriers can take now to help mitigate risk, protect their brands, and respond to market shifts:
- Practice prudence in underwriting. Carriers should look to shore up their risk-selection standards and pricing models. Underwriting profitability could be paramount to remain viable, particularly in this low interest rate environment, when investment income is likely to be impacted as well.
- Align to the “new normal.” Remote working will likely increase and remain in place for substantial numbers of covered employees. Insurers should be flexible and adapt their policies (and their own workforce and operations) quickly to changing work environments.
- Accelerate claims efficiency. With expense control becoming even more important, insurers should accelerate efforts to arm their claims departments with state-of-the-art technology tools. Artificial intelligence and advanced analytics, for example, can help insurers improve the speed, efficiency, and accuracy of underwriting as well as claims management decisions.24
- Manage reputational risk. Carriers should also focus on managing potential reputational risks in the midst of the pandemic by continuing to demonstrate social responsibility and empathy for clients, claimants, and society at large. This may include using analytics to better anticipate client needs, providing positive experiences in managing claims, and remaining flexible with coverages and payment plans.25
Forecast methodology
The Deloitte Center for Financial Services joined with the actuarial practice of Deloitte Consulting LLP to forecast the potential impact of the COVID-19 pandemic and the ensuing economic slowdown on net written premiums of key property-casualty lines. We studied several macroeconomic and line-specific parameters over the past 25 years to determine their impact on the premium volume of different lines of business during various economic cycles.
For worker’s comp, we established a relationship between premiums and the number of employees in the workforce. Based on an analysis of net written premiums in past boom and downturn cycles, Deloitte’s actuarial team derived pre-event and post-event quarterly multipliers for average net premiums written per headcount for three scenarios: baseline, no end in sight, and fast bounce back. These multipliers were then applied to employment projections from the Deloitte economics team26 to project quarterly workers’ comp premiums for 12 quarters, starting from Q1 2020 through Q4 2022.
The current situation is fluid, and these projections are based on information known as of June 11, 2020. As the world continues to combat and adapt to the effects of COVID-19, the impact on workers’ comp will evolve.
Our insights can help you take advantage of change. If you’re looking for fresh ideas to address your challenges, we should talk. View our services page.
Contacts
Matt Carrier |
Jim Arns |
Sam Friedman |
View sector performances
Impact on homeowners’ insurance premiums
While the COVID-19 outbreak and the ensuing economic slowdown may have kept tens of millions in their houses for months either working, sheltering, or both, our analysis indicates that homeowners’ insurance will likely be one of the few lines that may not see any substantial long-term negative impact on premiums due to the pandemic.
This is partly due to the fact that insurable exposures should remain stable despite the pandemic—more so than with workers’ compensation, for example, which saw millions of insurable jobs lost due to layoffs and furloughs. Indeed, the total stock of houses—the bulk of insurable US homeowners’ exposures—will likely remain stable to positive over the next two to three years, at around 141.5 million homes.27
That isn’t to suggest that the US homeowners’ market may be completely immune to prevailing economic conditions. New single-family home sales are expected to drop by 38%, to 0.42 million, while construction of new homes is projected to decline by 29%, to 0.92 million in 2020.28 Still, our analysis of US homeowners’ premiums during previous downturns reveals that while growth tended to drop to a trickle, it did not turn negative.
Working with our actuarial team, we created a model to forecast net written premiums for homeowners’ insurance for 2020, 2021, and 2022. Our model projected premiums for three scenarios based on the potential speed of recovery from COVID-19—baseline, no end in sight, and fast bounce back. (See sidebar, “Forecast methodology.”)
The bottom line: Forecast findings
In the baseline scenario, we forecast homeowners’ net written premiums to likely remain close to flat, with a quarterly growth rate of 0.4% in 2020. This is likely to be followed by a small yet steady uptick in quarterly growth of 1.2% in 2021 and 2022, driven by an increase in rates and insurable exposures (figures 1 and 2).
However, if the recovery is slower than this baseline (our no end in sight scenario), premium growth could flatten even further, rising by no more than 0.2% quarter on quarter (QoQ) in 2020, followed by a quarterly growth rate of 0.7% in 2021 and 2022. On the other hand, if the economy stages a fast bounce back, the quarterly rise in 2020 could be 0.5%, followed by a quarterly increase of 1.7% in 2021 and 2022.
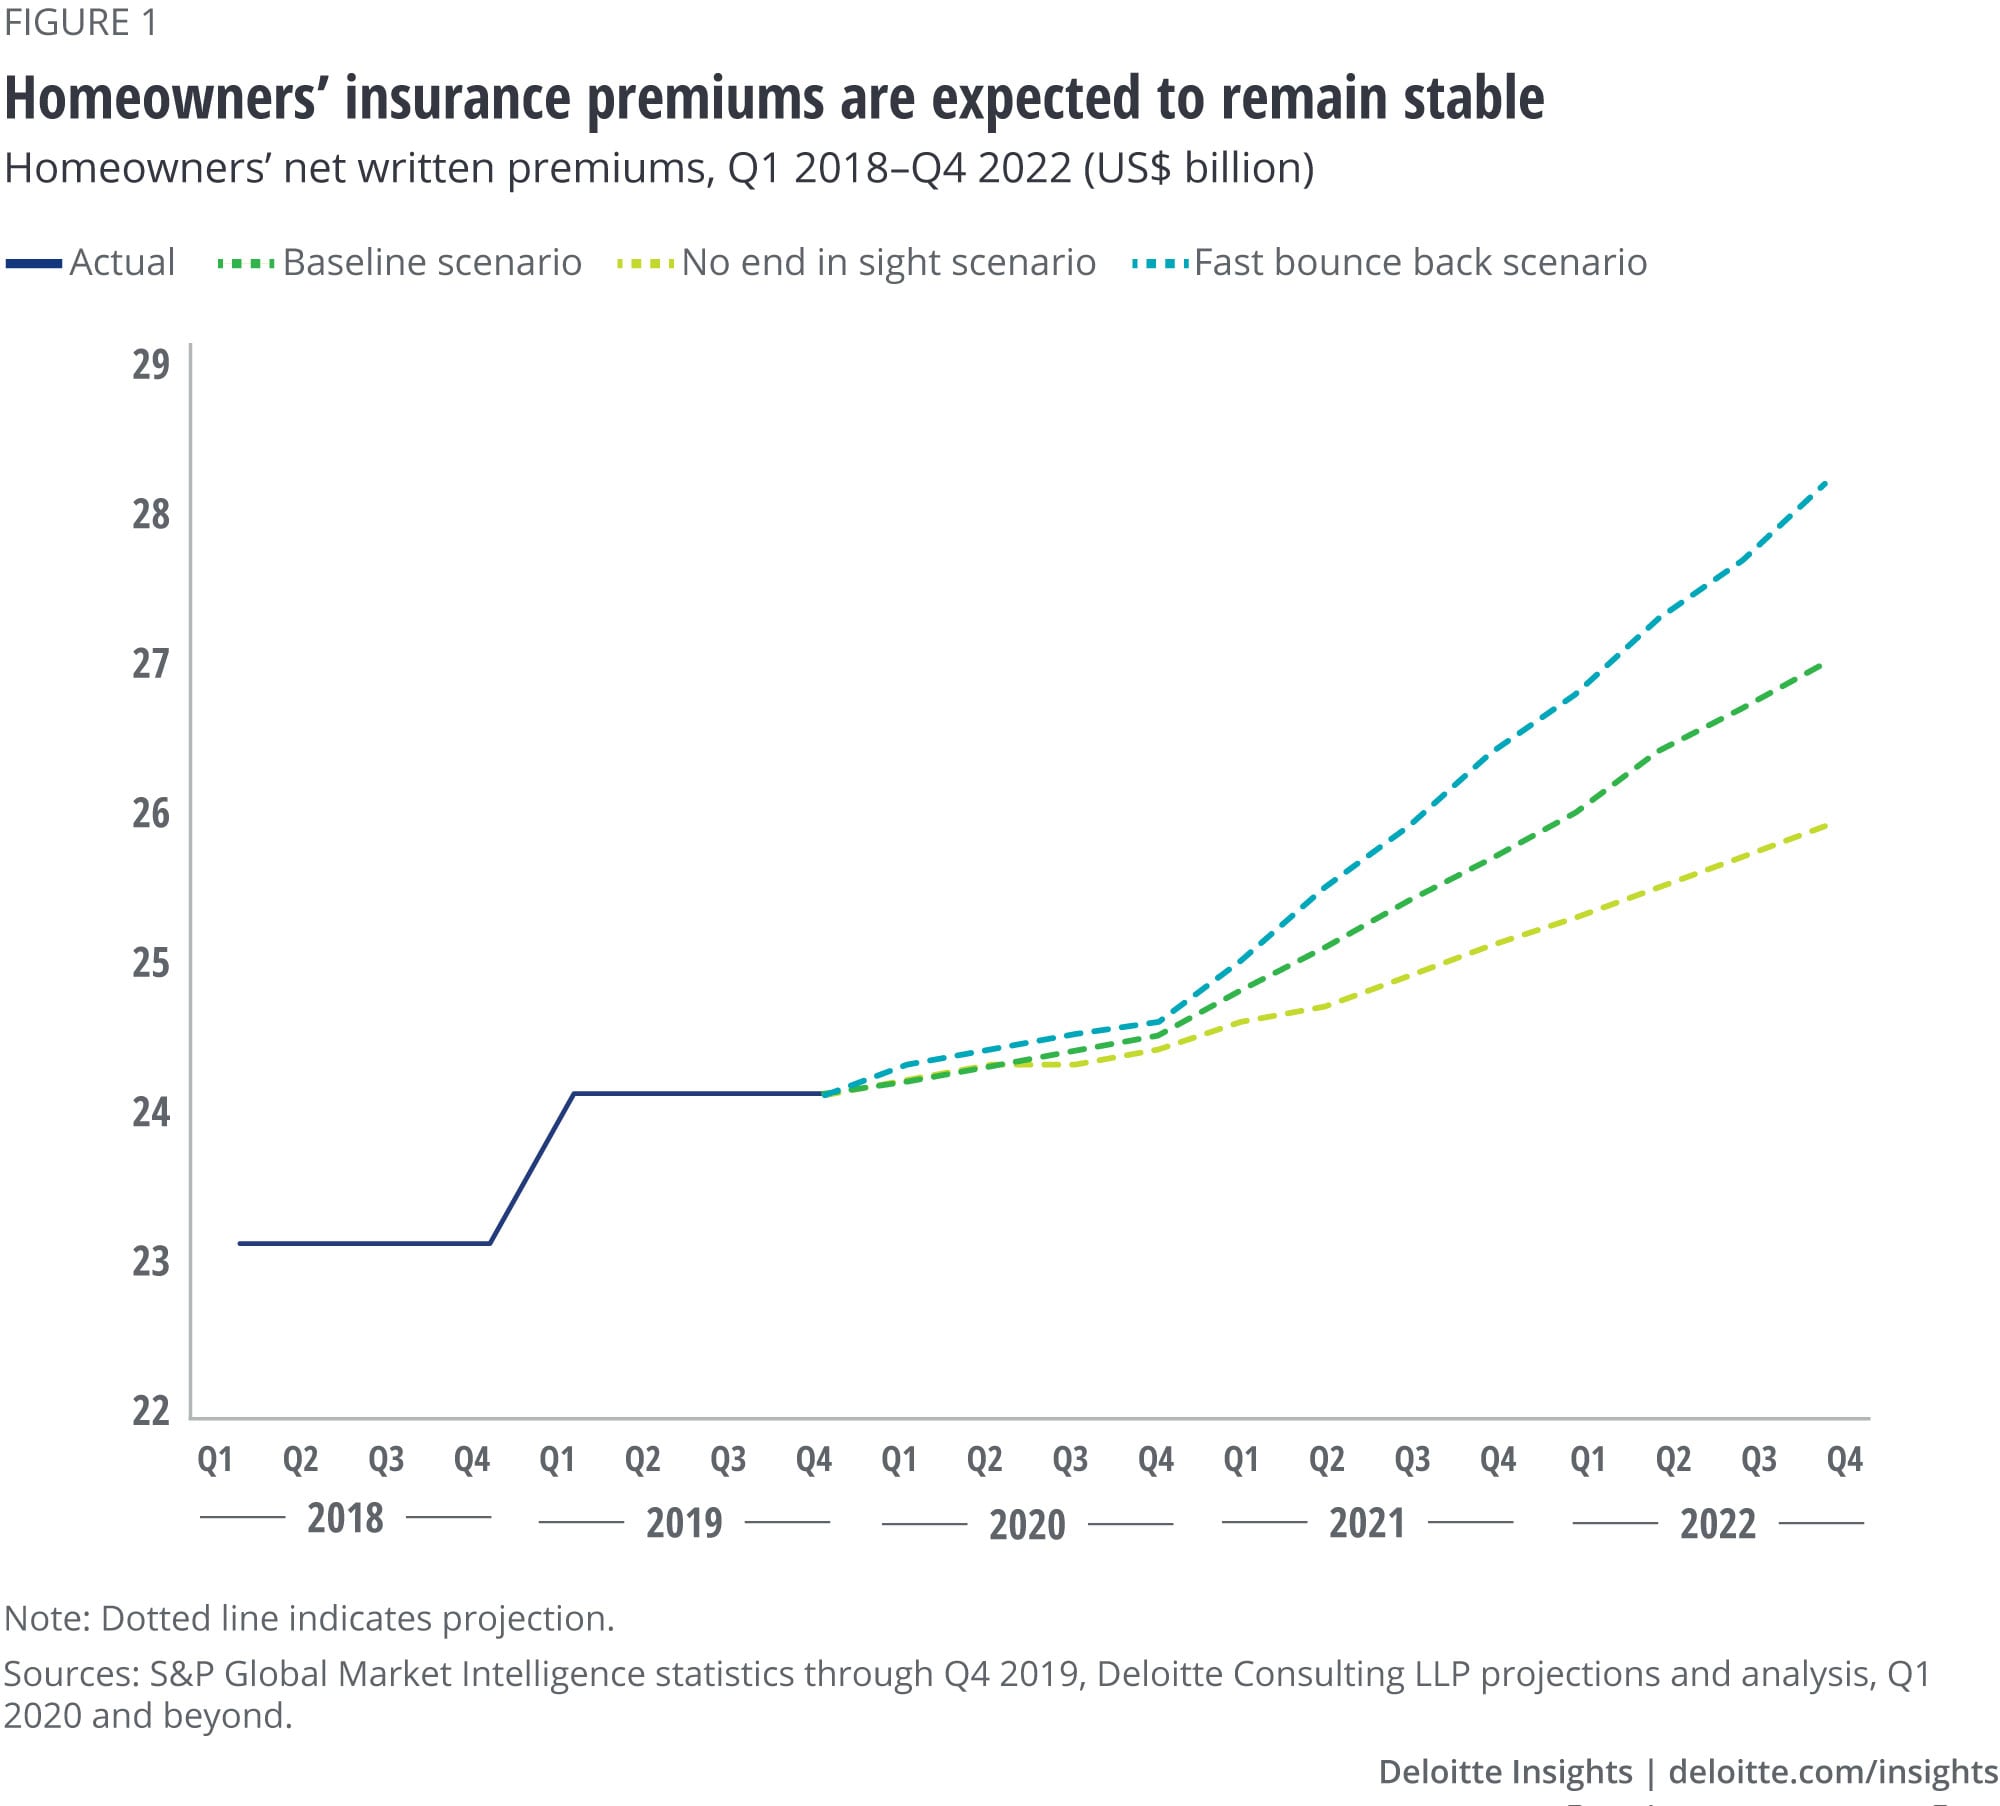
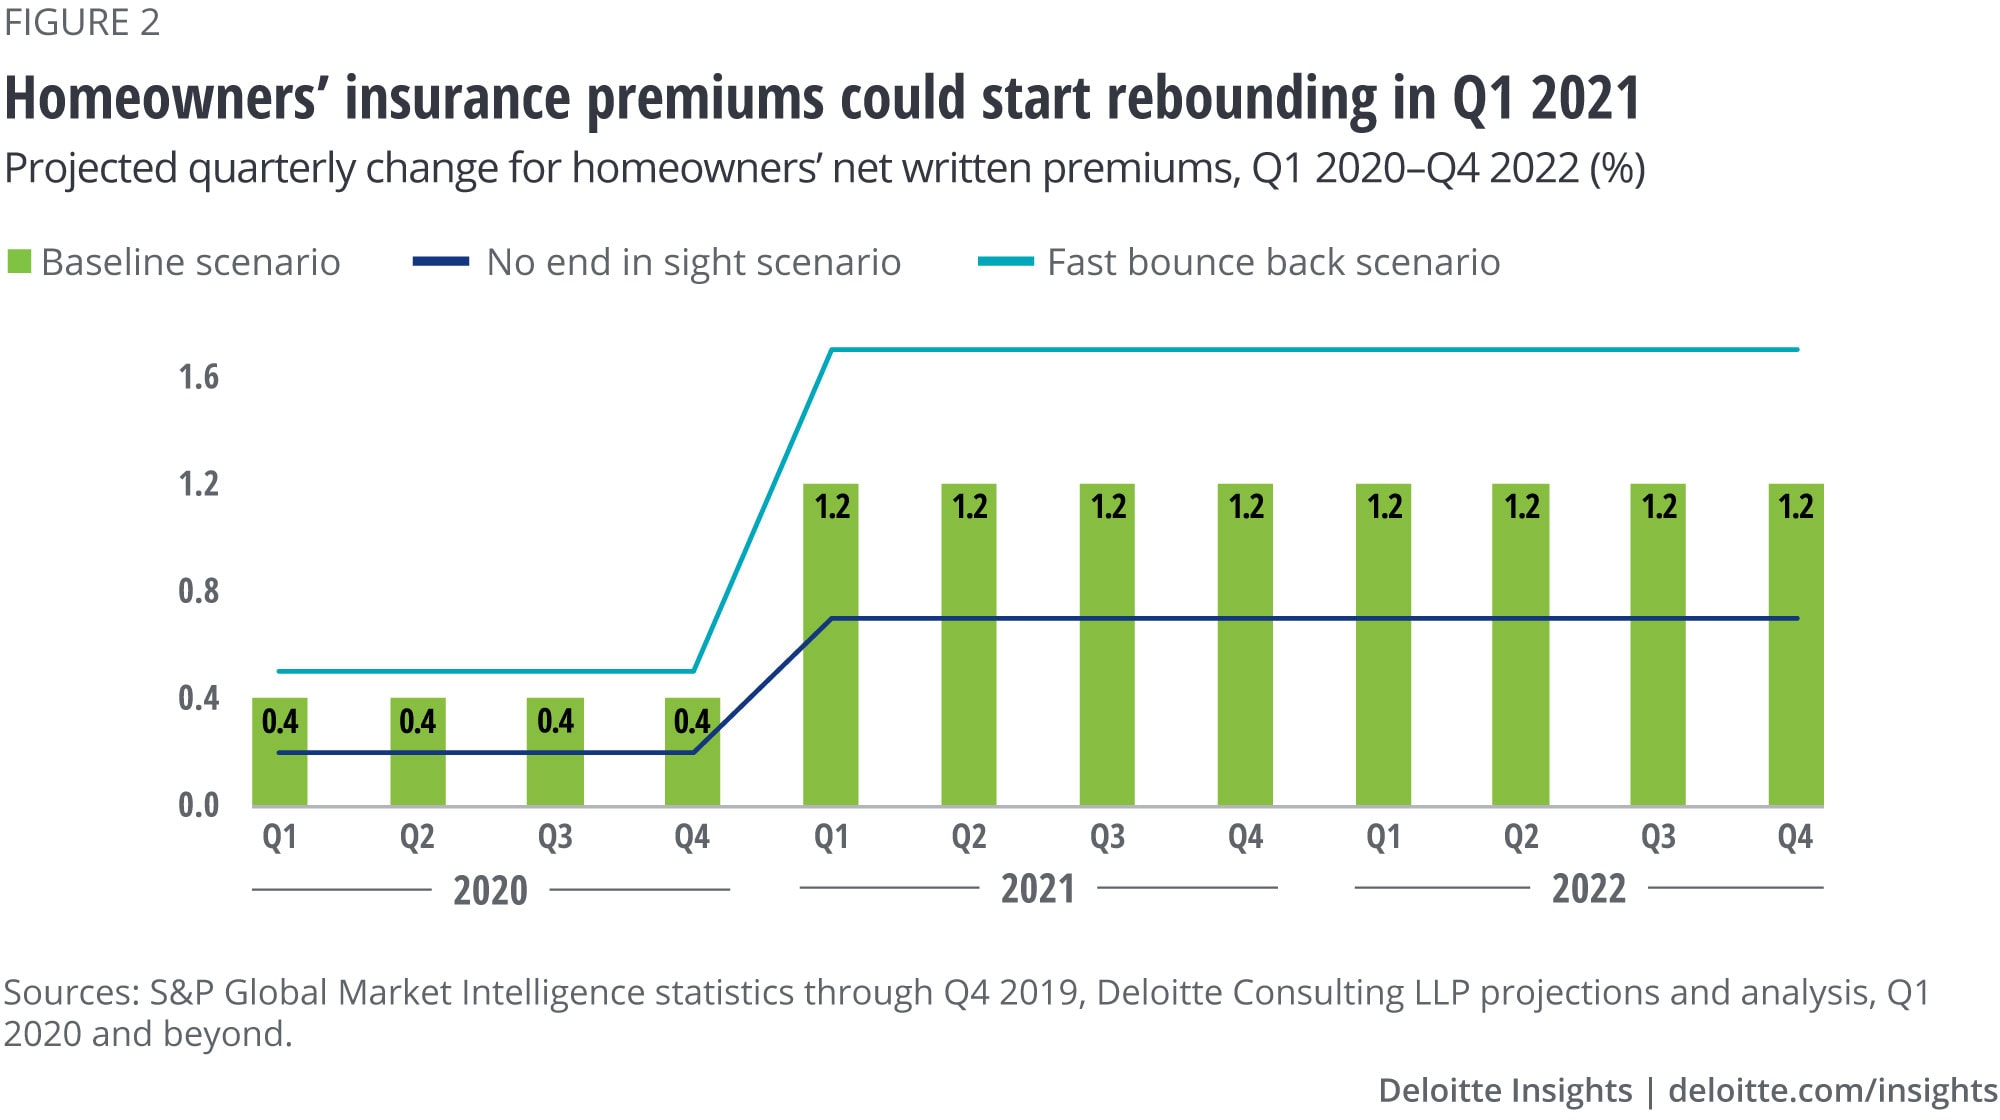
Note: Carriers are required to file net written premiums on an annual basis only and not quarterly. For the purpose of this analysis, Deloitte assumed equal net written premiums across four quarters for all projected years. Quarters can have higher or lower net written premiums based on when policies are bound.
Beyond the pandemic’s potential top-line effect on premium growth, homeowners’ insurers may face additional bottom-line concerns stemming from the outbreak. Since many people are suffering financial hardships due to layoffs, furloughs, or small business closings, many homeowners’ carriers are offering extended payment plans to existing and potential policyholders that could delay premium income hitting the books.
There are potential claims implications as well. With millions stuck at home to prevent a spread of the virus, burglaries and other damaging incidents that often occur while occupants are absent may be prevented or more quickly mitigated.29 And while more people are working from home during the outbreak—many of whom may keep doing so either by their own choice or at the request of their employers—new risks could arise with all of the additional home-based activities. However, homeowners’ policy exposure may be limited or offset by workers’ compensation coverage if any injuries or damage are job-related.
Calls to action for homeowners’ insurers
Here are some actions insurance carriers can take now to help mitigate risk, protect their brands, and respond to market shifts:
- Enhance digital capabilities. In a world adjusting to the coronavirus, insurers should continue to emphasize social distancing and help their personnel avoid face-to-face interactions with policyholders wherever possible. They can advance remote capabilities by accelerating the development of remote sales, inspections, and claims adjusting. For example, insurers could increase drone usage for damage assessments.
- Leverage data analytics. The economic damage caused by the pandemic, particularly in long-term unemployment, could lead to increased insurance fraud. Insurers should therefore consider investing in more advanced data analytics to better identify and weed out potentially fraudulent or inflated claims.
- Manage reputational risk. Carriers should also focus on managing potential reputational risks in the midst of the pandemic by continuing to demonstrate social responsibility and empathy for clients, claimants, and society at large. This may include using analytics to better anticipate client needs, providing more positive experiences when managing claims, and remaining flexible with coverages and payment plans.30
Forecast methodology
The Deloitte Center for Financial Services joined with the actuarial practice of Deloitte Consulting LLP to forecast the impact of the COVID-19 pandemic and the ensuing economic slowdown on premiums of key property-casualty lines.
For homeowners, we studied the change in net premiums written in past boom and downturn cycles. Coupled with GDP projections from the Deloitte economics team,31 we projected quarterly homeowners’ insurance premiums for the next 12 quarters, starting from Q1 2020 through Q4 2022, under three different scenarios—baseline, no end in sight, and fast bounce back.
The current situation is fluid and these projections are based on information known as of June 16, 2020. As the world continues to combat COVID-19, the impact on homeowners’ insurers will continue to evolve.
Our insights can help you take advantage of change. If you’re looking for fresh ideas to address your challenges, we should talk. View our services page.
Contacts
Matt Carrier |
Jim Arns |
Sam Friedman |
View sector performances
Impact on office property owners and operators
As COVID-19 reached pandemic status in the first quarter of 2020, millions of people around the world had to quickly alter the way they lived and worked. In the United States, most corporations moved to a remote work environment; most offices were effectively shuttered.
Now, a few months later, given the speed and scope of the pandemic, companies sorting through their reentry strategies continue to face uncertainty . Through May 2020, our live tracking of return-to-work plans of US corporations revealed that many companies that announced remote work plans do not plan to have all of their people return to the office within the next six months. Coworking companies, meanwhile, have experienced immediate negative rental impacts as some of their primary sources of income comes from freelancers, startups, and small businesses, which were adversely affected by the government-led economic shutdowns.32
While it is unclear which tenant office design and use models will emerge, tenant needs and expectations will likely continue to evolve. As they manage through these uncertain times, office owners and operators should focus on managing costs and liquidity along with tenant preservation in the short-to-medium term. The next few months could be turbulent and will likely require a different level of engagement, agility, and flexibility between the landlord and the tenant, to effectively manage through the short term and get to the “next normal.”
Lower space demand and increased costs could affect margins
Historically, higher unemployment levels tend to have a negative impact on office space demand. In the current environment, tenants’ extended remote work plans and the new supply of nearly 134 million square feet (SF) will likely affect space demand and rental rates through 2021.33 As companies evaluate the right balance of in-office and remote work and the cost of redesigning office spaces to meet social distancing mandates, they may choose to delay long-term leasing decisions.
At the same time, property management costs will likely rise due to increased health and safety measures. Our models indicate incremental operating costs could increase by at least US$19.4 per SF or 5.8% of average annual office rents at the beginning of 2020 (figure 1).
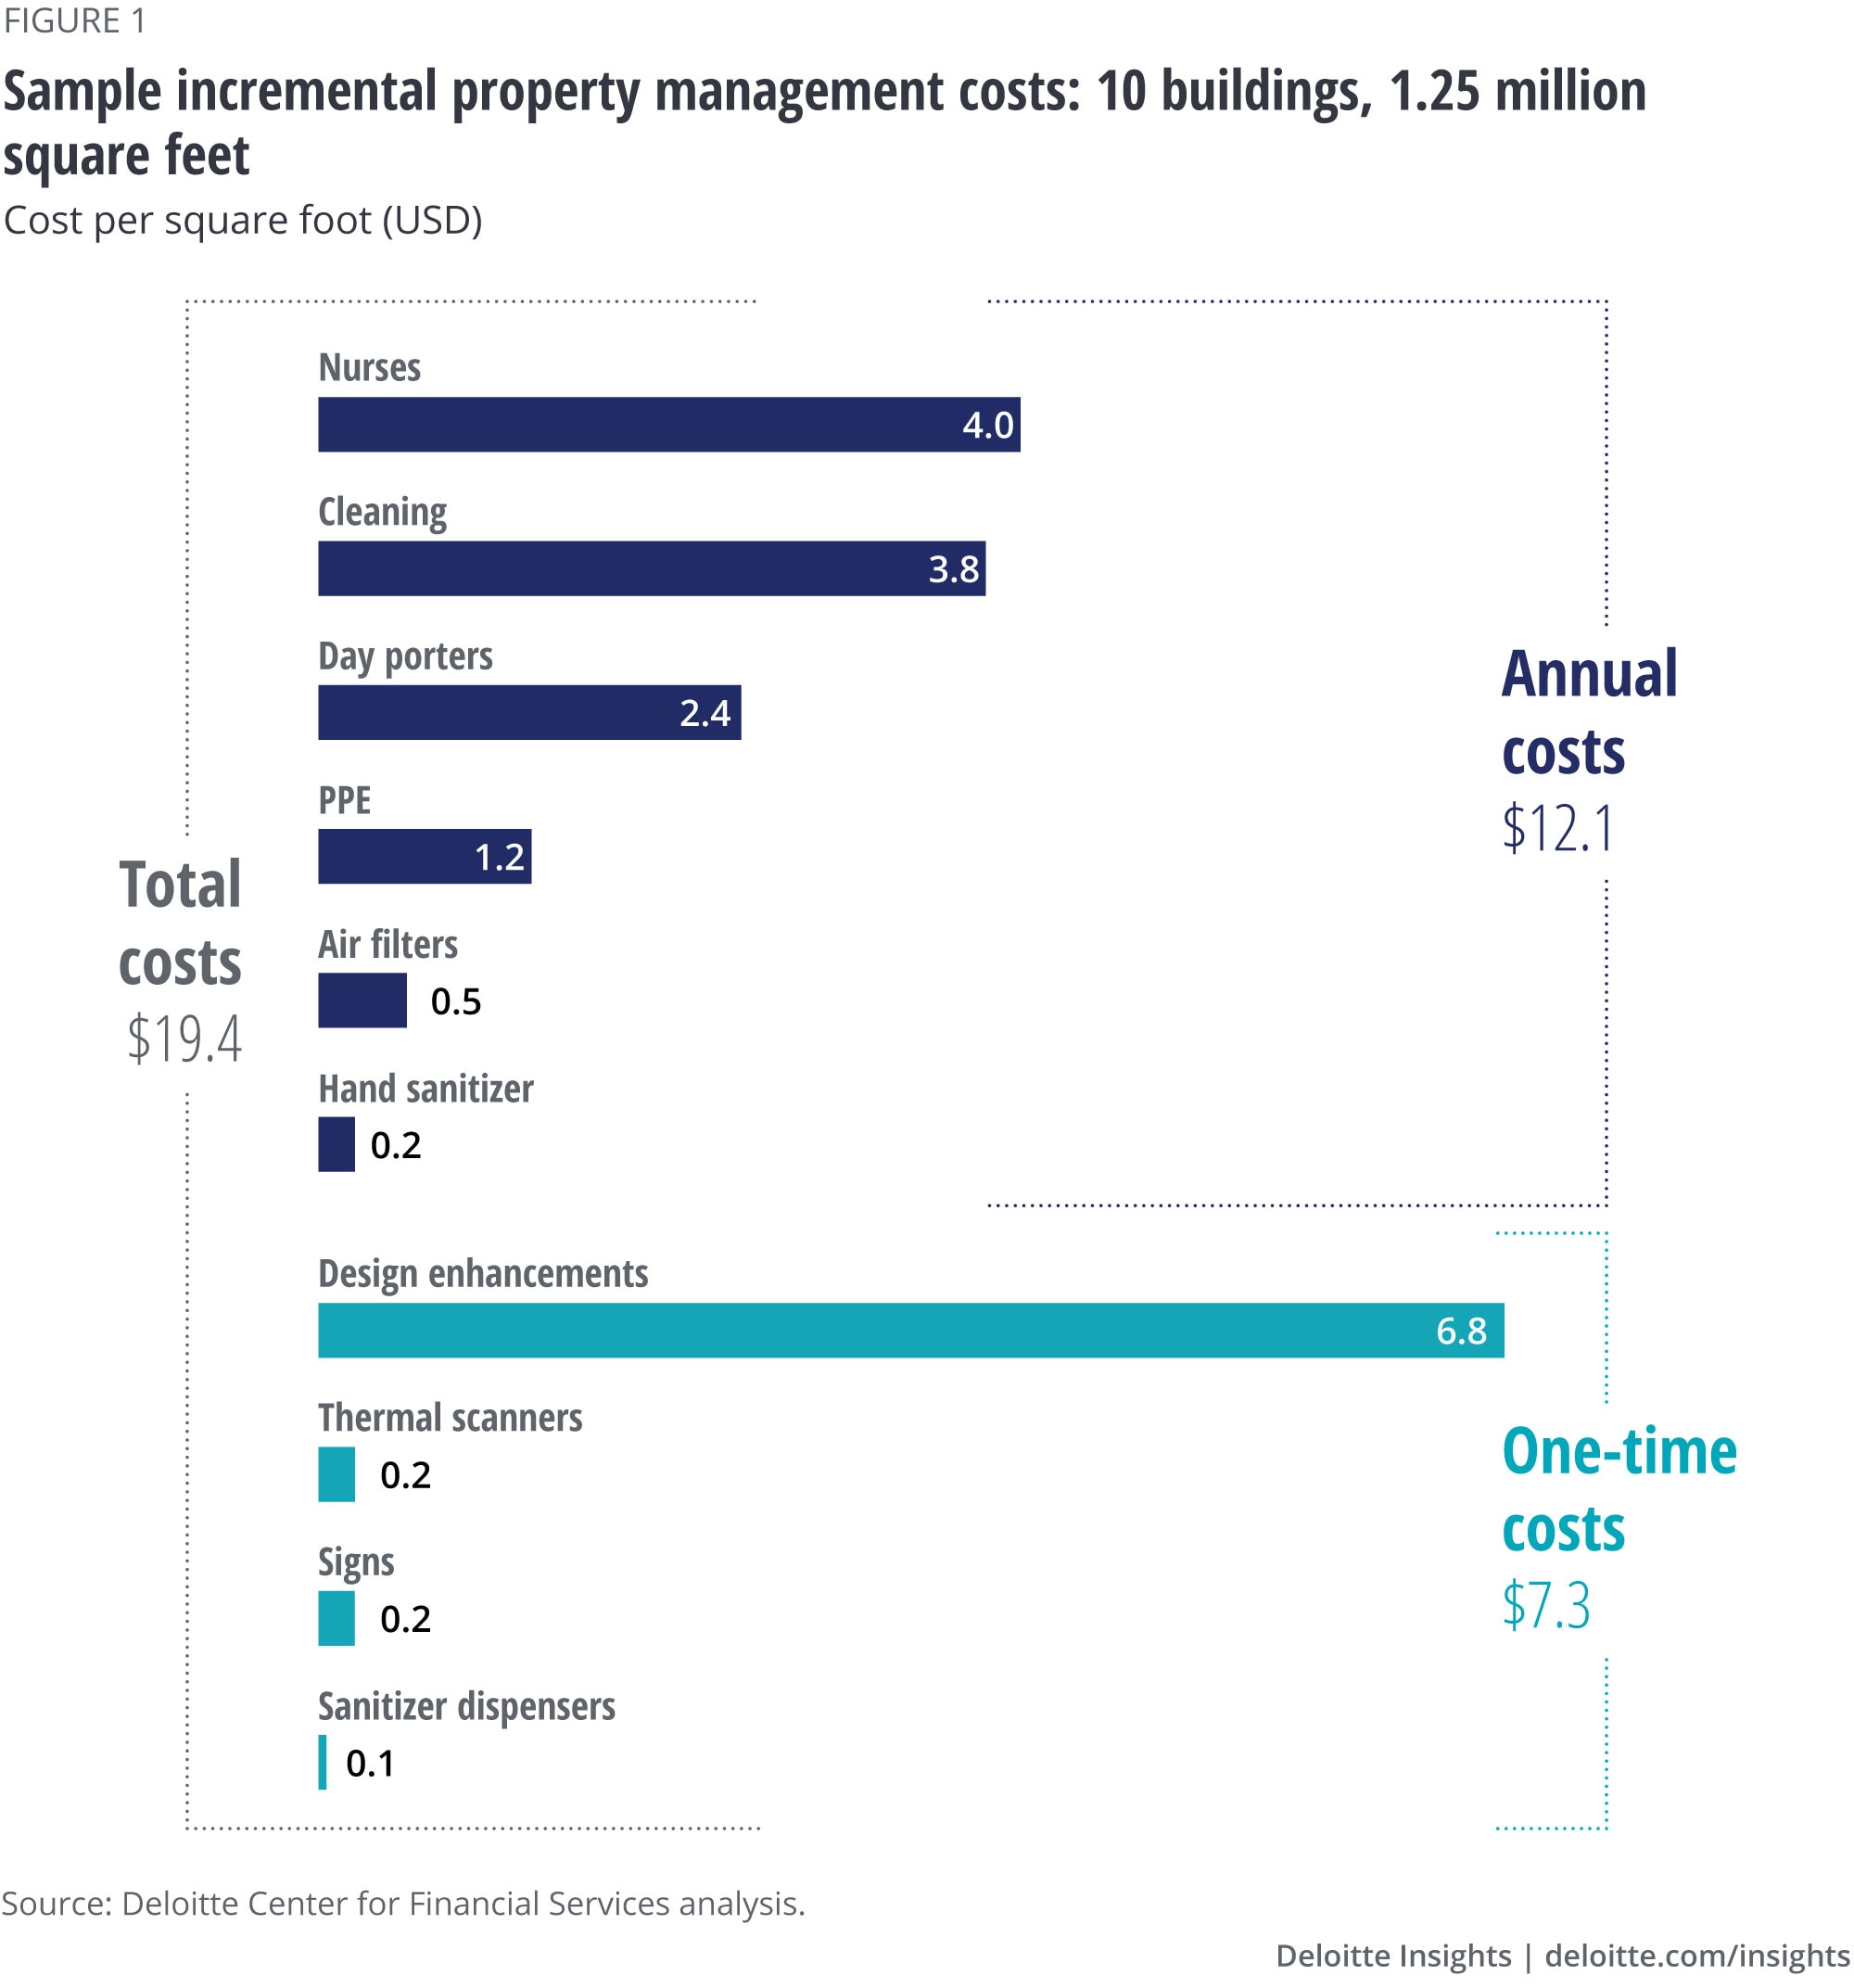
Note: Sub-total of one-time costs may vary by 0.1 due to rounding-off.
These incremental costs could vary based on the measures taken at each property and the quality of materials used. Whether they are the responsibility of the owner or the tenant will depend on lease terms and may vary tenant by tenant. Either way, for CRE owners, it will likely have an overall impact on the total operating cost of office real estate and could reduce margins.
Delayed rentals and lease nonrenewals could pressure liquidity
So far, most US office REIT tenants have continued to service their leases: Rent collections averaged 95% from April to June.34 In contrast to the 2008–09 global financial crisis, office REITs had much stronger balance sheets, including lower leverage and higher debt service coverage, just before the current crisis.35 However, potential lease nonrenewals, rent delays, and incremental costs could create liquidity issues in the coming months.
Seizing opportunity: Managing the now, focusing on the horizon
Office owners and operators are at an important stage for re-occupancy of their spaces. In the near term, landlords should make spaces ready for re-entry and stay focused on preserving existing tenant relationships and liquidity. Looking ahead, they will likely need to focus on re-investment and careful consideration of business models. Among the immediate priorities, landlords should consider:
Using smart building technologies. Right now, a large part of re-occupancy is about making tenants and visitors feel safe when entering an office building. Globally, many governments have outlined health and safety mandates to make office spaces ready for reuse. In the United States, for example, the Occupational Health and Safety Administration (OSHA) guidelines include a wide range of hygiene, cleaning, sanitation, safety, and social distancing measures that companies must follow to minimize the risk of COVID-19 exposure in their workplaces.
To bolster confidence among occupiers and comply with government regulations, owners/operators should develop plans to screen visitors and to increase sanitation practices, especially in high-use common areas and elevators. To aid these efforts, owners/operators could invest in smart building management capabilities such as predictive maintenance solutions, air quality sensors, ultraviolet (UV) cleaning, infra-red temperature cameras, and HEPA air filters. Air quality plays an important role in helping occupants feel safe about returning to work: In China, one of the key reasons many employees were open to returning quickly was because advanced and high-quality air filtration systems were added to enhance safety.36
Collaborating with tenants. Landlords should work closely with tenants, now more than ever. To prepare spaces for re-entry, they should collaborate with tenants to implement their preferences for social distancing measures within workspaces and common areas. They should also work together to develop screening protocols. Landlords’ ability to set up and maintain healthy workspaces and enforce the highest level of sanitation practices could play a significant role in maintaining and/or strengthening relationships with tenants.
In most cases, managing enhancements for single-tenant properties could be easier and less complex than high-rise multitenant office buildings. For these buildings, landlords should consider multiple tenant needs, which may vary considerably. They may also need to modify the use of shared spaces and common amenities, and ensure employees from different companies come and go at different times to avoid crowding.
Managing liquidity and financing in the near term. Given the potential liquidity issues, owners and operators will likely need to focus on cost management over the next 12 months. They should develop an operational game plan on how to deal with matters such as: prioritizing costs that are critical to enabling tenants to return to work; proactively engaging tenants on cost-sharing strategies; and developing a plan to quickly resolve requests around rent deferrals and concessions.
Forecasting methodology
To forecast the impact of the COVID-19 pandemic on office real estate in 2020-21, our research team at the Deloitte Center for Financial Services estimated the potential increase in property management costs. We identified the additional costs that may be required as companies return to work, based on different client conversations. This includes the added cost of service staff such as nurses and products such as personal protective equipment.
Our insights can help you take advantage of change. If you’re looking for fresh ideas to address your challenges, we should talk. View our services page.
Contacts
Jim Berry |
Nathan Florio |
Jim Eckenrode |
Surabhi Kejriwal |
View sector performances
Forecasting the performance of the US banking industry
Another crisis, and a new wave of uncertainty
The first two quarters of 2020 gave us the first glimpse of the potential damage lying ahead: The US banking industry provisioned a total of US$52.7 billion for loan losses in the first quarter alone, and the second quarter probably looking even worse.37 By the end of March, barely two weeks into the lockdown, the United States hit record levels of unemployment, the highest since the Great Depression. The Coronavirus Aid, Relief, and Economic Security Act (CARES Act) was still being developed.
Much has happened since then; the reopening of some sectors of the economy in late second quarter has—at least temporarily—decelerated the plunge. But uncertainty on a number of fronts will cloud expectations for the foreseeable future.
With this in mind, the economic malaise from COVID-19 should meaningfully reshape the US banking industry.
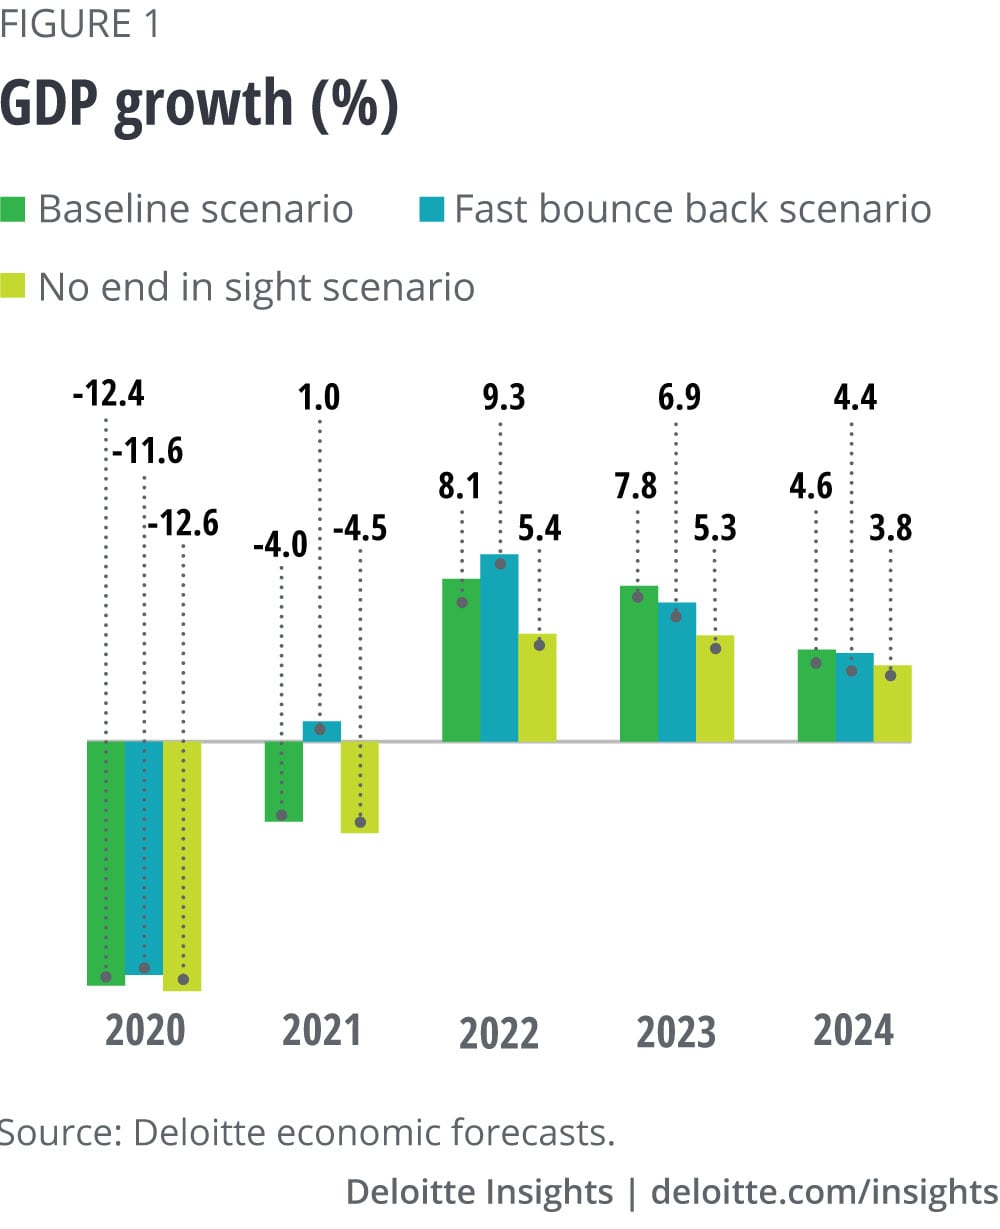
In this report, we forecast US commercial banks’ key balance sheet and income statement items, including revenues, expenses, loan losses and associated provisions, and profitability over the years 2020–2024 under three different economic scenarios38 (see the methodology sidebar for more details):
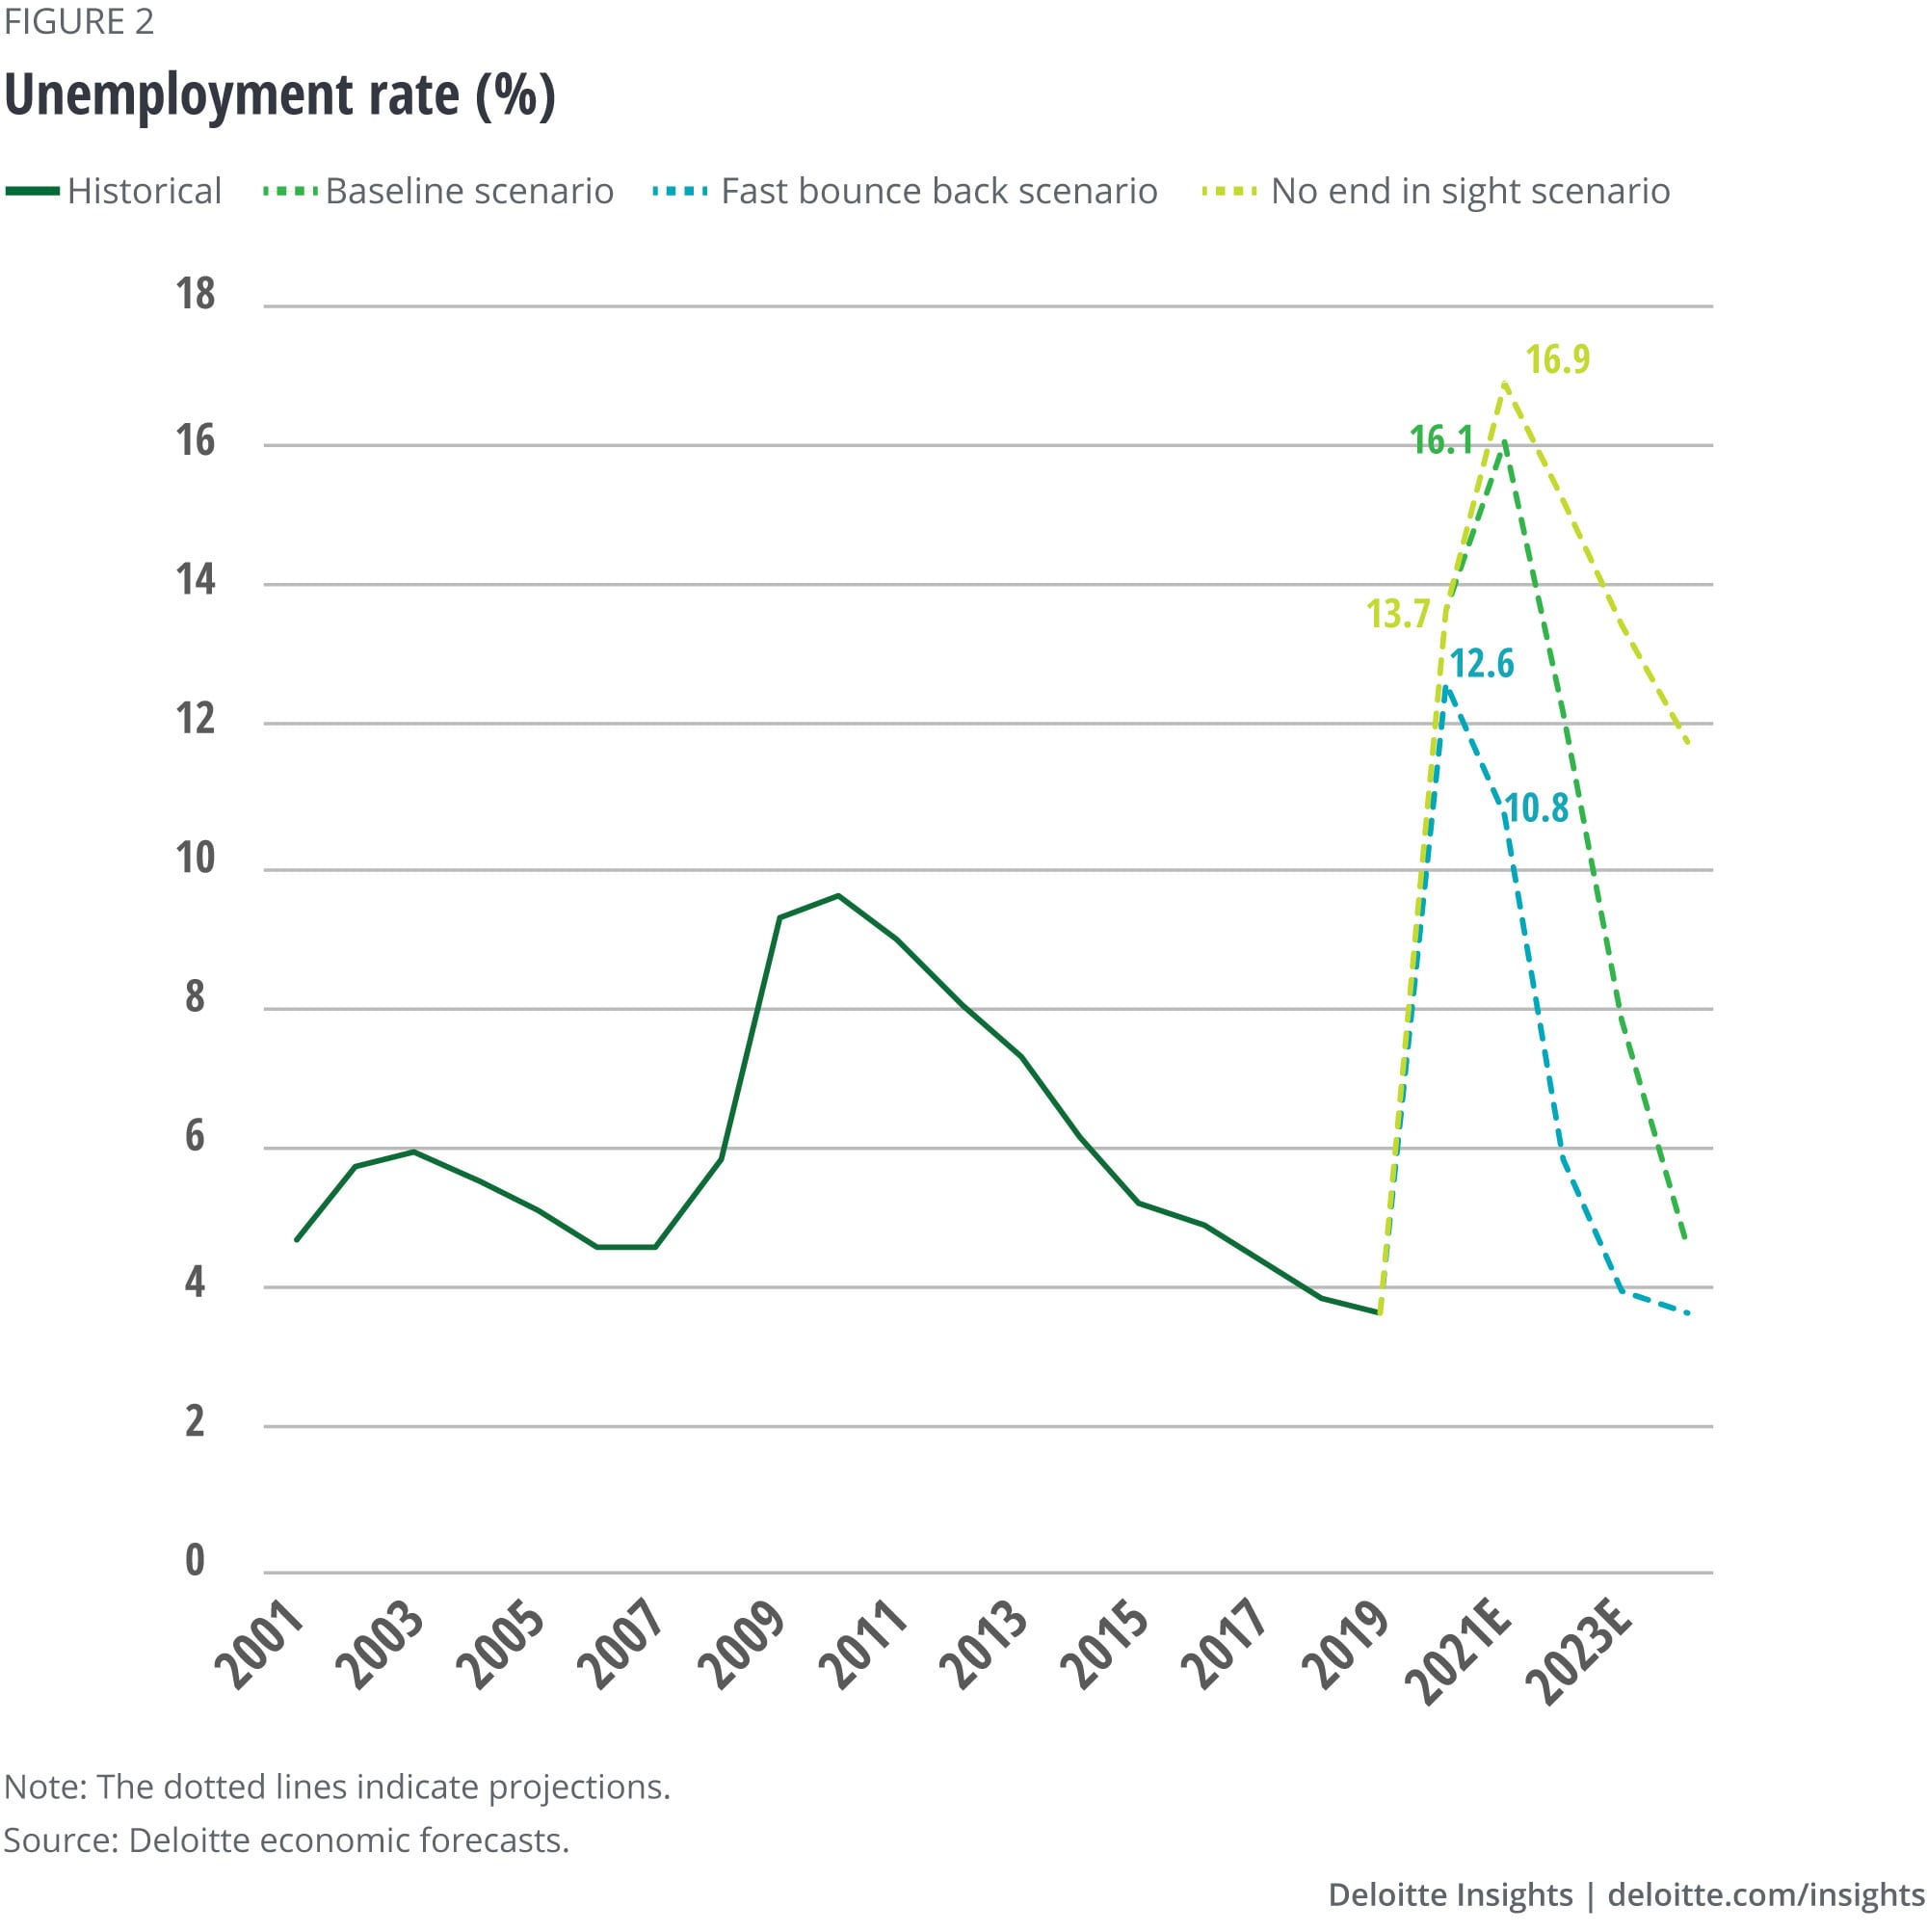
- Baseline (70% probability). In this scenario, recovery will not really get underway until the middle of 2021. GDP plunges 12.4% in 2020, and 4% in 2021 (figure 1), followed by a strong recovery in 2022–23. Unemployment continues to climb, peaking at 16.1% in 2022 (figure 2).
- No end in sight (25% probability). In this scenario, the economy experiences repeated cycles of starts and closings. GDP drops in a similar range as the baseline scenario in 2020 and 2021, but sees slower recovery in 2022. Unemployment remains persistently high and above 11% through 2024. Yields remain low over the forecast horizon.
- Fast bounce back (5% probability). In this scenario, reopening the economy beginning in May proves successful. GDP declines 11.6% in 2020, followed by a recovery starting in 2021, and then explosive growth in 2022. The yield environment starts to improve, and the unemployment rate recedes to pre-crisis levels in 2024.
The above scenarios do not explicitly account for any additional government relief/stimulus programs that may be enacted.
In our baseline scenario, US commercial banks could face net loan losses of as much as US$387 billion from 2020 to 2022. As a result, RoE could decline to 2.3% in 2020.
Contrast our forecasts with the US Federal Reserve (the Fed)’s sensitivity analysis of the impact of COVID-19 on the 33 large banks included in the 2020 Dodd-Frank Stress Test (DFAST). In the Fed’s COVID-19 alternative downside scenarios, loan losses for the 33 largest banks included in the DFAST exercise could range from US$560 billion (“V-shaped” recovery) to US$700 billion (“U-shaped”).39 However, it should be noted that the Federal Reserve’s estimates do not account for recent government support programs such as additional unemployment insurance and the Paycheck Protection Program (PPP). But in our analysis, we considered the effects of various government supports/stimulus initiatives.
While not on the same scale as the global financial crisis of 2008–10 (GFC), the economic consequences of the pandemic are still distressing. As with other sectors in the economy, COVID-19 will very likely reshape the US banking industry on a number of dimensions, including competitive structure, sources of growth, product innovation, the role of branches, and of course, the acceleration of digital technologies.
Consolidation ahead: How many banks will there be in 2024?
The number of US commercial banks40 has been steadily declining by about 230 on average every year since the GFC.41 We expect this contraction to accelerate. According to data from S&P, over the past five years, about one-third of US commercial banks have consistently delivered RoE below the cost of capital of 10%.42 With increased pressure on profitability, the overall number of banks in the United States may plummet, from 4,500 in 2019 to 3,150 by 2024. As a result, industry concentration will likely increase, with more large banks emerging from industry consolidation. But eventually, the winners could emerge much stronger from this crisis.
METHODOLOGY
We employ a proprietary, custom model and use a scenario-based approach to forecast banks’ financials and profitability ratios. We use historical data from S&P Global Market Intelligence. Our data set comprises data on all US commercial banks43 between 2001 and 2019. We build our estimates of banking performance based on the macroeconomic forecasts from Deloitte’s Economics team.44
We arrived at the estimates by looking at historical correlations and running regression models, where appropriate. But given the fact that the current data (e.g., the rate of decline in unemployment, and the unique nature of unemployment this time around) is outside the bounds of historical norms, we modified our estimation procedure by subjective assessments, and recognized current realities such as the scale and variety of government support programs, including the Paycheck Protection Program (PPP), the Pandemic Unemployment Assistance (PUA), and many others. We also accounted for historically low interest rates in our computations. Lastly, our estimations were informed by discussions with market participants and a number of Deloitte professionals.
Significant loan losses are expected, but lower than during the Global Financial Crisis
No matter how the macroeconomic scenario unfolds over the next year or two, banks should experience credit losses on a scale we have not seen since the financial crisis. The big questions are how steep these losses will be and what impact will they have on industry profitability.
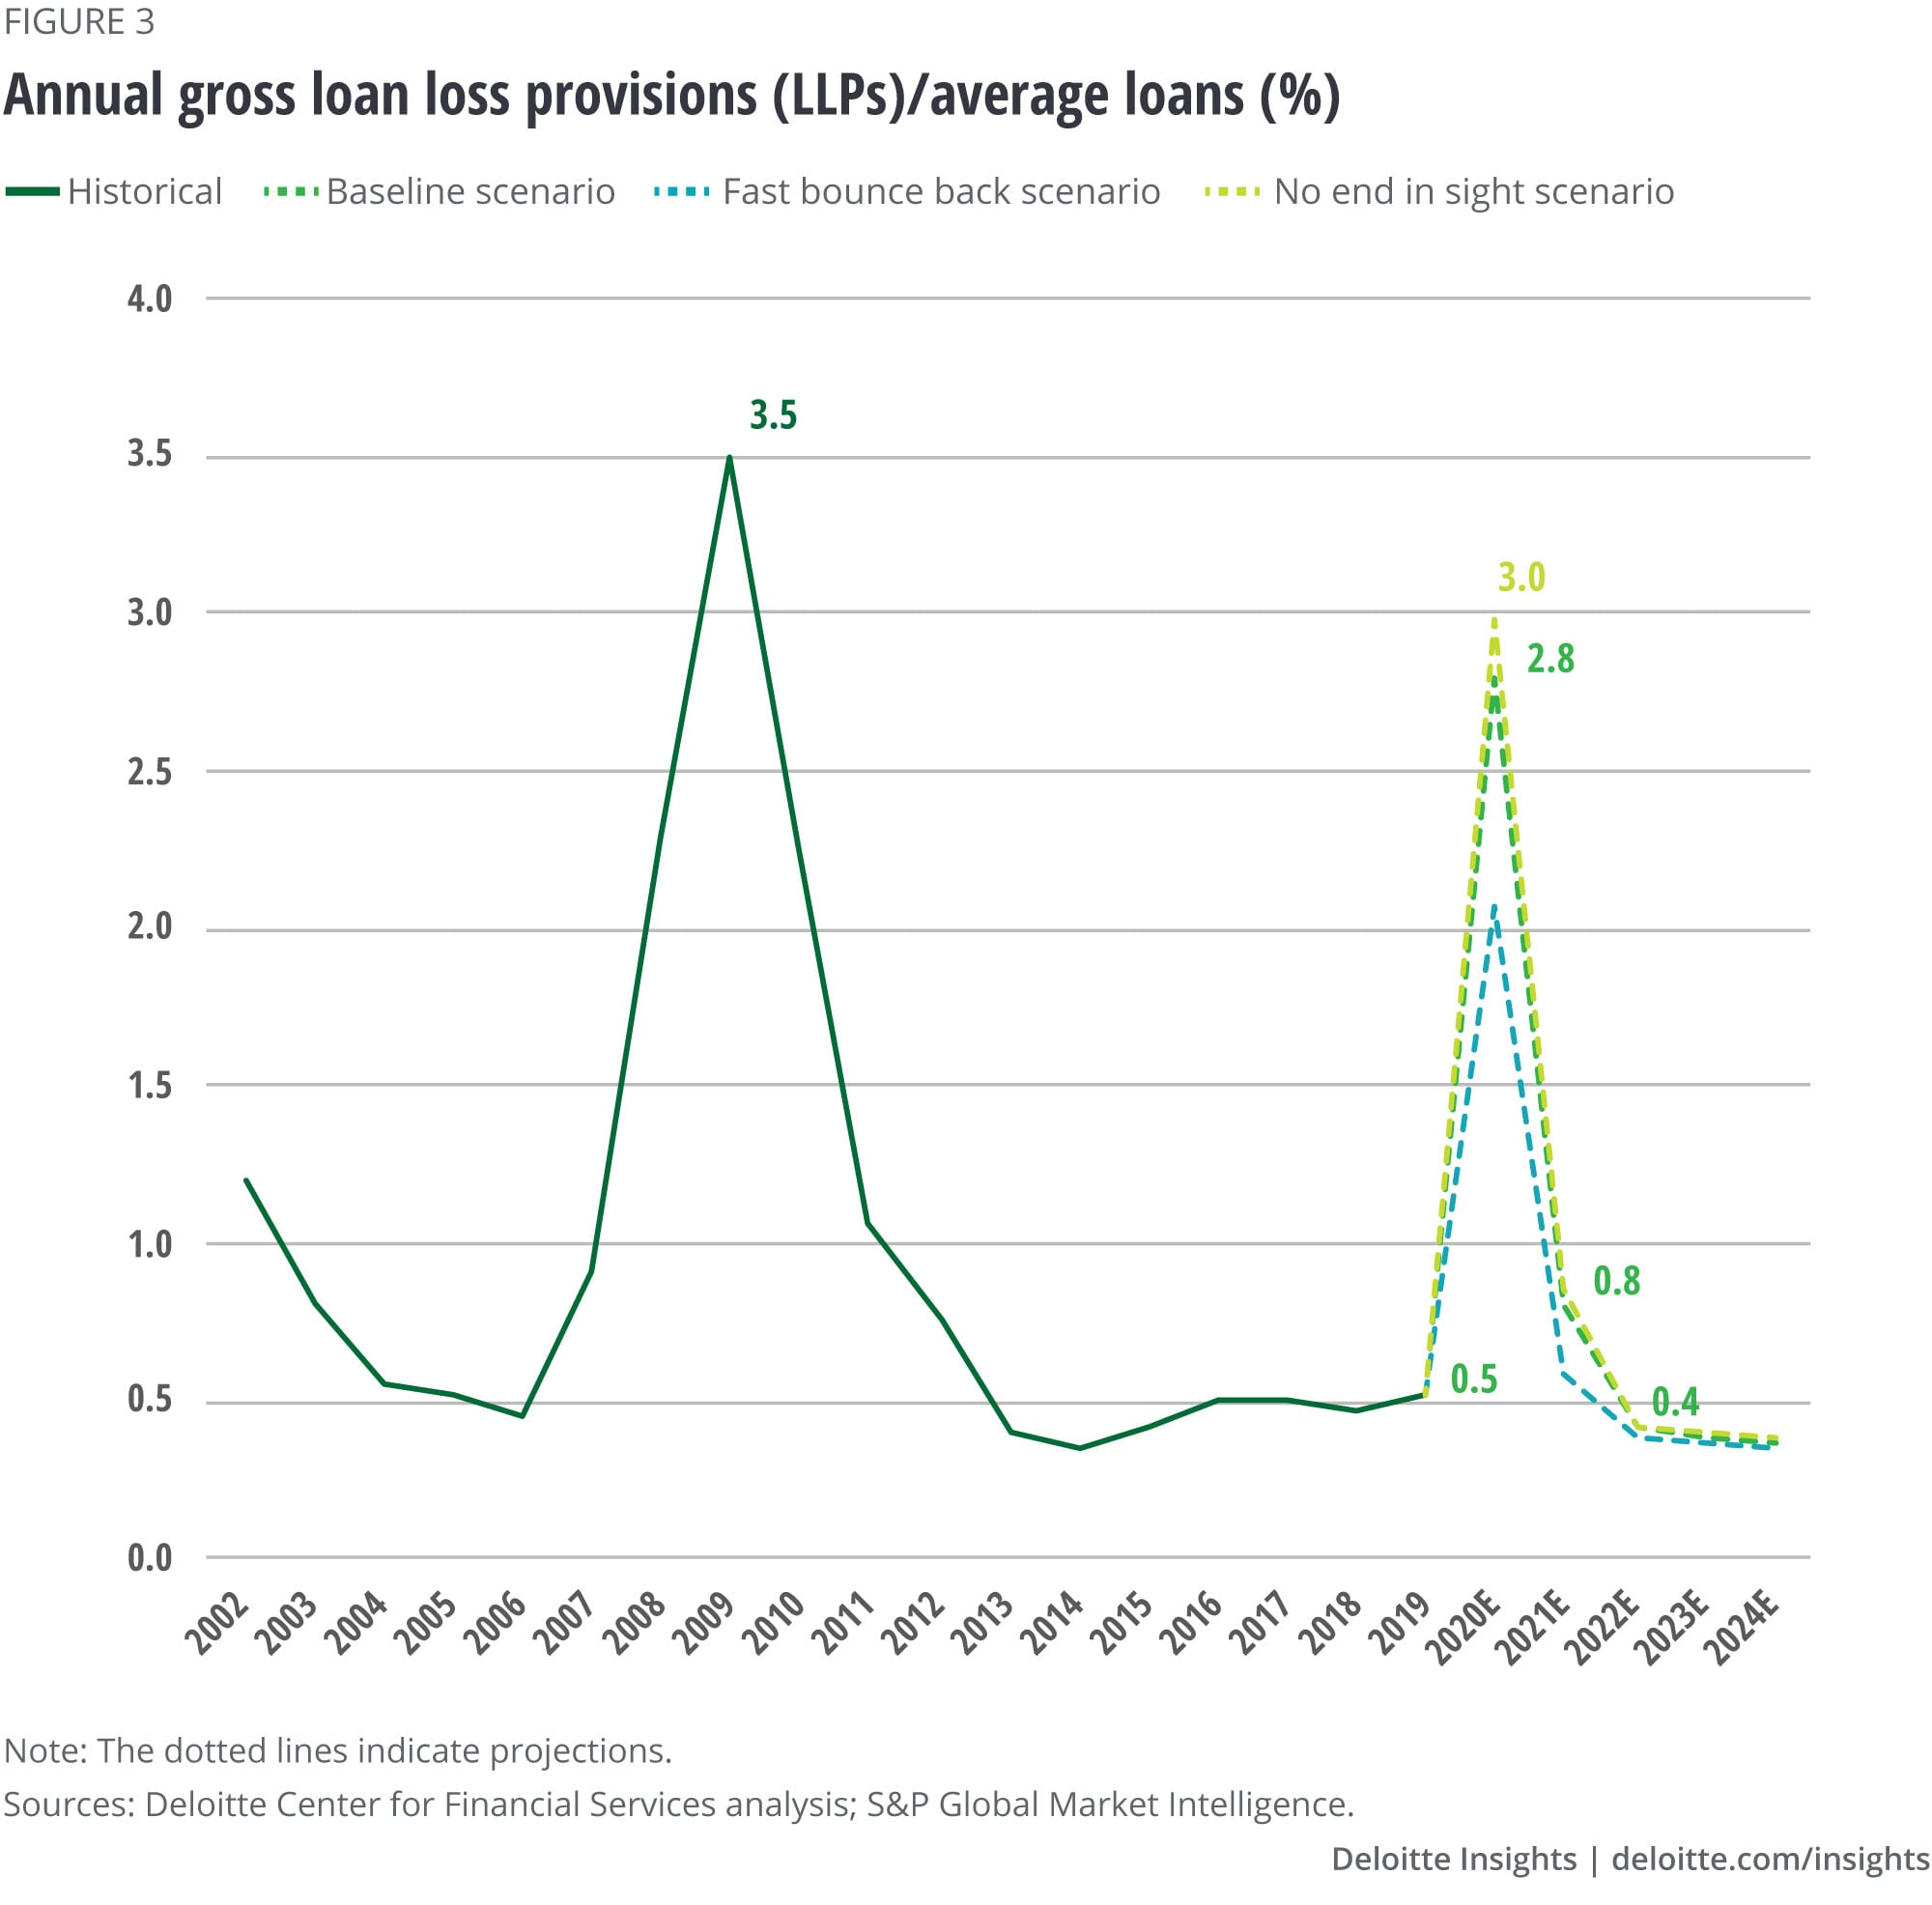
In our baseline scenario, banks may have to provision for a total of US$387 billion in net loan losses between 2020 and 2022. Representing 4% of average loans 2019 to 2022, at first sight, this number is staggering. But it is a far cry from the US$438 billion of net loan losses observed between 2008 and 2010 during the GFC; its equivalent loss ratio was 6.6%.
Our forecasted loan-loss provisions (LLP) are heavily concentrated in the years 2020–21, reaching LLP rates of 2.8% and 0.8%, respectively, in our baseline scenario (figure 3). Although CECL’s (current expected credit losses) impact on regulatory capital has been postponed by another two years,45 the adoption of the CECL standard by the large banks is expected to result in the immediate recognition of loan-loss provisions.
While losses can be expected in every loan category, they may be most acute within consumer loans (figure 4). Credit card loans should be hit the hardest. In our baseline scenario, a cumulative gross US$175 billion in charge-offs (21.6% loss ratio) is anticipated over the course of 2020–22, followed by commercial and industrial (C&I) loan losses, with US$108 billion gross charge-offs (4.8% loss ratio).
Residential real estate lending is expected to perform better. The GFC began as a housing crisis that had significant indirect effects on other loans: As house prices fell, overleveraged borrowers’ wealth evaporated, and they quickly found themselves with negative home equity values.46 After defaulting on their mortgages, borrowers were more inclined to walk away from other debt, such as credit card loans. Also, in the current crisis, unemployment has been most concentrated among the lower-wage service workers, who are more likely to be renters.47,48
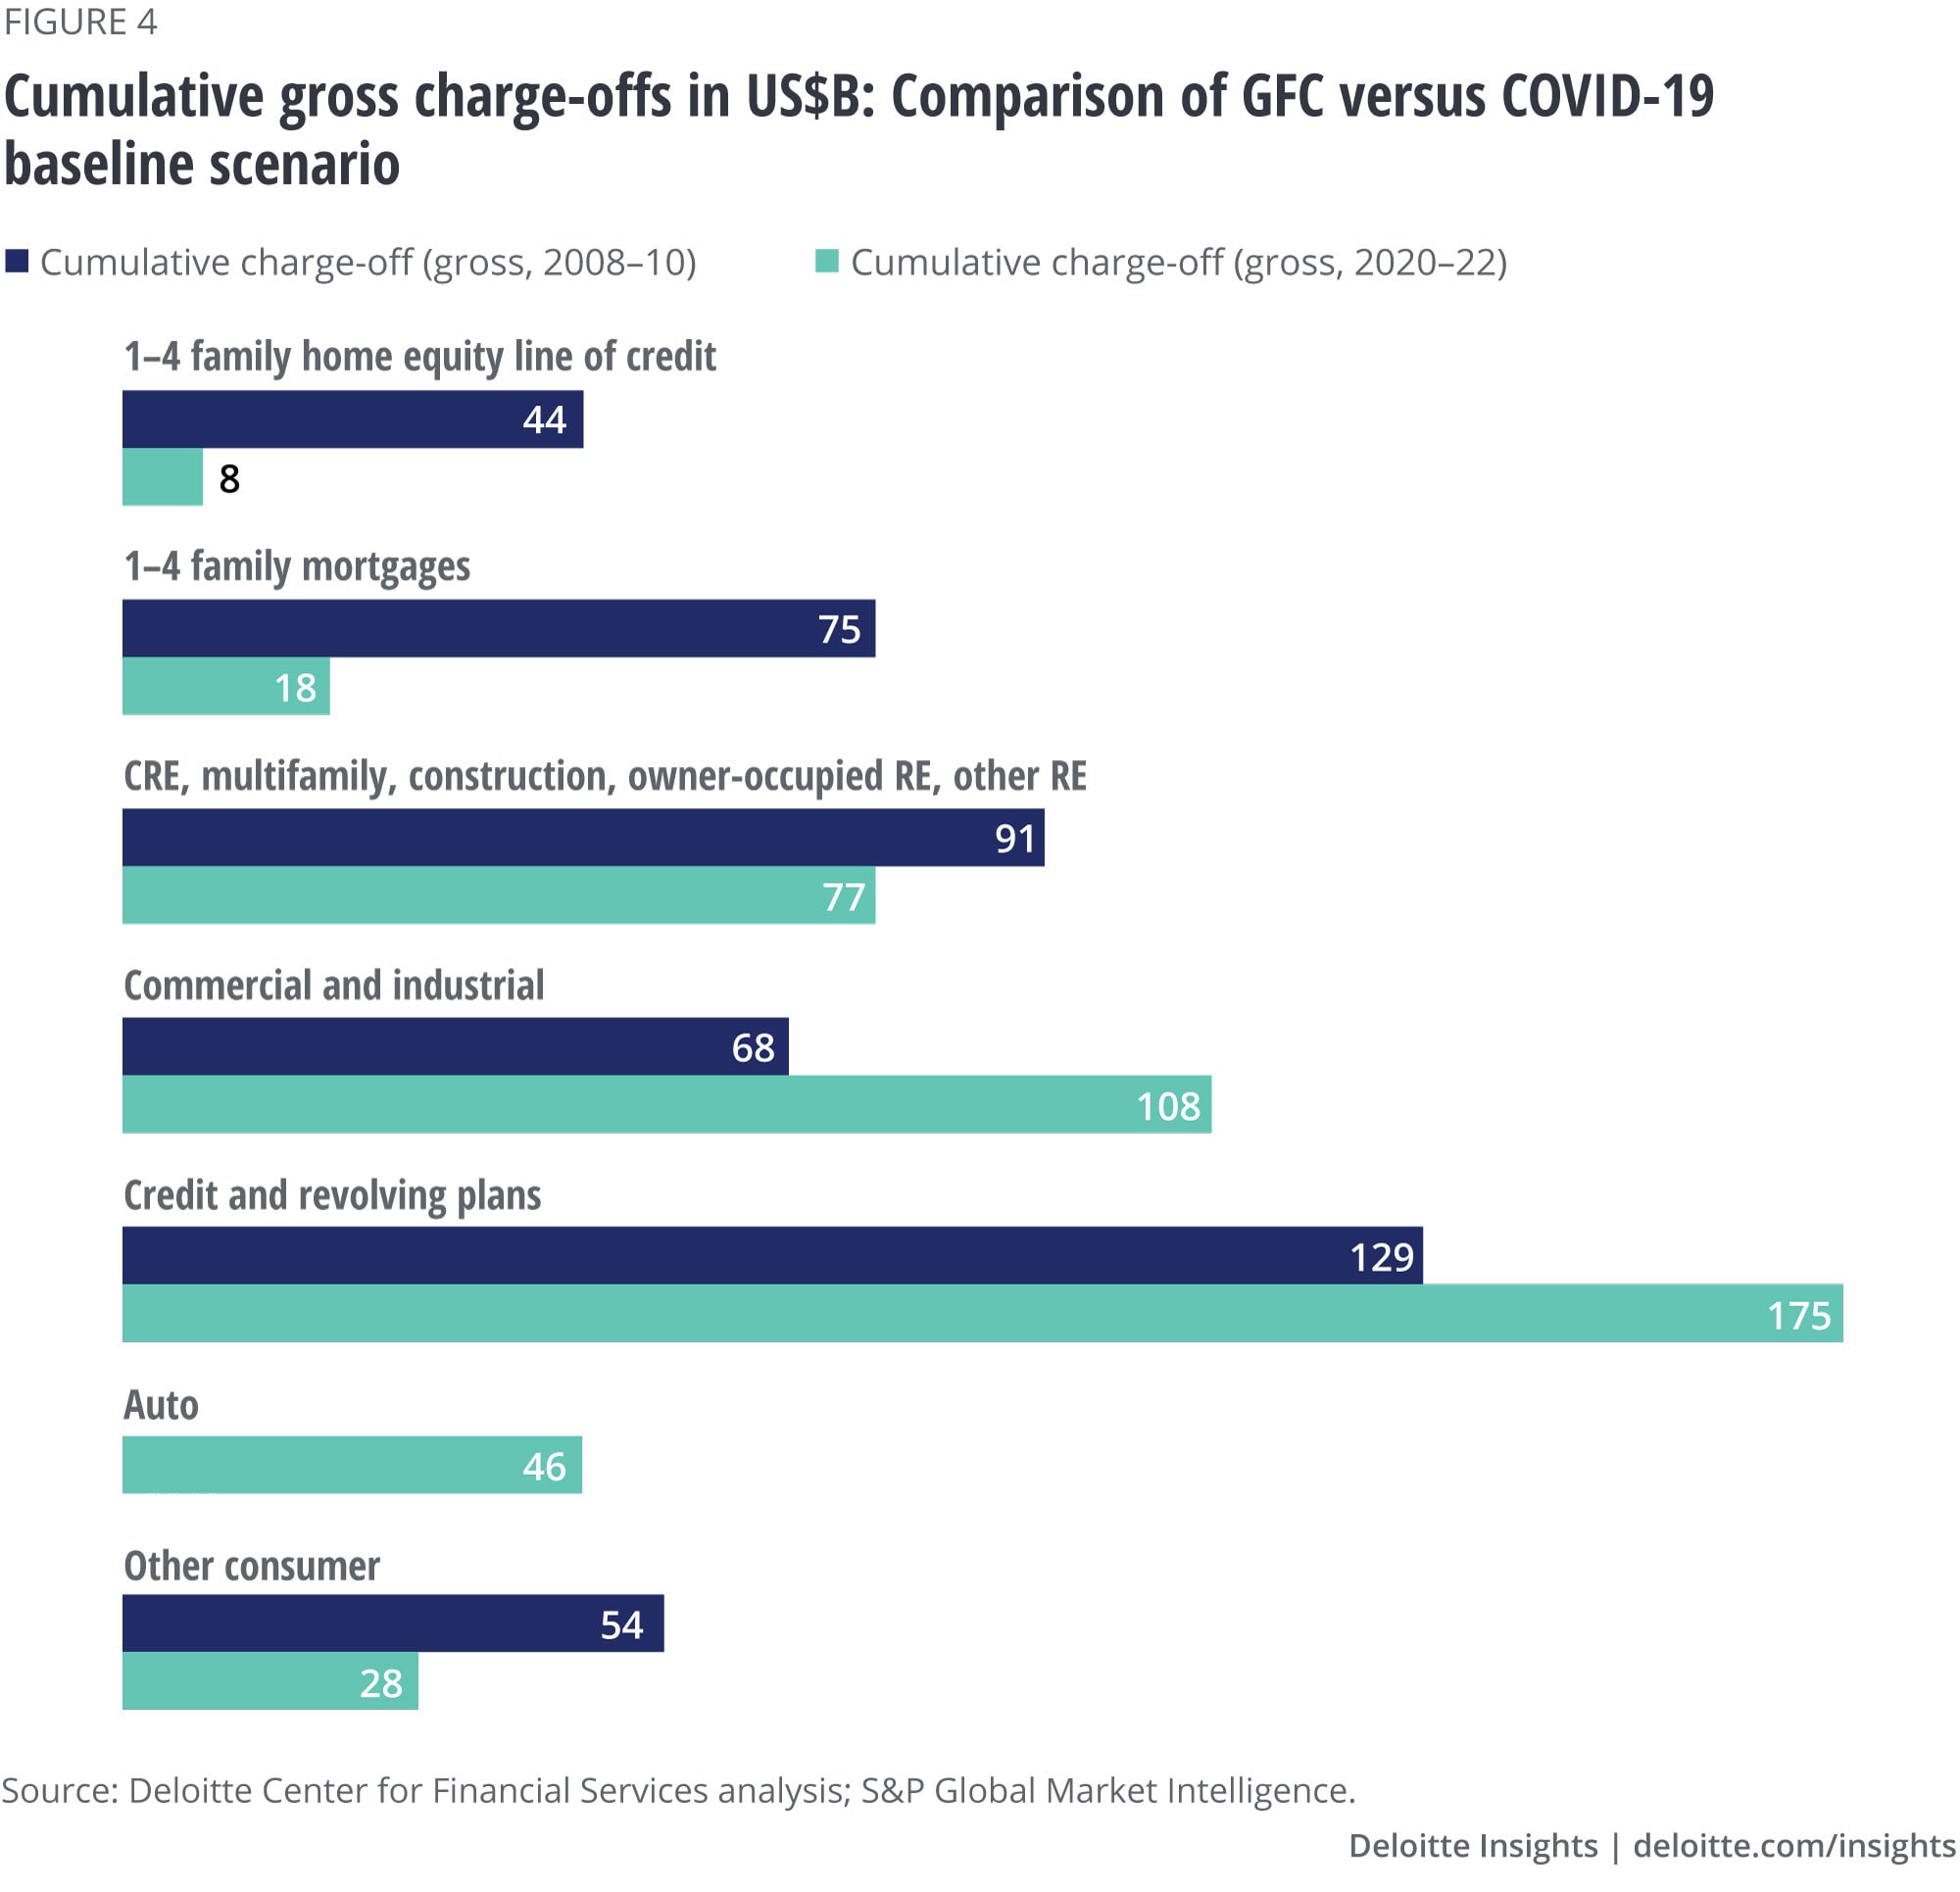
This time around, losses could be more pronounced in the commercial real estate (CRE) loans area, compared to the residential market. This is due to the unique effects from the COVID-19 economic shutdown on the hospitality and retail industries. Also, reduced office space demand could further amplify the CRE pain.49
Overall, compared to the GFC, there are some distinct differences in credit quality and deterioration. Many households, in particular, are in a financially stronger position, making them more resilient to weather economic shocks. In addition, banks have focused on building a higher-quality loan portfolio in the consumer space by reducing underwriting to lower credit score customers. Most banks are also extending payment deferrals and loan modifications to allow borrowers to return to a financially healthier state before resuming debt payments instead of immediately writing those loans off. Lastly, government support to both households and businesses, through programs such as higher unemployment insurance, the PPP, Main Street Lending Facility, Primary Market Corporate Credit Facilities, and Secondary Market Corporate Credit Facilities, should significantly decrease potential loan losses.
Important questions for banking leaders
- How can forecasts of loan losses across the bank’s portfolio become more accurate and timelier, given current data (on forbearances, for example) goes beyond historical norms, and is changing quickly? What are the likely challenges in applying CECL requirements to the available data? And how can banks accurately account for distressed loans, given the temporary regulatory adjustments?
- What is the strategy for default management? How are financial considerations, including the impact on capital management as well as reputation implications, informing decisions?
- What operational changes still need to be made to execute on loan default management? What will be needed in terms of staffing, engaging with clients and third parties, setting risk controls, undertaking technology upgrades, and meeting compliance standards?
Return on equity may not recover to pre-COVID levels until 2023
RoE of the US banking industry has been on an upward path since the GFC, reaching almost 11.2% at the end of 2019. And if not for the COVID-19 pandemic, RoE might have remained at this elevated level. But significant increases in loan-loss provisions and anemic revenue growth across most banking segments could shrink RoE to levels not seen since the GFC.
In all three scenarios, RoE could fall to between 1.5% and 5.2% in 2020 (figure 5). However, this decline won’t likely be as severe as during the GFC, when industry RoE dropped to negative territory due to significant loan-loss provisions. After 2021, the economy should improve, and loan losses will likely begin to normalize, and RoE will likely recover quickly.
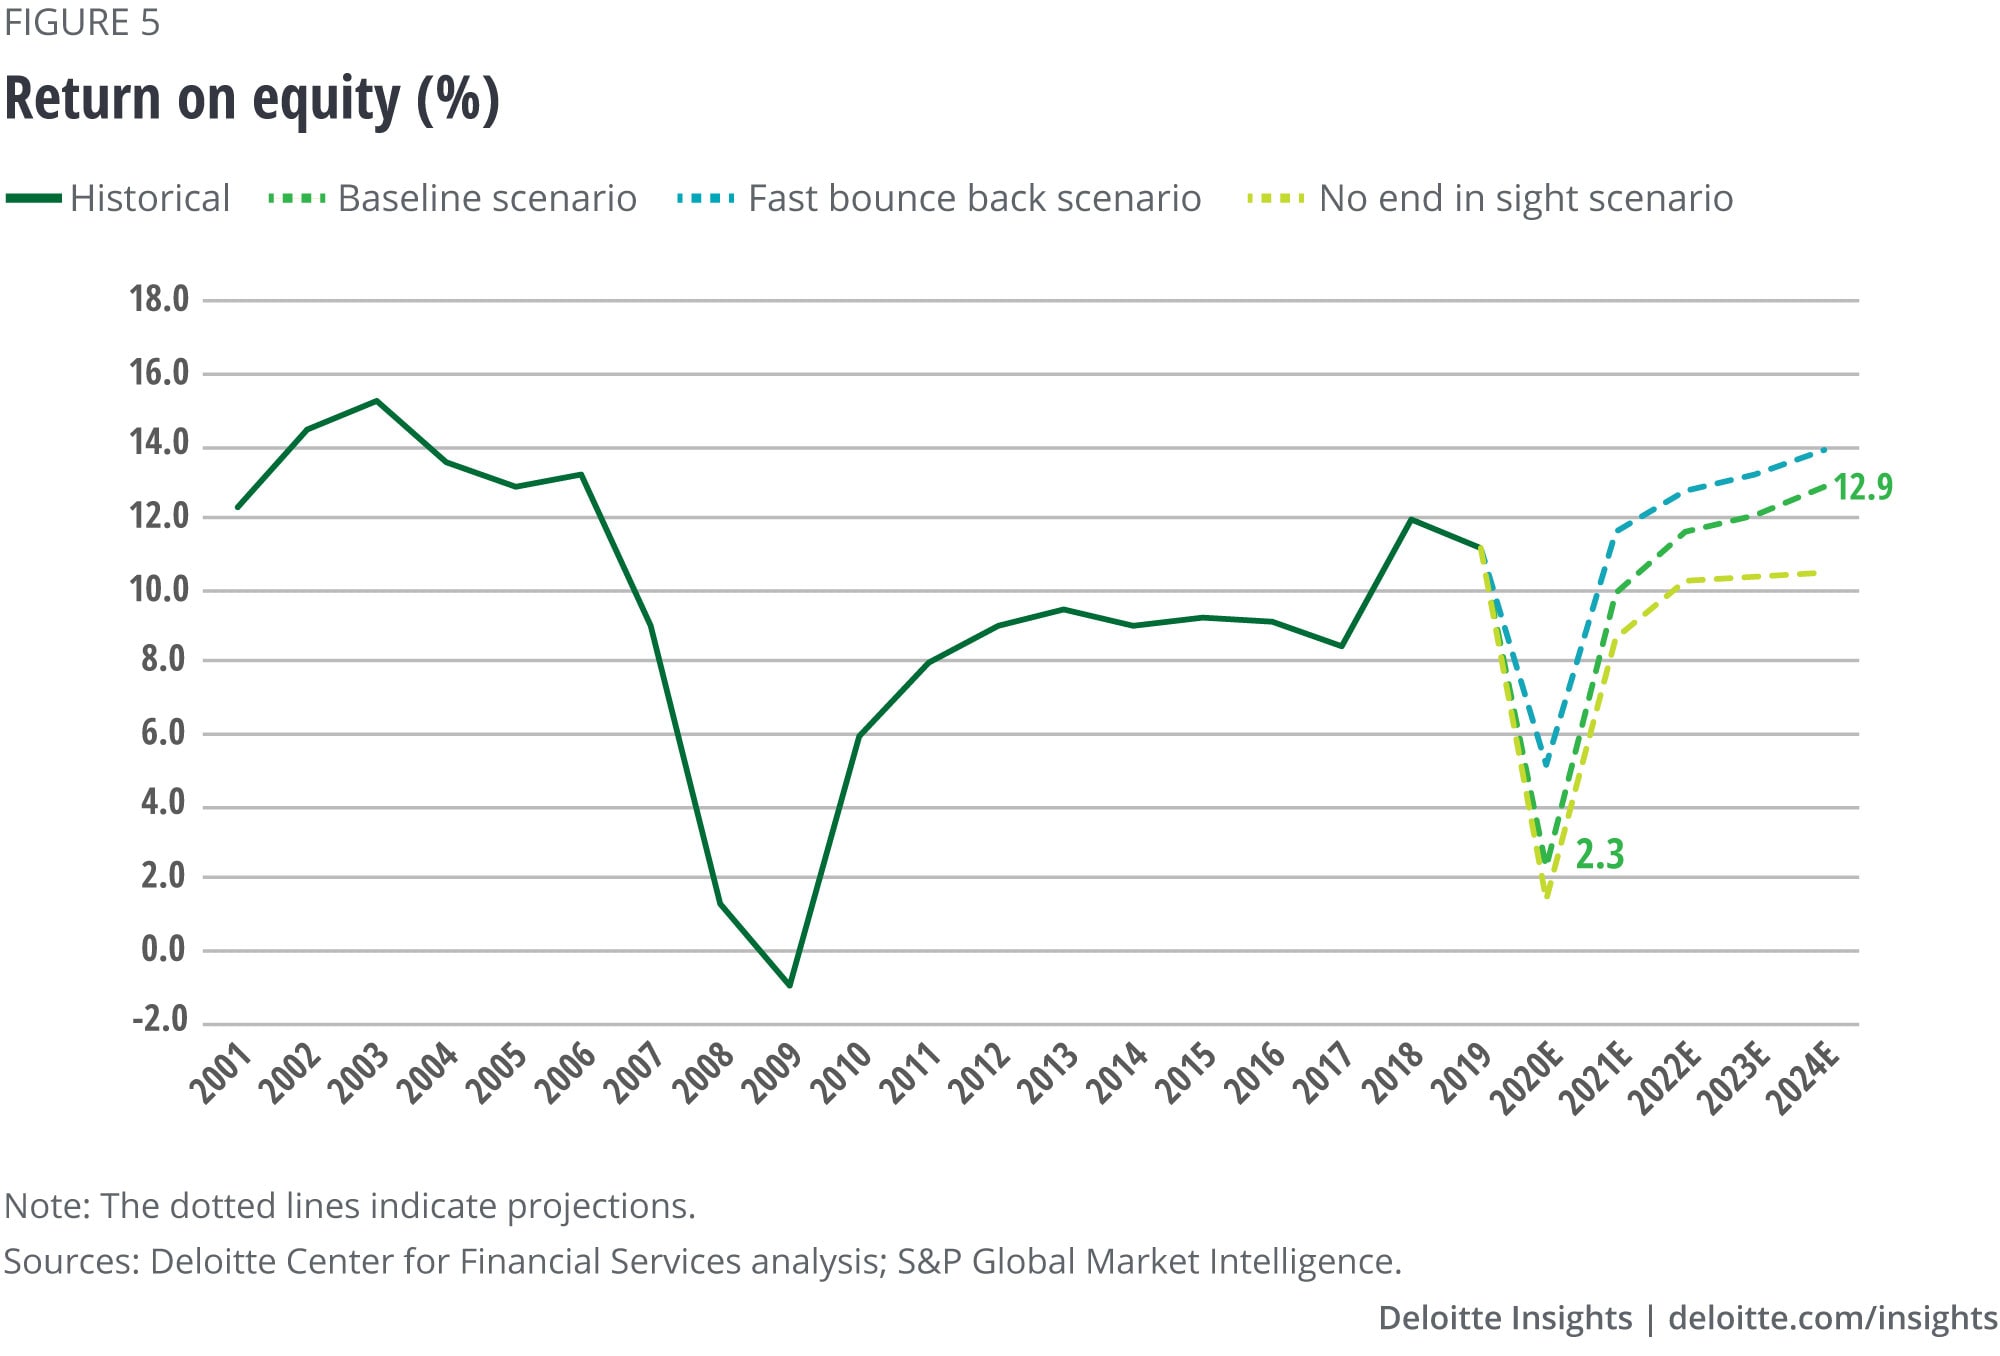
In the baseline scenario, RoE growth should get a boost from a quicker economic recovery, and may eventually reach 12.9% in 2024.
In our no end in sight scenario, banks would not recover fully, remaining below pre-crisis levels with a 2024 RoE of 10.5% due to an ongoing low-yield environment.
No matter what, going forward, most banks are expected to undertake a radical overhaul of their business models. Of course, meeting this challenge in a low-rate, low-growth environment won’t be easy—some banks will succeed in this transformation, others won’t.50 This will likely result in a “valuation chasm” between these two types of banks: Banks whose business model is less dependent on noninterest income tend to be valued about 14% less than banks that have a much greater share of revenues coming from noninterest income.51 This should prompt industry consolidation, which we have not witnessed in more than a decade.
Important questions for banking leaders
- In this uncertain environment, how can we communicate future RoE expectations in a way that maintains investor trust and helps safeguard the bank’s stock price/valuation?
- What changes to business strategy should be made to take advantage of current opportunities (for instance, seizing opportunities to merge with and/or acquire other institutions whose valuations may be depressed)?
- What changes to the operating model need to be made in the near and medium term to become more resilient to future shocks?
There will likely be pressure on revenues, but noninterest income should offer growth potential
In all three of our scenarios, revenue pressure is expected to be high, specifically in the short term.
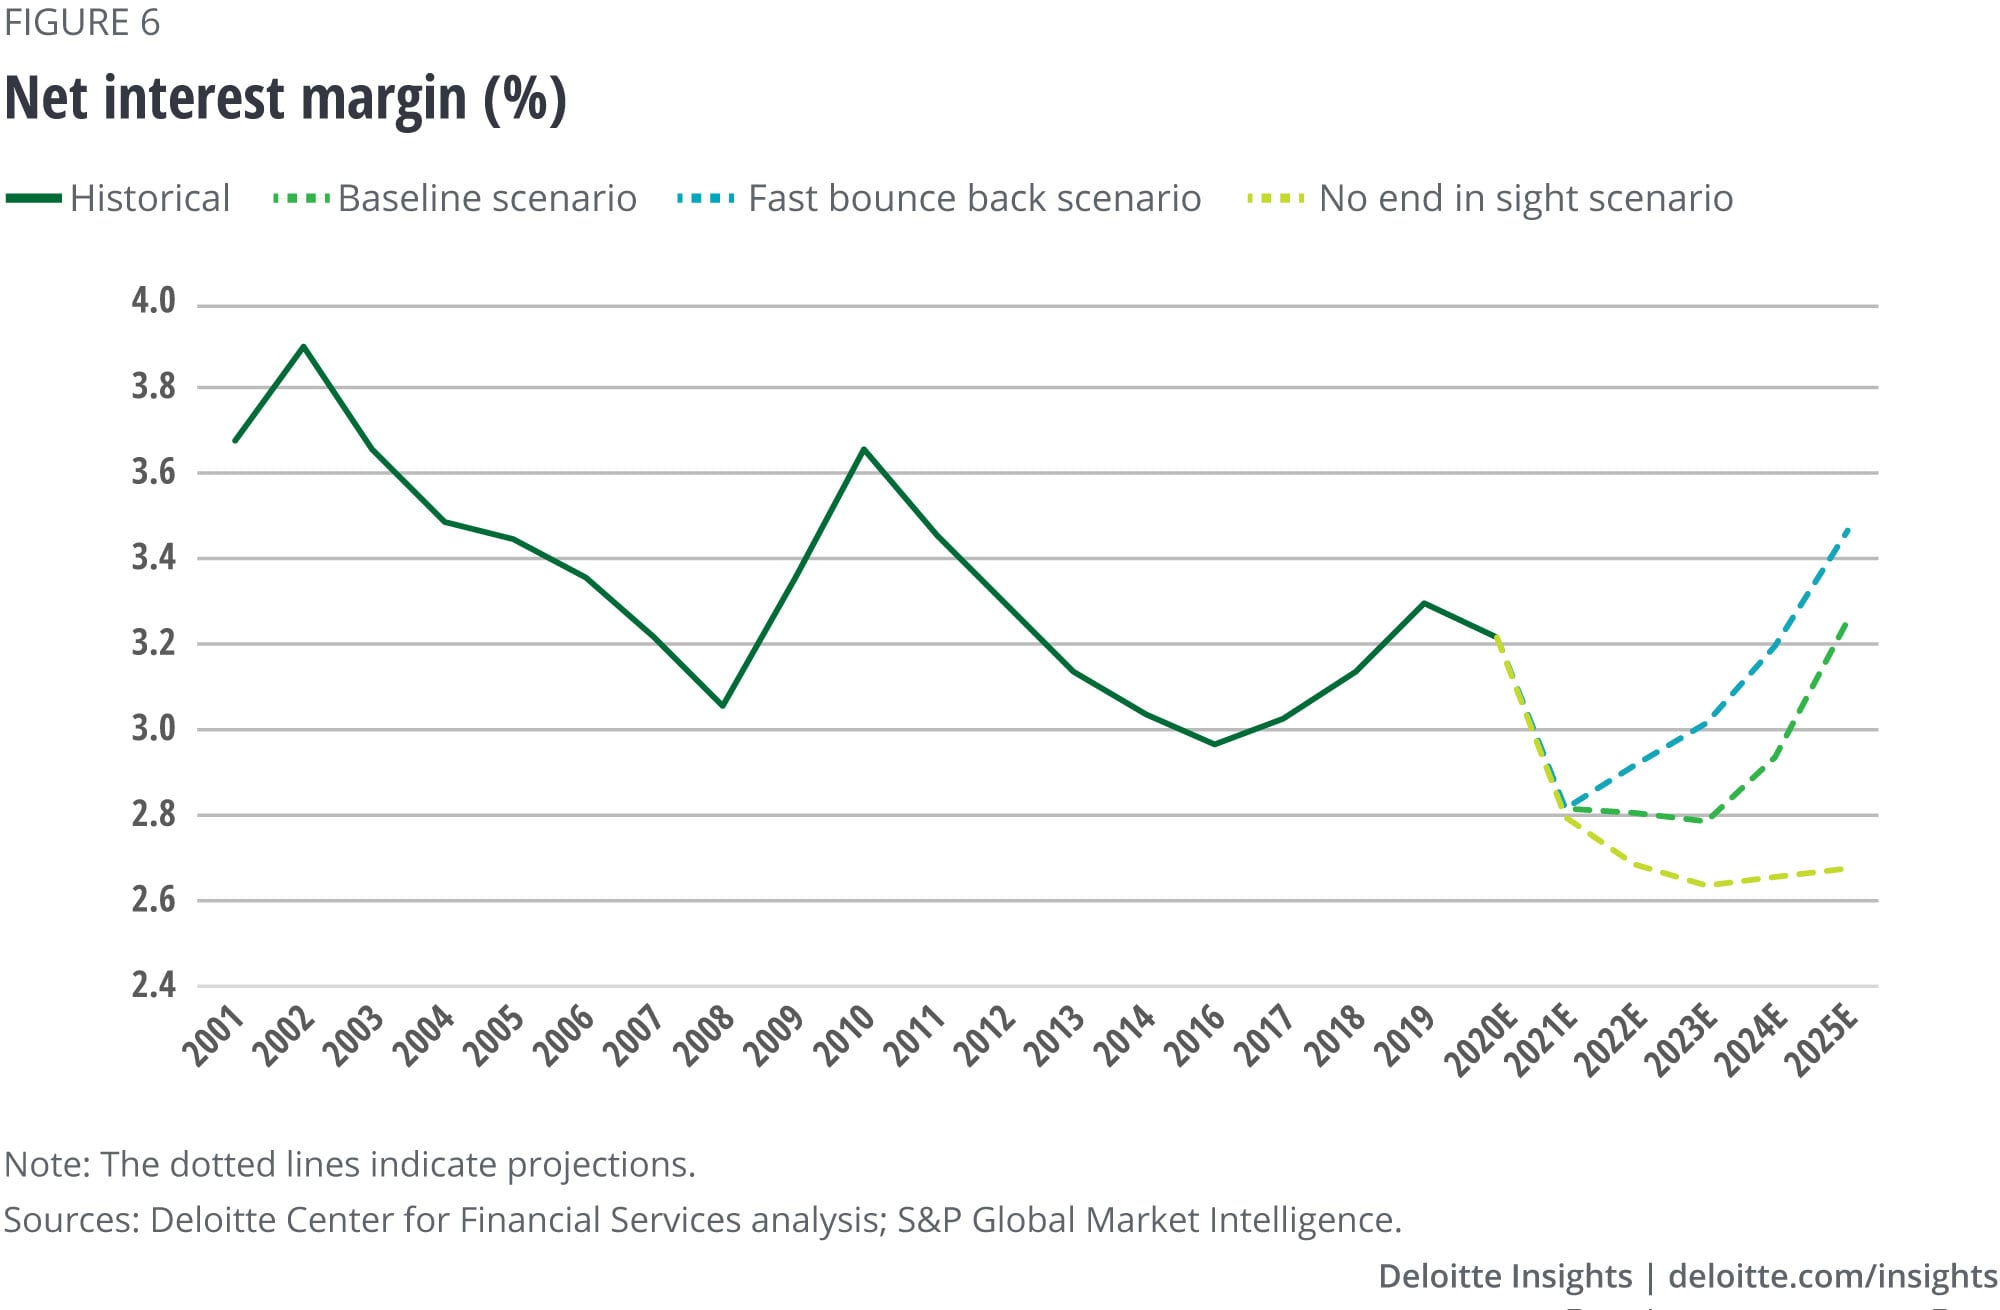
As for interest income, the low-yield environment and tepid loan growth will weigh heavily on net interest margins (NIMs), creating one of the most pressing challenges in improving RoE in the years ahead. NIMs could drop to 2.8% in 2020, driven by falling income yields. Following that, banks may slash deposit interest rates to record-low levels of 30bps in our baseline scenario, supported by the low-yield environment. NIMs should eventually start to recover in 2021–22, driven by an increasing yield environment (figure 6). In our no end in sight scenario, rates remain depressed for years, resulting in persistently lower profitability of banks’ loan-based businesses.
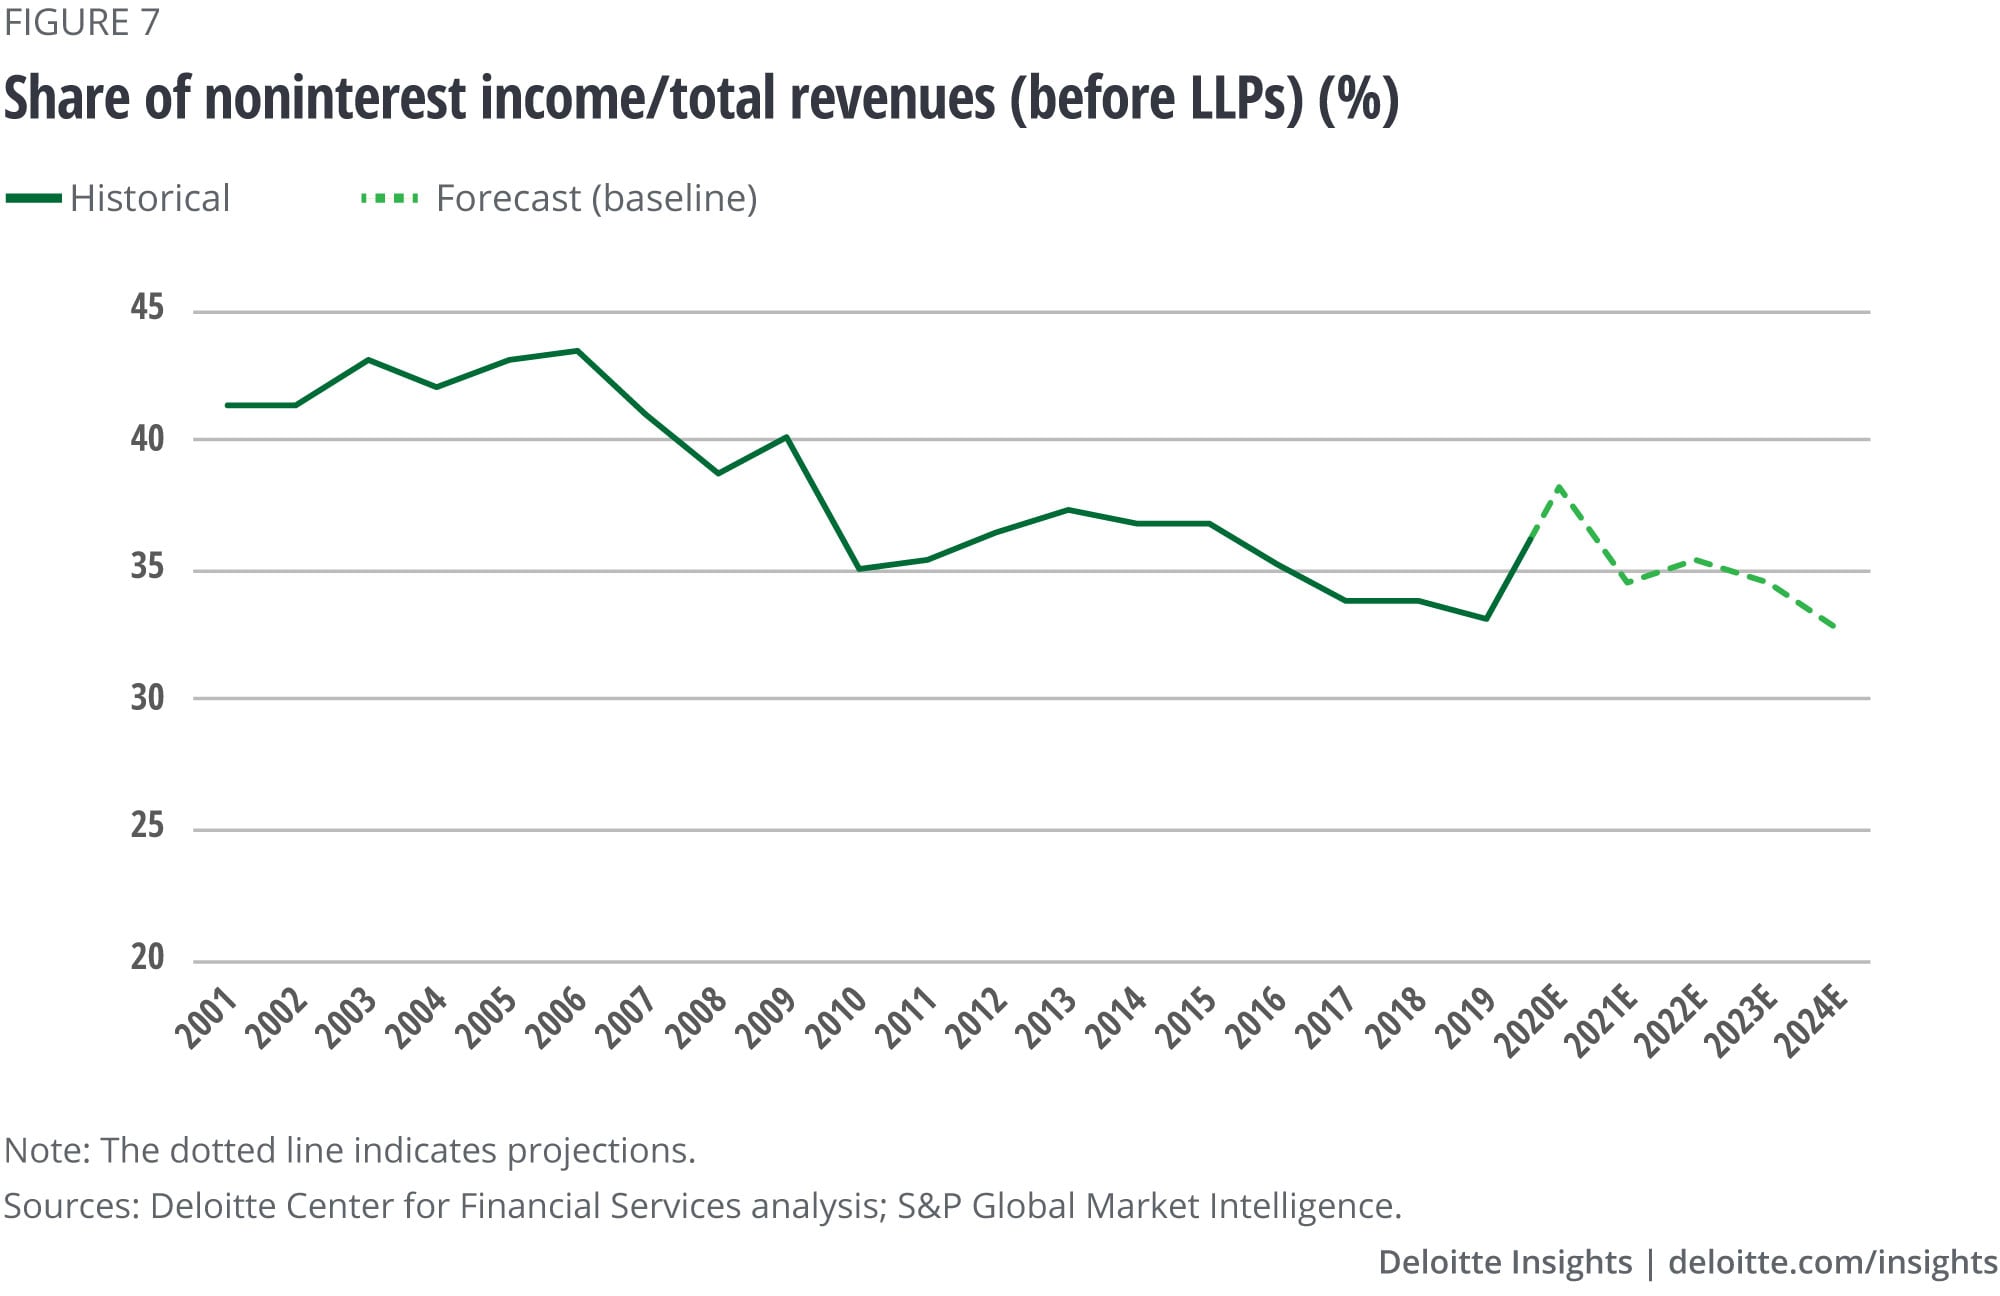
As the pressure on interest income steps up, noninterest income should become one of the bright spots in banks’ recovery. This income could get a boost from trading revenues and from underwriting and servicing various lending programs, such as the Paycheck Protection Program, the Main Street Lending Facilities, and the Primary and Secondary Market Corporate Credit Facilities in 2020. The one-time fees from these activities could go up to US$30 billion.52
Concurrently, banks will likely use the current context to overhaul many fee-based businesses and counter the structural decline in fee margins. Innovation in service offerings and pricing models might be the norm with fee-based businesses.
In our baseline scenario, the share of noninterest income to total revenues stabilizes at the mid-30s and eventually declines slightly as the interest income business grows in an increasing-yield environment (figure 7).
Important questions for banking leaders
- In a persistently low interest rate environment, how should we balance the desire for higher yields with greater credit risk?
- How should we recalibrate risk tolerance and be more selective in underwriting decisions, even as uncertainty persists?
- What are the potential growth areas in the noninterest income businesses given our strengths and strategic aspirations, and what are the necessary steps to drive volume growth?
- How should we prioritize innovation efforts, such as rethinking the product mix and pricing?
Efficiency ratios: Room for improvement
Efficiency ratios, for most banks, have been steadily declining over the last few years, reaching 56.9% in 2019. But, going forward, without any significant structural cost transformation, the efficiency ratio for the industry might increase.
Without some aggressive cost management efforts, however, banks’ long-term viability could be threatened, and therefore leaders should initiate sweeping measures across the board to rationalize cost structures. These may include increasing digitization across the value chain, trimming compensation costs, and rationalizing the branch network. As a result, banks will likely drive a new wave of efficiencies and maintain the current level of efficiency over the next few years, in our baseline scenario (figure 8).
However, should the worst-case scenario (no end in sight) be realized, banks’ revenues would remain depressed, which would require more aggressive cost-cutting efforts.
Rationalizing costs is not a new priority for banks, but the macroeconomic shocks from COVID-19 should make it more of an imperative.

Important questions for banking leaders
- How can we accelerate digital transformation and leverage emerging technologies (i.e., artificial intelligence, blockchain, etc.) to control costs?
- What is our bank’s distribution model? What role will a physical branch network play going forward?
- How can we best manage the cost of talent, deploy alternative talent models, and outsource noncore processes to drive efficiency?
- How could partnerships and ecosystems, as well as shared infrastructure models, help us realize cost efficiencies?
Loan growth will likely be suppressed but should rebound by 2022
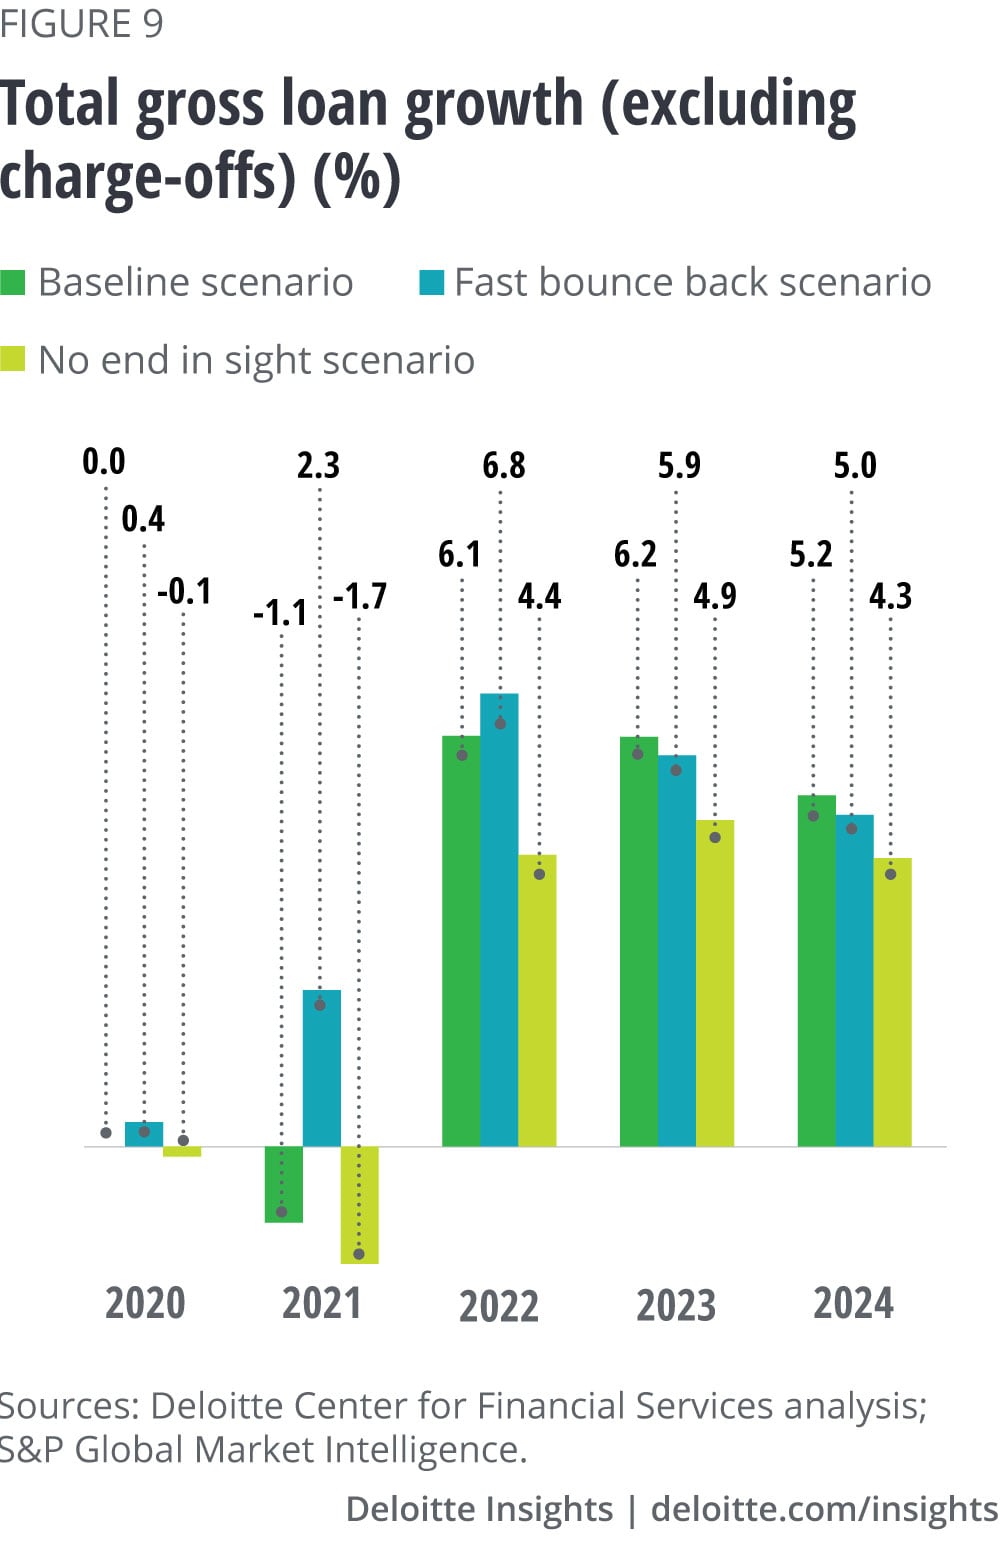
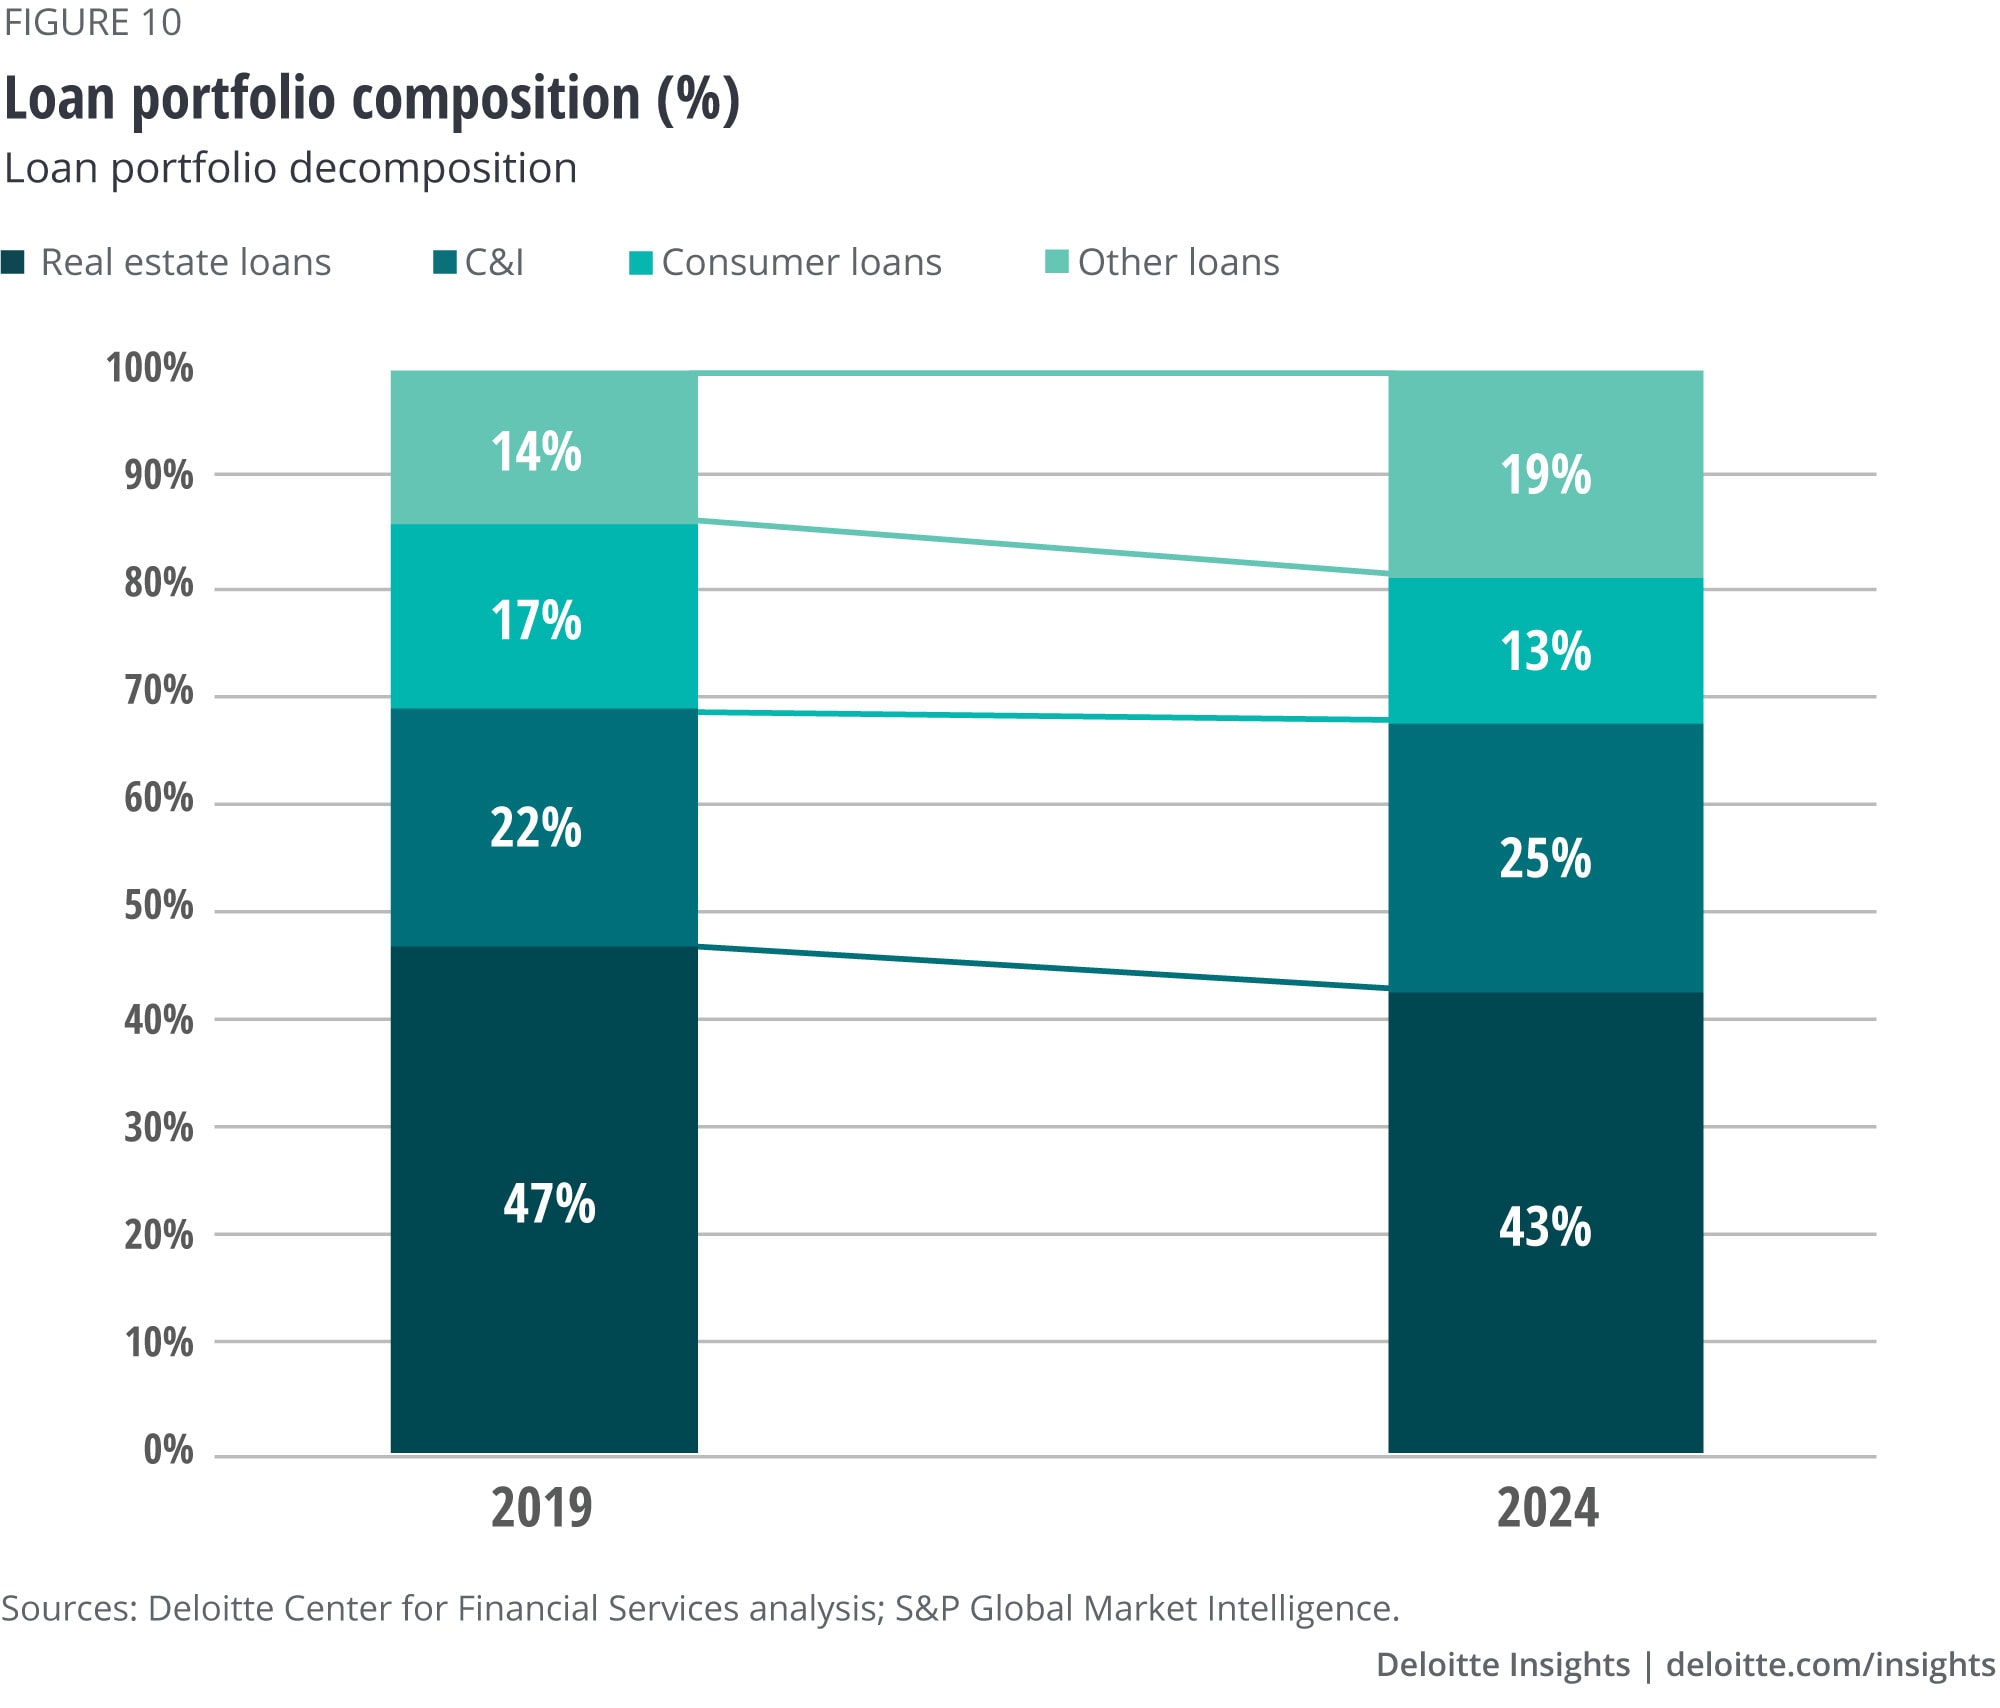
Given the severity of the current economic malaise across all segments, loan growth is very likely to be muted in 2020, and may, in fact, decline in 2021 after government lending support programs expire (figure 9). But, with the economy back in full recovery mode in 2022, growth is anticipated to leap, primarily driven by demand for commercial and industrial (C&I) loans (figure 10). Businesses should significantly ramp up capital expenditures in a rebounding economy.
In the meanwhile, new loan growth from commercial real estate will likely remain suppressed as the industry adjusts to the macro structural forces, such as lower demand for office space and shopping malls.
Residential mortgages, after surprisingly robust demand for new originations and refinancing during the first half of 2020, driven by lower rates, will likely see low single-digit growth in the years ahead, possibly due to a combination of demand and supply factors.
As for credit cards, the dent to consumer spending from the economic shutdown could hurt growth over the next couple of years. A 5.3% decline in outstanding credit card debt (before charge-offs) is expected in 2020, which stood at US$760 billion in mid-June 2020, down from its recent high in March of US$860 billion.53 Consumers aren’t likely to be back in spending mode until 2022. Auto loans could also drop, and may even see a steeper decline over the next couple of years.
Important questions for banking leaders
- How can we pick the right spots of growth, in keeping with the bank’s core strengths and areas of expertise? Which targeted areas will require further investments?
- How can we balance underwriting higher-yielding loans and risk exposure within the C&I space? How can we manage underwriting goals; how would we need to reset incentives for loan managers?
- What incentives/rewards and strategies should we deploy to attract consumer loan growth without jeopardizing profitability?
- How can we free up balance sheet capacity, and what new requirements may have to be met to tap the securitization market?
Deposits should continue to grow, even in a near-zero interest rate environment
Higher savings, decreased spending, and cash hoarding by both consumers and corporations should supply ample levels of deposits to US banks. In fact, bank deposits have already swelled—by nearly US$2 trillion—since the onset of COVID-19.54 This is truly an unprecedented flow of funds into the banking system in such a short period.
Liquidity will likely remain a premium as banks wade through the pandemic-induced economic stress. As a result, banks will likely hold a significantly higher-than-usual amount of cash on their balance sheets over the next two years.
Given the abundant supply, banks would have no reason to offer higher interest rates to attract deposits (figure 11). In fact, they may even drop the rates to levels unseen before, prompted by the near-zero federal funds rate for the foreseeable future. As a result, an uptick in deposit pricing after 2022 is possible only in our best-case scenario, given an earlier rebound in the yield environment.
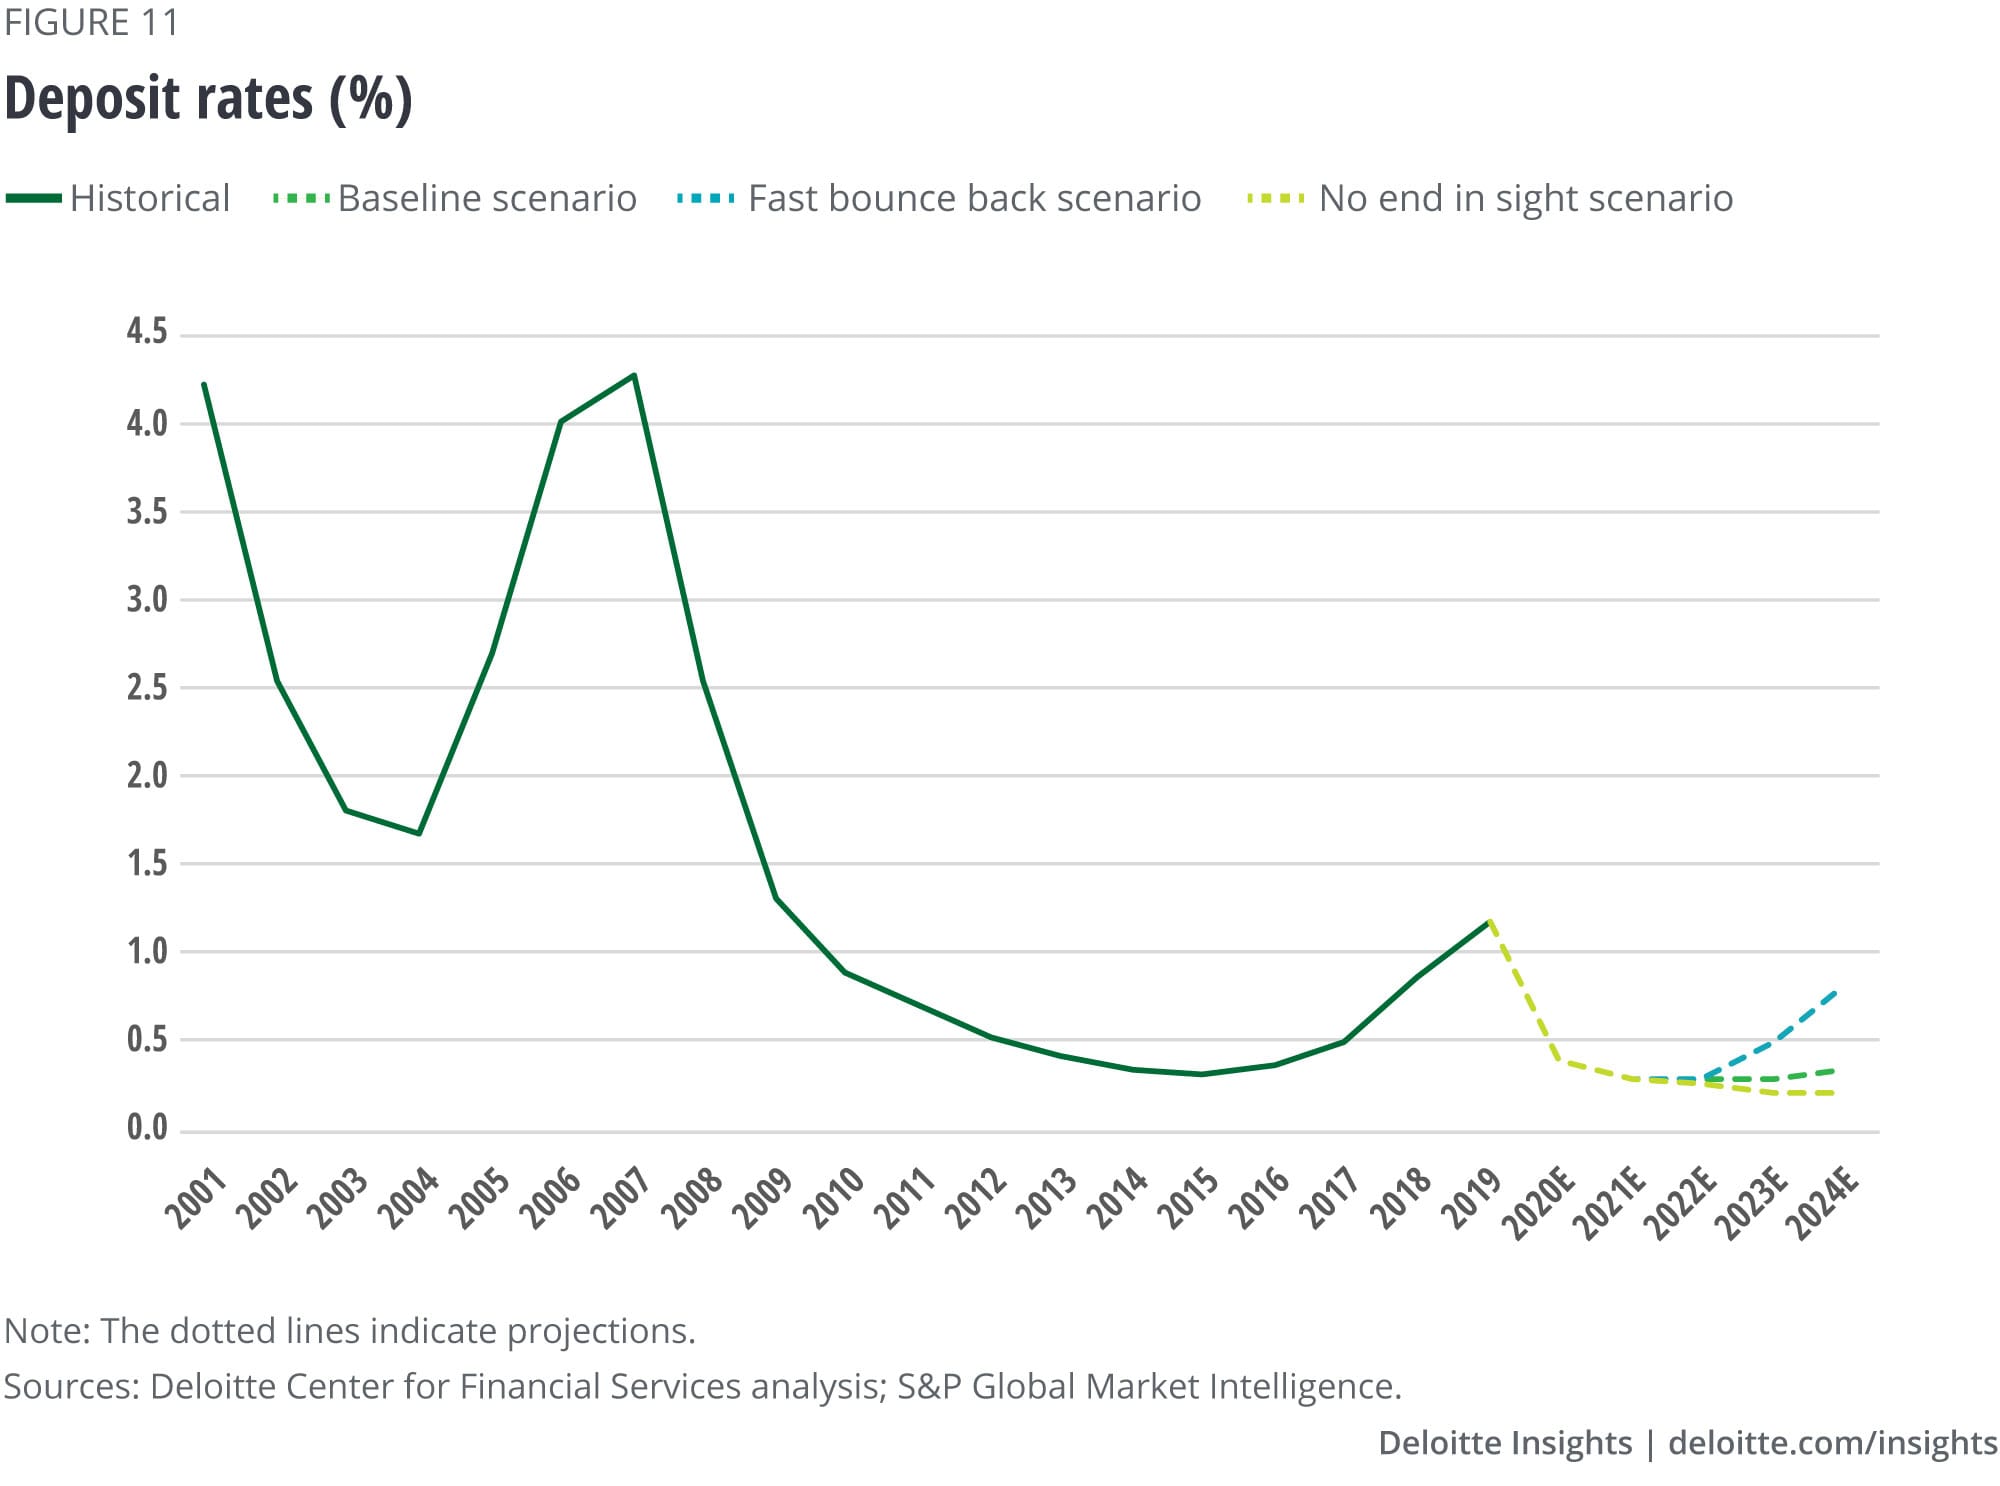
Repricing deposits down the curve can help banks maintain lower funding costs and support NIMs, particularly when yields start to increase. Deposit repricing on the upside usually lags in an increasing yield environment, which can result in a widening spread for banks.
So, what banks do with surplus deposits could remain a formidable challenge for the next several years.
Important questions for banking leaders
- How can we reprice deposits with minimal depositor backlash or consequences?
- To ensure longer-term stability of deposits, how could we rejigger deposit products to lock in longer maturities at very low funding rates?
- How can we grow deposits differently than through price? What role will digital channels play in deposit-gathering going forward?
Despite high charge-offs, capitalization is expected to be fairly robust
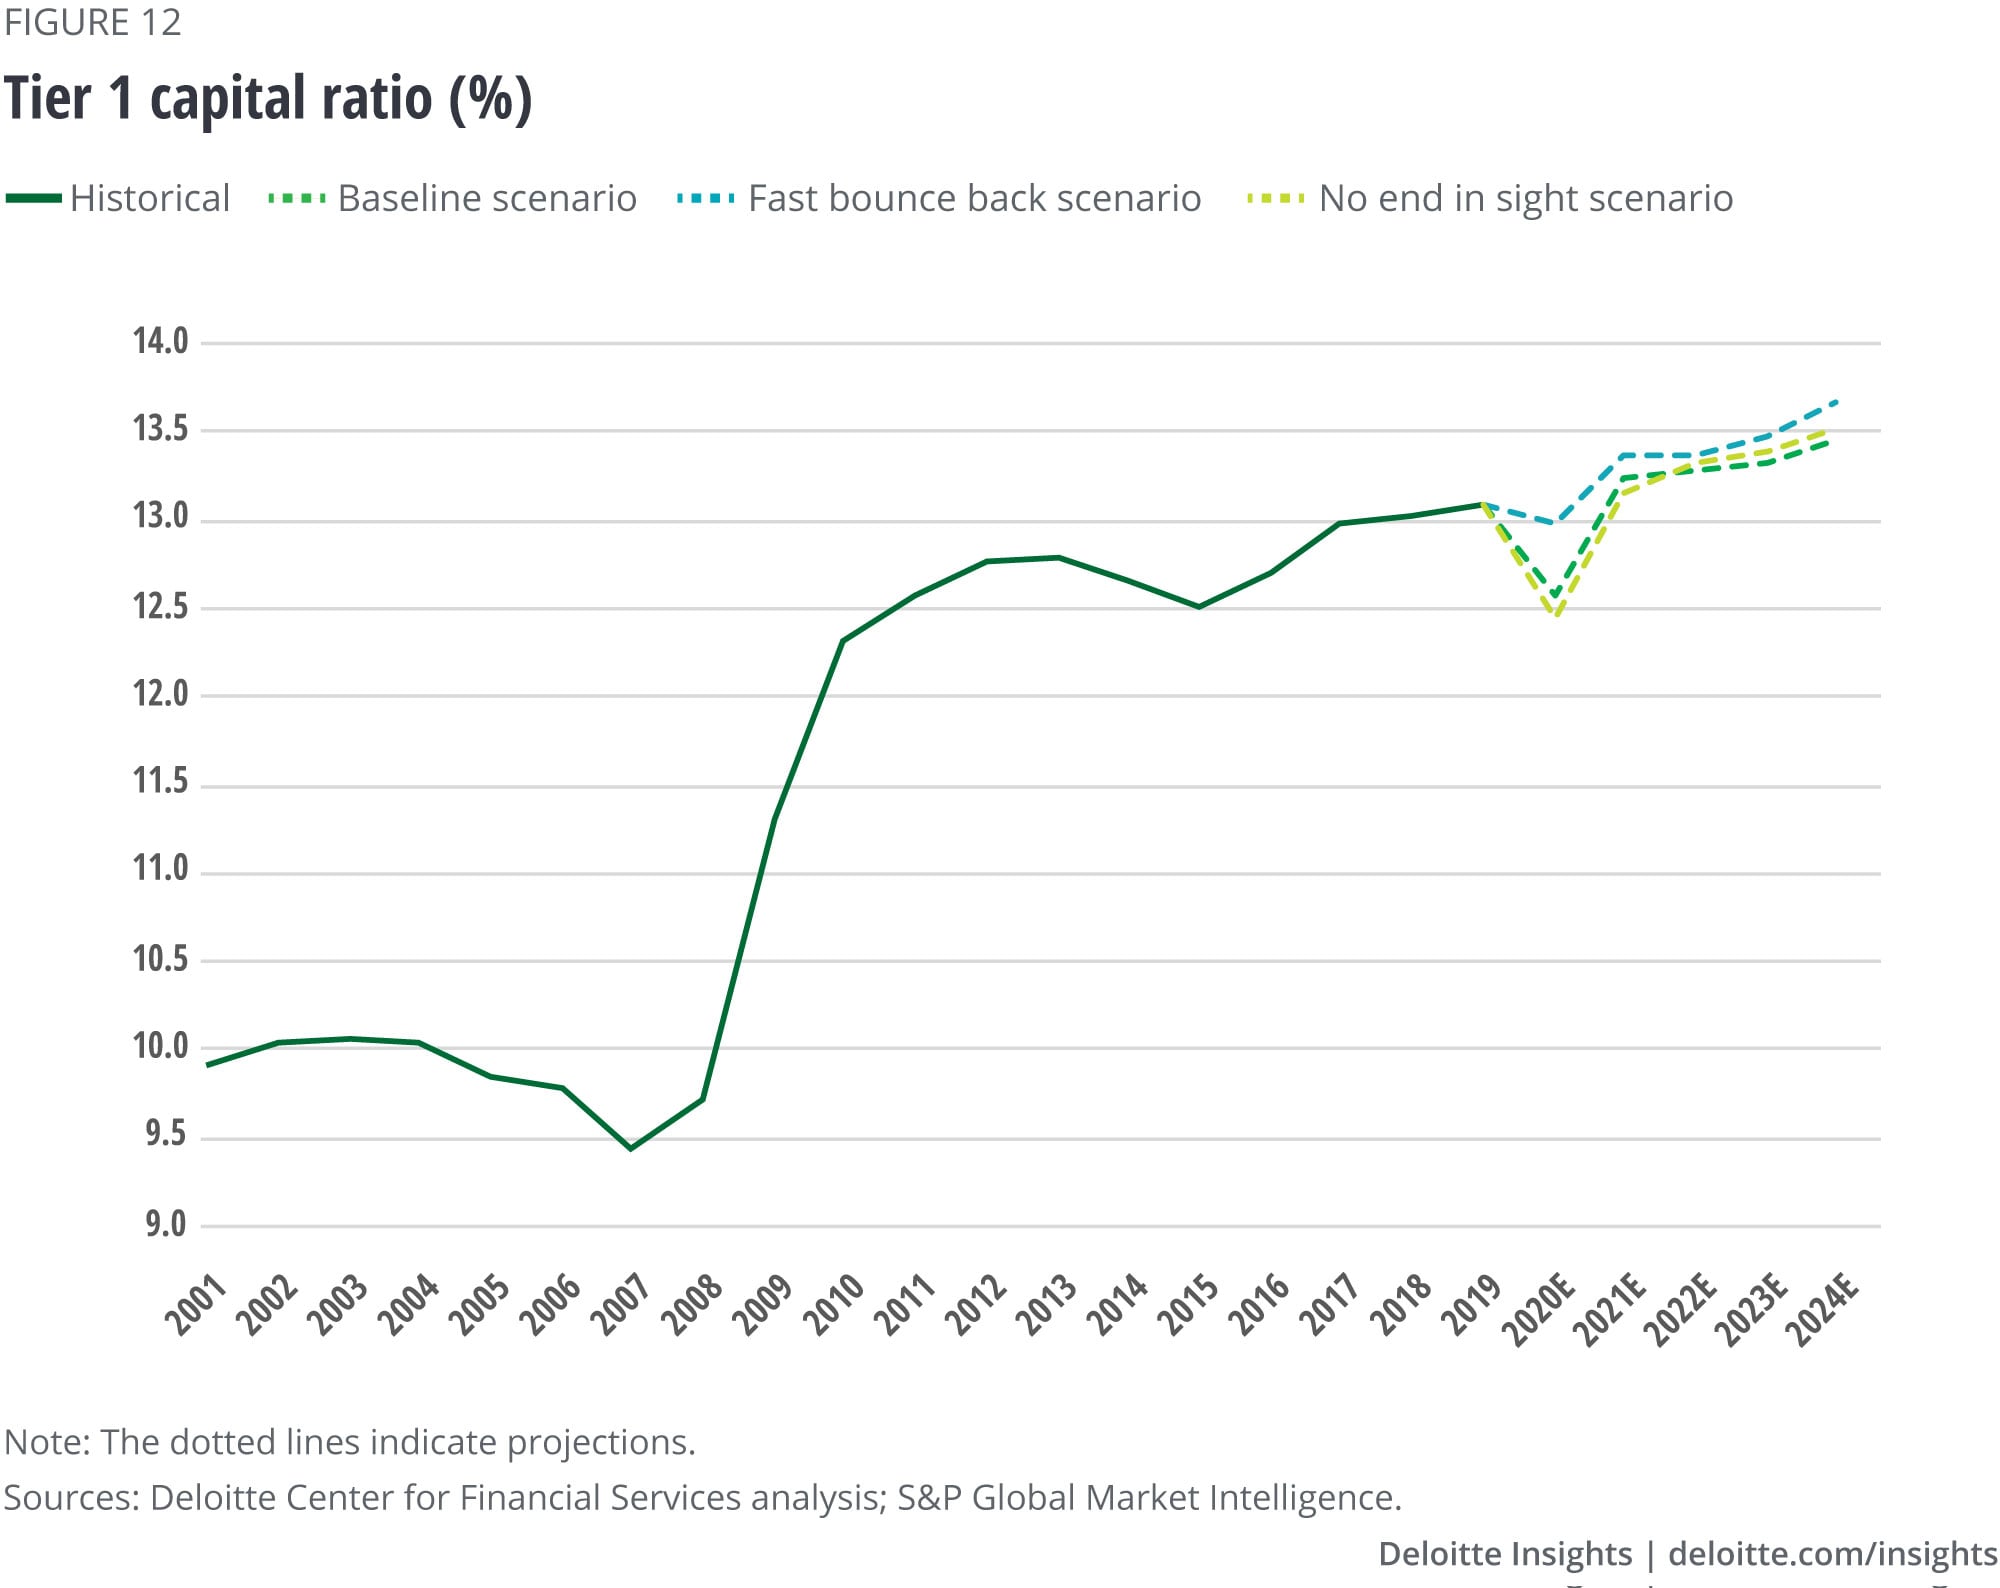
Despite the higher loan-loss provisions and a drop in Tier 1 ratio to 12.5% in 2020, US banks are expected to maintain strong levels of capital (figure 12). Anticipating the spillover from the macroeconomic shocks from COVID-19, banks had already reduced extraordinary capital return programs (i.e., share buybacks) in Q1 2020.
Most banks are expected to continue to pay dividends to maintain their profile among investors, although banks at the bottom tier of performance may be forced to cut capital distributions. Overall, absolute payouts should remain elevated due to the reduction in the corporate tax rate in 2018.
Banks able to retain a high level of capital will be well positioned to undertake strategic endeavors, such as M&A, to achieve scale. They could possibly even resume stock buybacks to shareholders, with regulators’ blessing.
Strategic choices banking leaders face
As highlighted in this report, banks will likely need to make strategic realignments on multiple fronts to recover from the effects of the COVID-19 pandemic. The industry restructuring that is expected to ensue could also create a new set of leaders and followers.
Our projections for the US commercial banking industry performance in the next five years does not mean each individual bank’s fate is preordained. Banking leaders now face a set of strategic choices. They can, to a large extent, shape the trajectory of their institution’s success in the post-COVID world. Despite all that is yet to come from the COVID-19 pandemic, banks that are in a position of strength can chart a new path to long-term, sustainable profitability. As the economy reopens, resilient bank leaders should embark on the next phase to recover and then thrive.55
Here are some key action steps banking leaders should consider as they navigate the current crisis:
- Think big. Extraordinary times call for bold ideas.
- Create a resilient foundation. Focus on business and operational resiliency with an eye toward maximizing long-term value.
- Transform business models to absorb future shocks better. Seek new pockets of growth to drive growth in fee income. This has been a goal for some time now, but going forward, with suppressed NIMs, leaders should focus more intensely on noninterest income.
- Aim for scale. Strategic investments in technology do not come cheap. And without scale, such undertakings may become cost prohibitive.
- Embrace digital migration. COVID-19 has accelerated the migration to digital interfaces in banking. Leaders will need to sustain this momentum to maintain a competitive edge in the front-office and in back-office operations. Agility could be essential. Pursue platform modernization with an appreciation for how various market, financial, and technology trends will likely converge.
- Focus on structural cost transformation. After addressing immediate opportunities to relieve bottom-line pressure in line with COVID-19 strategies, lay the foundation for future recovery and sustained operational excellence through structural cost transformation.
- Explore strategies for consolidation. COVID-19 could expand the valuation chasm between banks. This will likely result in an uptick in M&A, especially among small- and mid-sized banks seeking growth opportunities.
- Reimagine the role of branches. The current crisis has demonstrated that deposit-gathering and customer service can be successfully executed outside the branch network. As a next step in branch network transformation, banks can focus on acquiring new customers and selling complex products through digital channels.
- Realize the future of work is here. The distributed workforce model during this crisis has only accelerated changes in work as well as where it gets done. Bank leaders will need to understand not just changes to the nature of work (the what and the how) but also the workforce (the who) and the workplace (the where)—and the myriad ways in which they are interrelated.
- Reimagine capital optimization. As new business and operating models emerge, leaders will need to determine how best to deploy capital to maximize outcomes—but these outcomes will need to expand. To thrive in the post-COVID environment, banks should go beyond measuring financial performance to evaluate their social impact as well.
Our insights can help you take advantage of change. If you’re looking for fresh ideas to address your challenges, we should talk. View our services page.
Contacts
Mark Shilling |
Max Bercum |
Vik Bhat |
Gopi Billa |
Corey Goldblum |
Jason Marmo |
Troy Vollertsen |
Deron Weston |
Jim Eckenrode |
Val Srinivas, PhD |
David Zierler
|
|
View sector performances
Impact on personal and commercial auto insurance
With people generally driving a lot less due to the pandemic, personal and commercial auto insurance carriers should expect to see a steady decline in premiums written for the next several quarters, and perhaps even for years. But given the lower traffic density, profitability could get a boost since fewer accidents would likely result in fewer claims.
Coronavirus-related shutdowns and restrictions, along with the resulting slowdown in economic activity, led to a year-over-year drop of 40.2% in miles driven by US drivers in April 2020 and 25.5% in May 2020, according to the latest available data from the Federal Highway Administration.56 The Freight Transportation Services Index, an indicator of commercial auto activity, was also down year-over-year by 13.7% in April and 11.9% in May.57
Although reports suggest that driving trends have started to normalize in recent months,58 persistent health concerns, a greater acceptance of remote working, and an ongoing economic slowdown could result in reduced vehicle usage for quite some time.
Our baseline forecasting scenario suggests that a combination of factors prompted by the pandemic could result in a decline of 6.2% in personal auto insurance premiums written, and 3.5% for commercial auto in 2020.
For personal auto, the premium drop could come in the form of refunds or dividends to policyholders, as well as premium discounts upon renewal. Most personal auto carriers returned between 10% and 25% in premiums to customers during March, April, and May to account for the vastly lower number of miles being driven.59 However, these credits are likely short-term in nature and may only impact premiums in quarters two and three of 2020. Premium volume may be restored once carriers complete their COVID-related returns and driving starts to return to normal levels.
If, on the other hand, insurers offer premium discounts going forward on new and renewal policies due to more systemic changes in driving patterns, that could have a longer-term impact on personal auto premium volume. Indeed, our actuarial team anticipates single-digit rate decreases for the next several quarters, which would keep personal auto premiums well below prepandemic levels until 2023.
For commercial auto, meanwhile, premium credits were not nearly as ubiquitous as in personal auto due to the disparate risks of different client businesses.60 Yet an overall decline in commerce due to a pandemic-triggered slowdown in the economy will likely keep premiums below prepandemic levels at least until 2022.
Working with our actuarial team, we created a model to forecast net written premiums for auto insurance for 2020, 2021, and 2022 under three different scenarios envisioned by Deloitte’s economics team: Baseline, no end in sight, and fast bounce back61 (see the sidebar, “Forecast methodology”).
The bottom line: Forecast findings
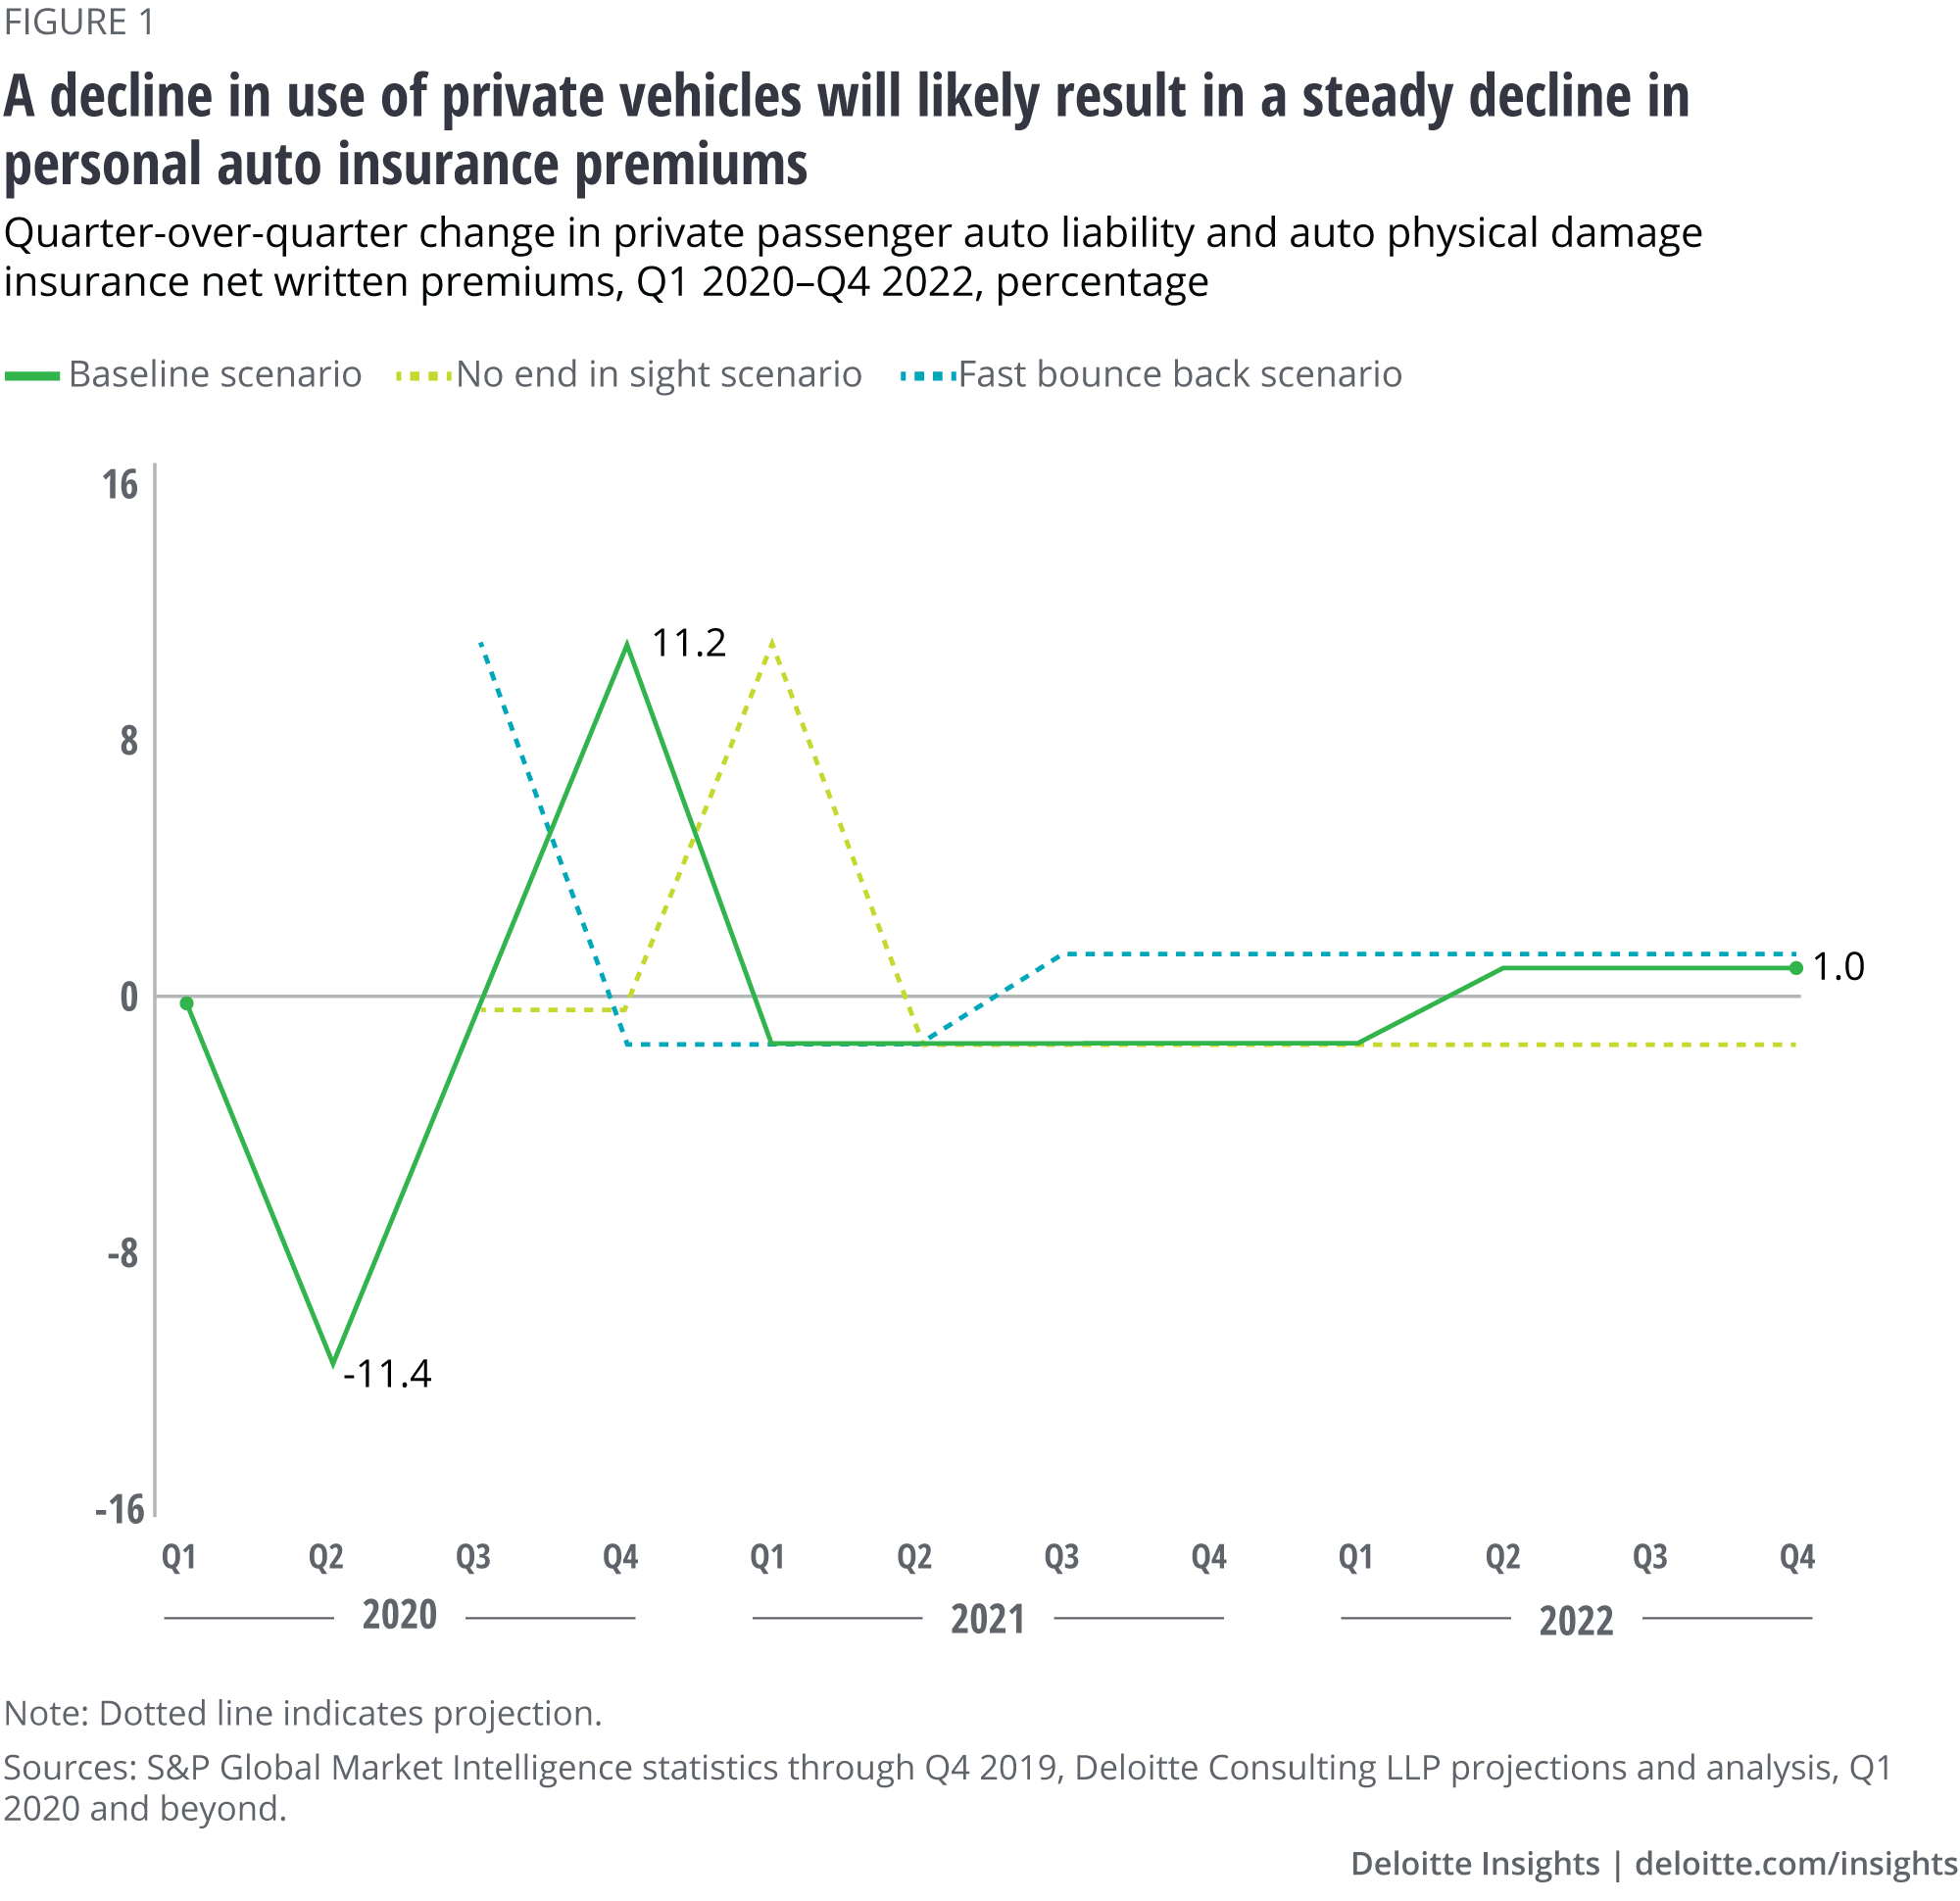
In our baseline scenario, personal auto net written premiums may have dropped by as much as 11.4% quarter on quarter (QoQ) in Q2 2020, mainly driven by premium returns to policyholders. Premiums could stage a comeback with a quarterly rise of 11.2% in Q4 2020 if carriers end premium refunds. That said, due to decreases in rates, premiums are expected to decline 1.3% QoQ from Q1 2021 to Q1 2022 (figure 1).
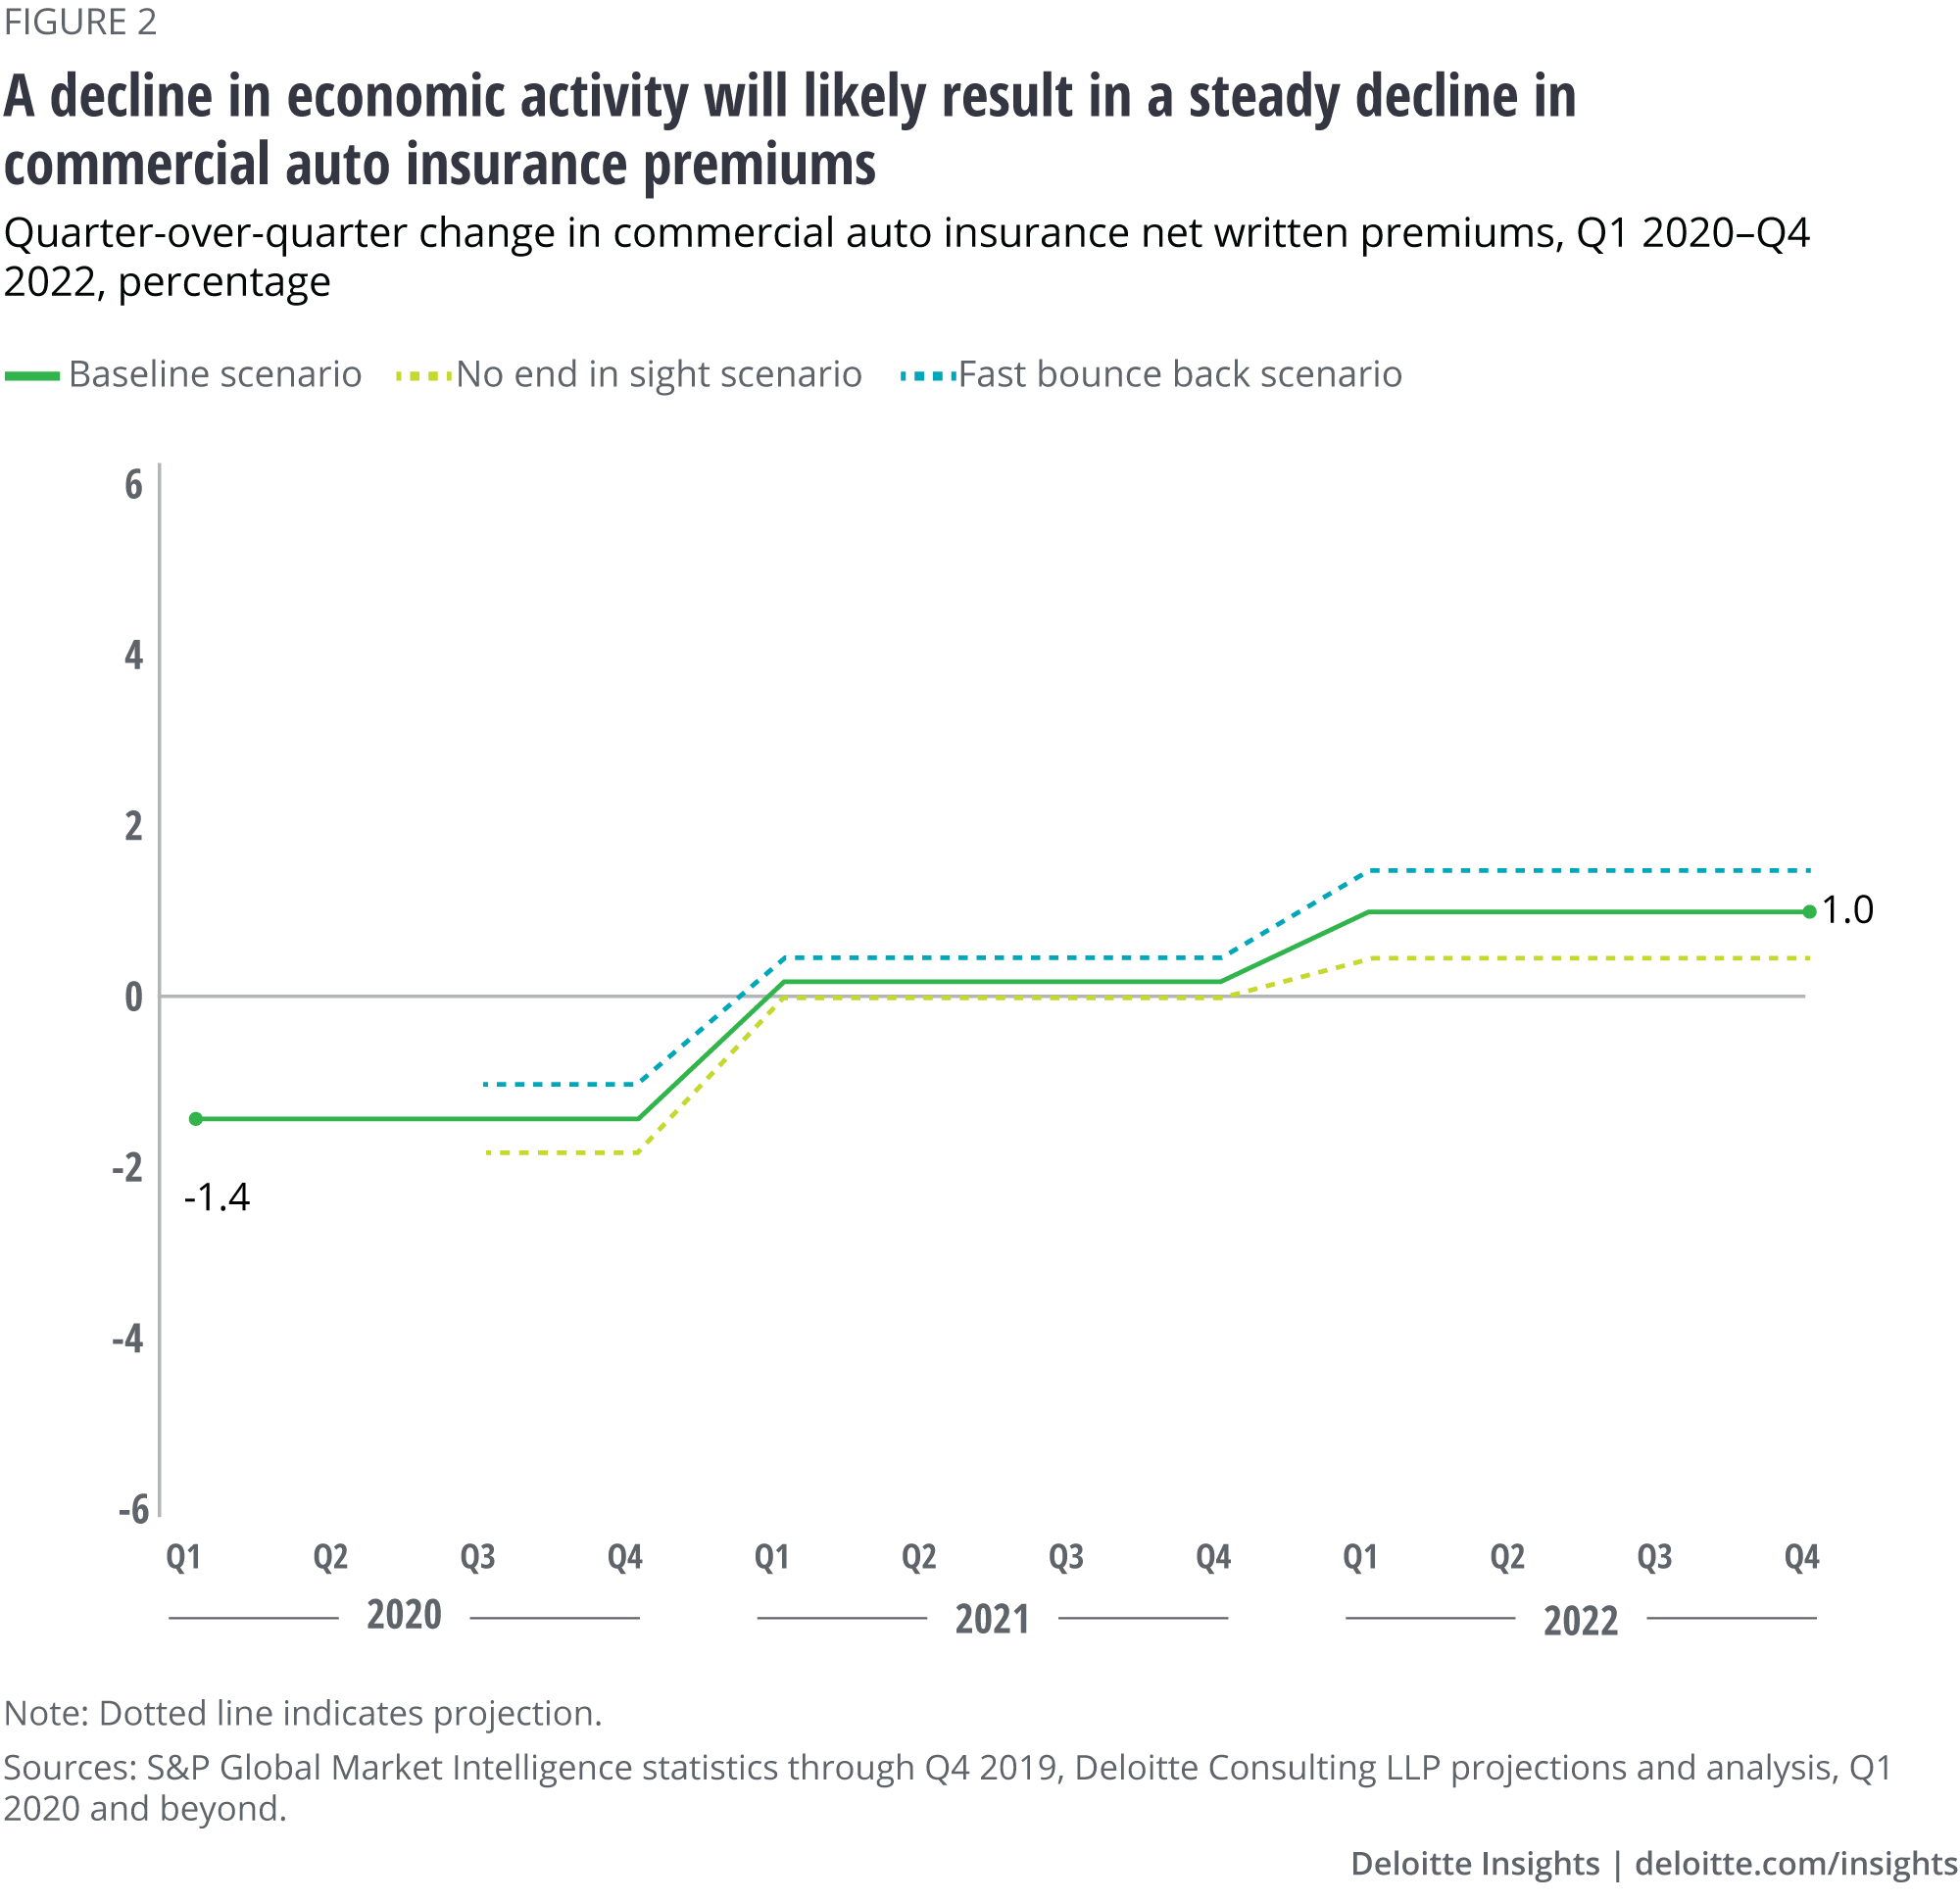
There is a much smaller drop and less volatility anticipated for commercial auto. In the baseline scenario, net written premiums could slide 1.4% QoQ for all of 2020 due to the economic slowdown, while remaining flat in 2021. Commercial auto could return to growth, but with a quarterly rise of only about 1.0% in 2022 (figure 2).
Our no end in sight and fast bounce back scenarios result in varying levels of premium returns and rate declines. The duration and level of premium returns are expected to be key factors in determining when personal auto premiums might make a comeback.
Note: Carriers are required to file net written premiums on an annual basis only and not quarterly. Quarters can have higher or lower net written premiums based on when policies are bound. For the purposes of this analysis, Deloitte assumed equal net written premiums across four quarters for all projected years.
There is a silver lining, however, for auto insurers: Fewer miles are being driven. Reduction in traffic density normally lowers claim frequency, since roads are safer with fewer vehicles. Ultimately, this should help improve the industry’s bottom line.
In fact, S&P Global expects the personal auto combined ratio (representing the combined insured loss and expense ratio versus a premium dollar written, indicating an overall underwriting profit or loss) to fall to a profitable 93.1% in 2020—an 8.9 percentage point reduction compared to the 102% average for 2015–2019. Meanwhile, the combined ratio for commercial auto insurers could improve by 6.3 percentage points, from an average of 109.5% for 2015–2019 to 103.2% in 2020.62 This will likely be a welcome relief for auto insurers—especially for commercial carriers, which entered 2020 having nine straight years of above-100 combined ratios.63
Calls to action for auto insurers
Here are some potential actions auto insurance carriers could take to help mitigate risk, protect their brands, and respond to market shifts as a result of the pandemic:
- Leverage data analytics. Insurers without usage-based technology will likely have to develop alternative methods of managing their exposure, as past driving and accident patterns can no longer be relied upon to project future exposure. They should seek external data sources for new expectations around miles driven, traffic congestion, and the like to improve risk selection, underwriting, and pricing capabilities.
- Focus on structural cost transformation. After addressing immediate opportunities to relieve bottom-line pressure in line with COVID-19 strategies, insurers can lay the foundation for future recovery and sustained operational excellence through structural cost transformation in distribution, underwriting, and claims.
- Manage reputational risk. Carriers should also focus on managing potential reputational risks by continuing to demonstrate social responsibility and empathy for clients, claimants, and society at large. This may include using analytics to better anticipate client needs, providing positive experiences in managing claims, and remaining flexible with coverages and payment plans.64
Forecast methodology
The Deloitte Center for Financial Services joined with the actuarial practice of Deloitte Consulting LLP to forecast the potential impact of the COVID-19 pandemic and the ensuing economic slowdown on net written premiums of key property-casualty lines. We studied several macroeconomic and line-specific parameters over the past 25 years to determine their impact on the premium volume of different lines of business during various economic cycles.
For auto insurance, we studied the change in net premiums written in past boom and downturn cycles. We projected quarterly auto insurance premiums for the next 12 quarters, starting from Q1 2020 through Q4 2022, under three different scenarios posited by Deloitte’s economics team:65 baseline, no end in sight, and fast bounce back.
The current situation is fluid and these projections are based on information known as of July 28, 2020. As the world continues to combat COVID-19, the impact on auto insurers will continue to evolve.
Our insights can help you take advantage of change. If you’re looking for fresh ideas to address your challenges, we should talk. View our services page.
Contacts
Matt Carrier |
Jim Arns |
Sam Friedman |
View sector performances
Impact on US banks’ commercial real estate loan portfolios
There are increasing signs of distress in the US commercial real estate (CRE) market. New distressed CRE assets66 per quarter reached $30.4 billion in Q2 2020, a fivefold jump from $6.2 billion in Q1 2020, and just shy of the peak of $35.5 billion hit in Q4 2009 during the 2008–09 global financial crisis (GFC).67 CRE sales volume and valuations have also declined significantly since the onset of the pandemic.68
Banks currently have $2.2 trillion in loans to the US CRE sector.69 The share of delinquent and nonaccrual loans increased to 93 basis points (bps) in Q2 2020, up 5 bps quarter over quarter (QoQ) and 25 bps year over year (YoY).70 In response, most banks increased the loan-loss provisioning for CRE assets in Q2 2020.71
Will CRE loan losses reach levels seen during the GFC? They are not expected to. Rent collection has remained healthy for most property types,72 public real estate investment trusts (REITs) are better capitalized, and borrowers have drawn on credit lines to shore up liquidity. 73 And, after an initial decline in April, CRE asset prices have recently stabilized.74 Finally, unemployment in the construction sector declined to 8.9% in July, recovering nearly one-half of the 16.6% level recorded in April in just three months.75
While loan losses in banks’ CRE portfolios may increase as government stimulus payments phase out and banks’ forbearance efforts end, they should remain significantly below levels experienced during the GFC.
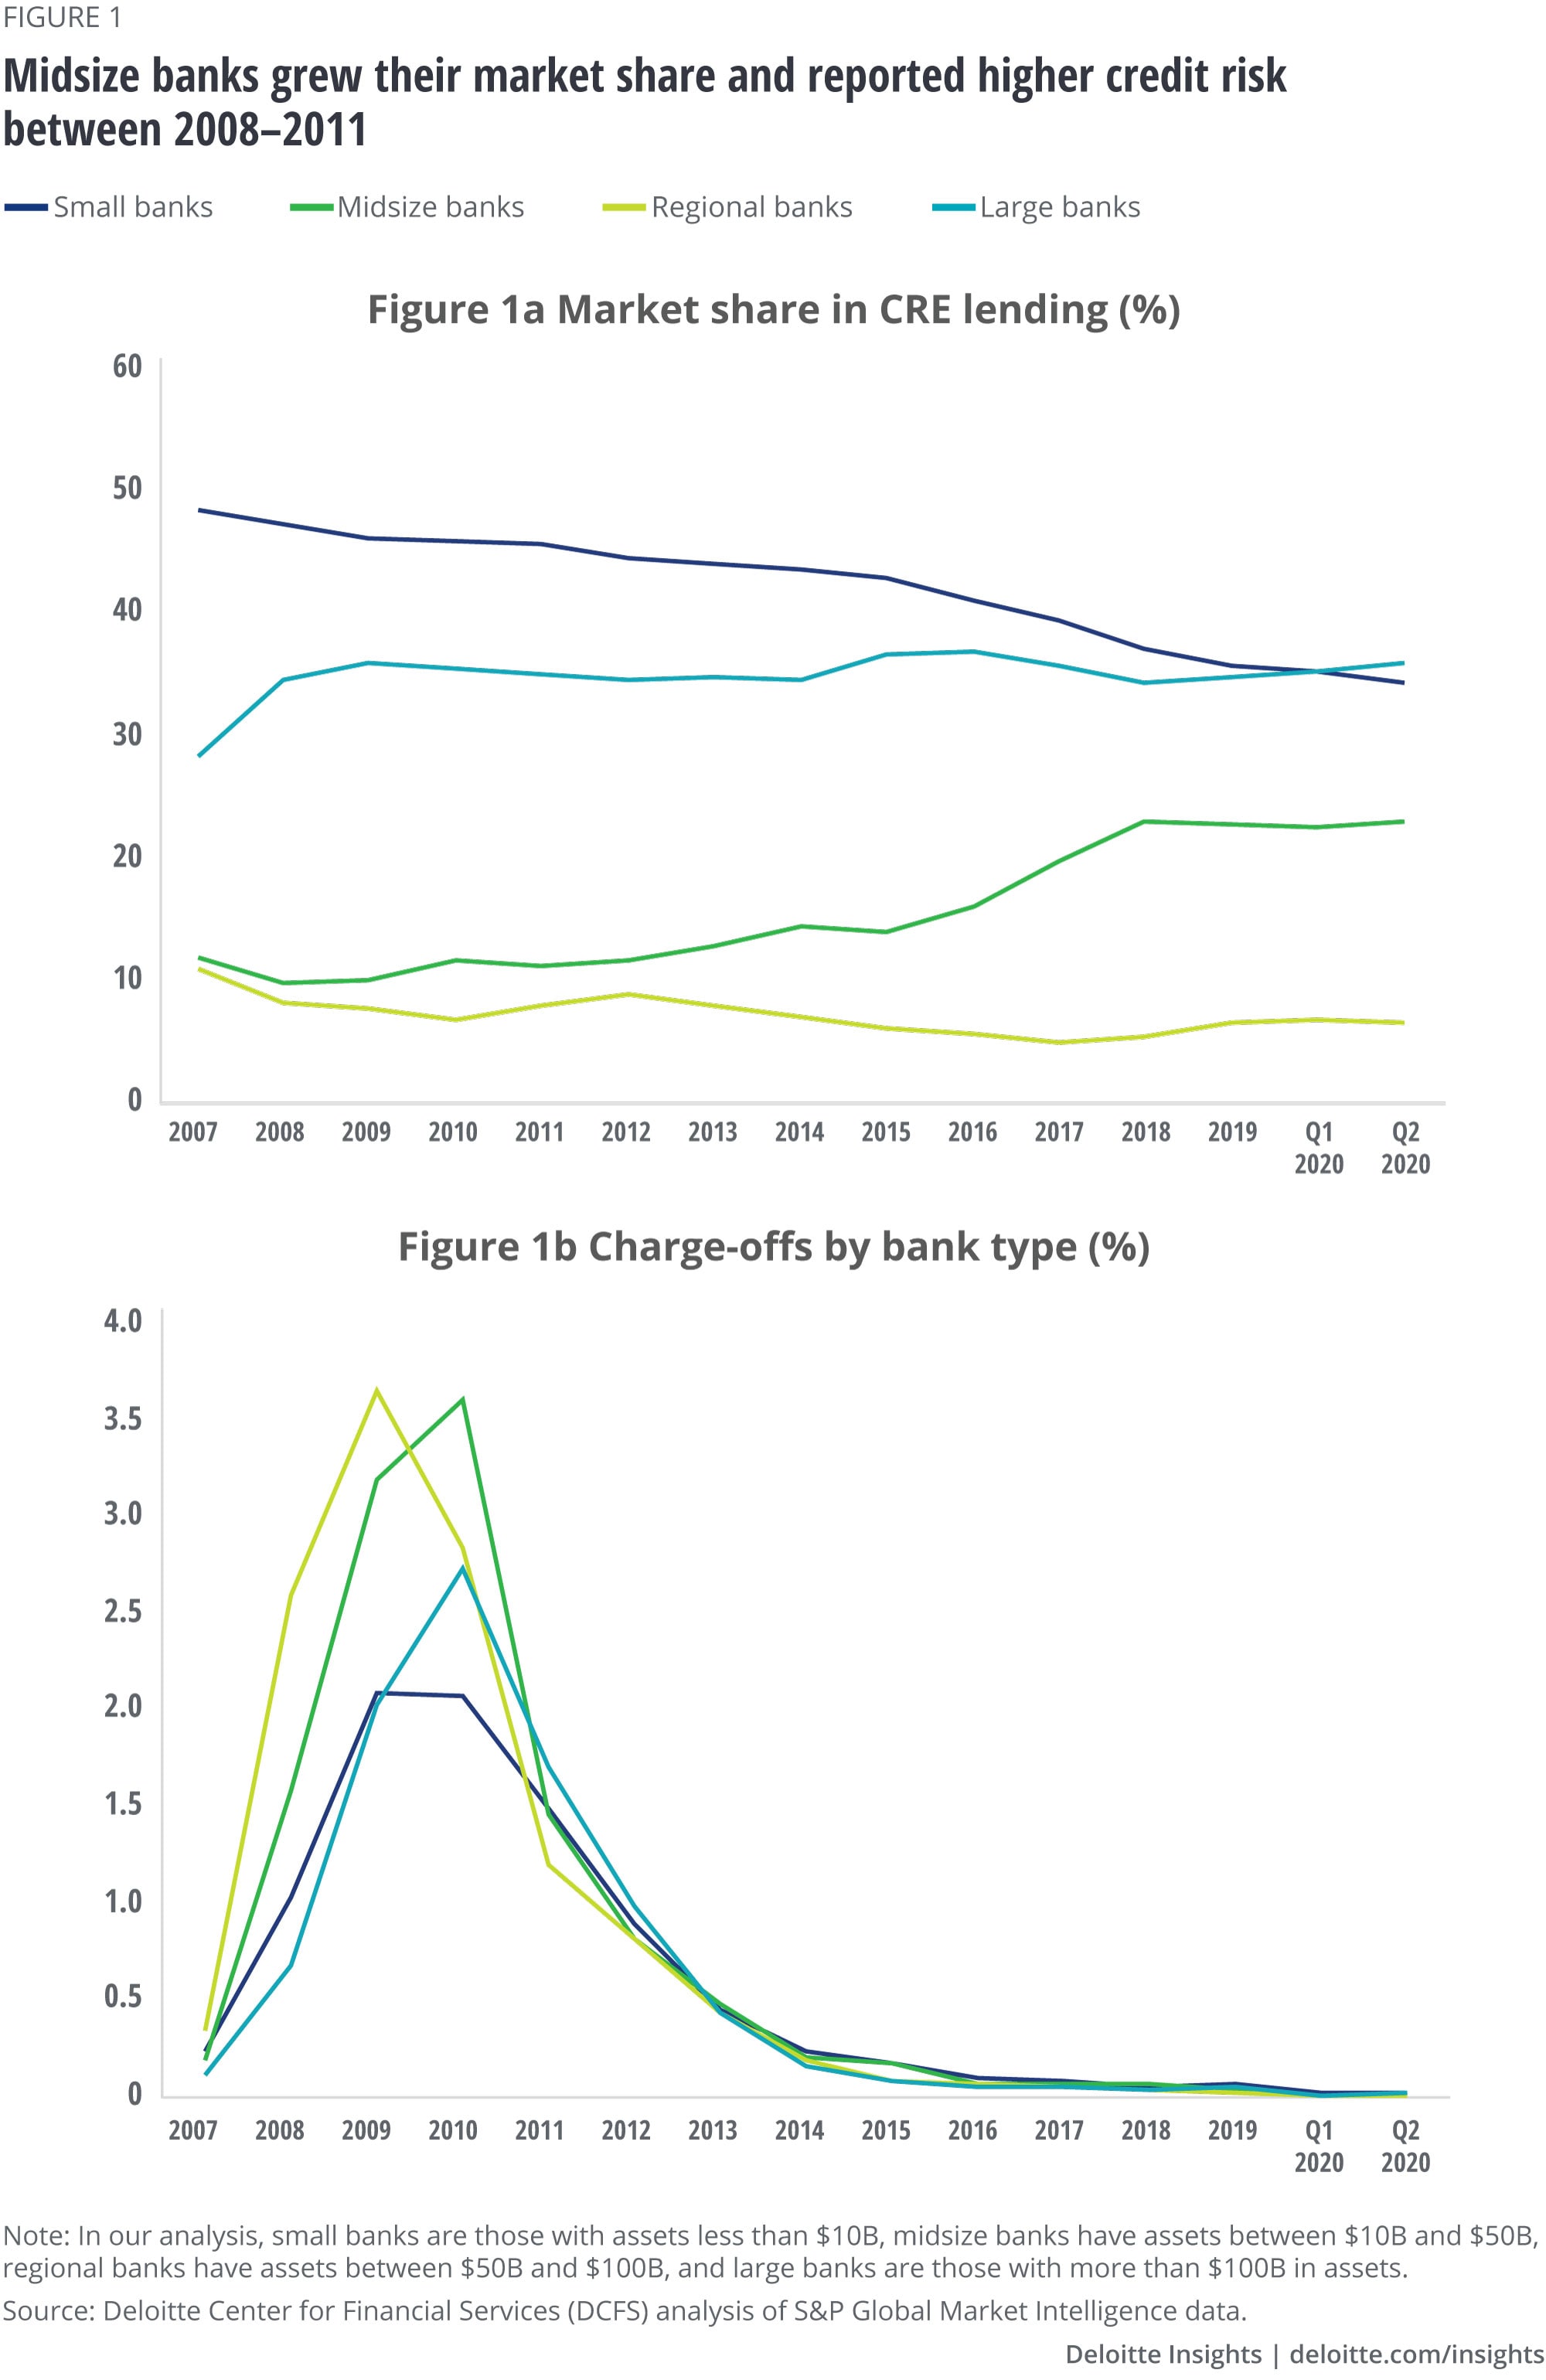
Given the diversity of CRE properties in most banks’ loan mix, loan losses will likely vary geographically and by property type, depending on how much they have been negatively impacted by the pandemic. Some banks may be more vulnerable to CRE loan losses than others. For example, midsize banks ($10–50B in assets) doubled their market share in the last decade, while also reporting a high charge-off rate during the last financial crisis, second only to regional banks ($50–100B in assets) (figure 1).
Elevated losses in construction loans and those secured by hotel properties
In this section, we focus on forecasting the charge-off rates of different loan products in banks’ CRE portfolios: construction and land development (construction loans), multifamily loans, other property loans, and loans to owner-occupied CRE (OOCRE loans) (figure 2).
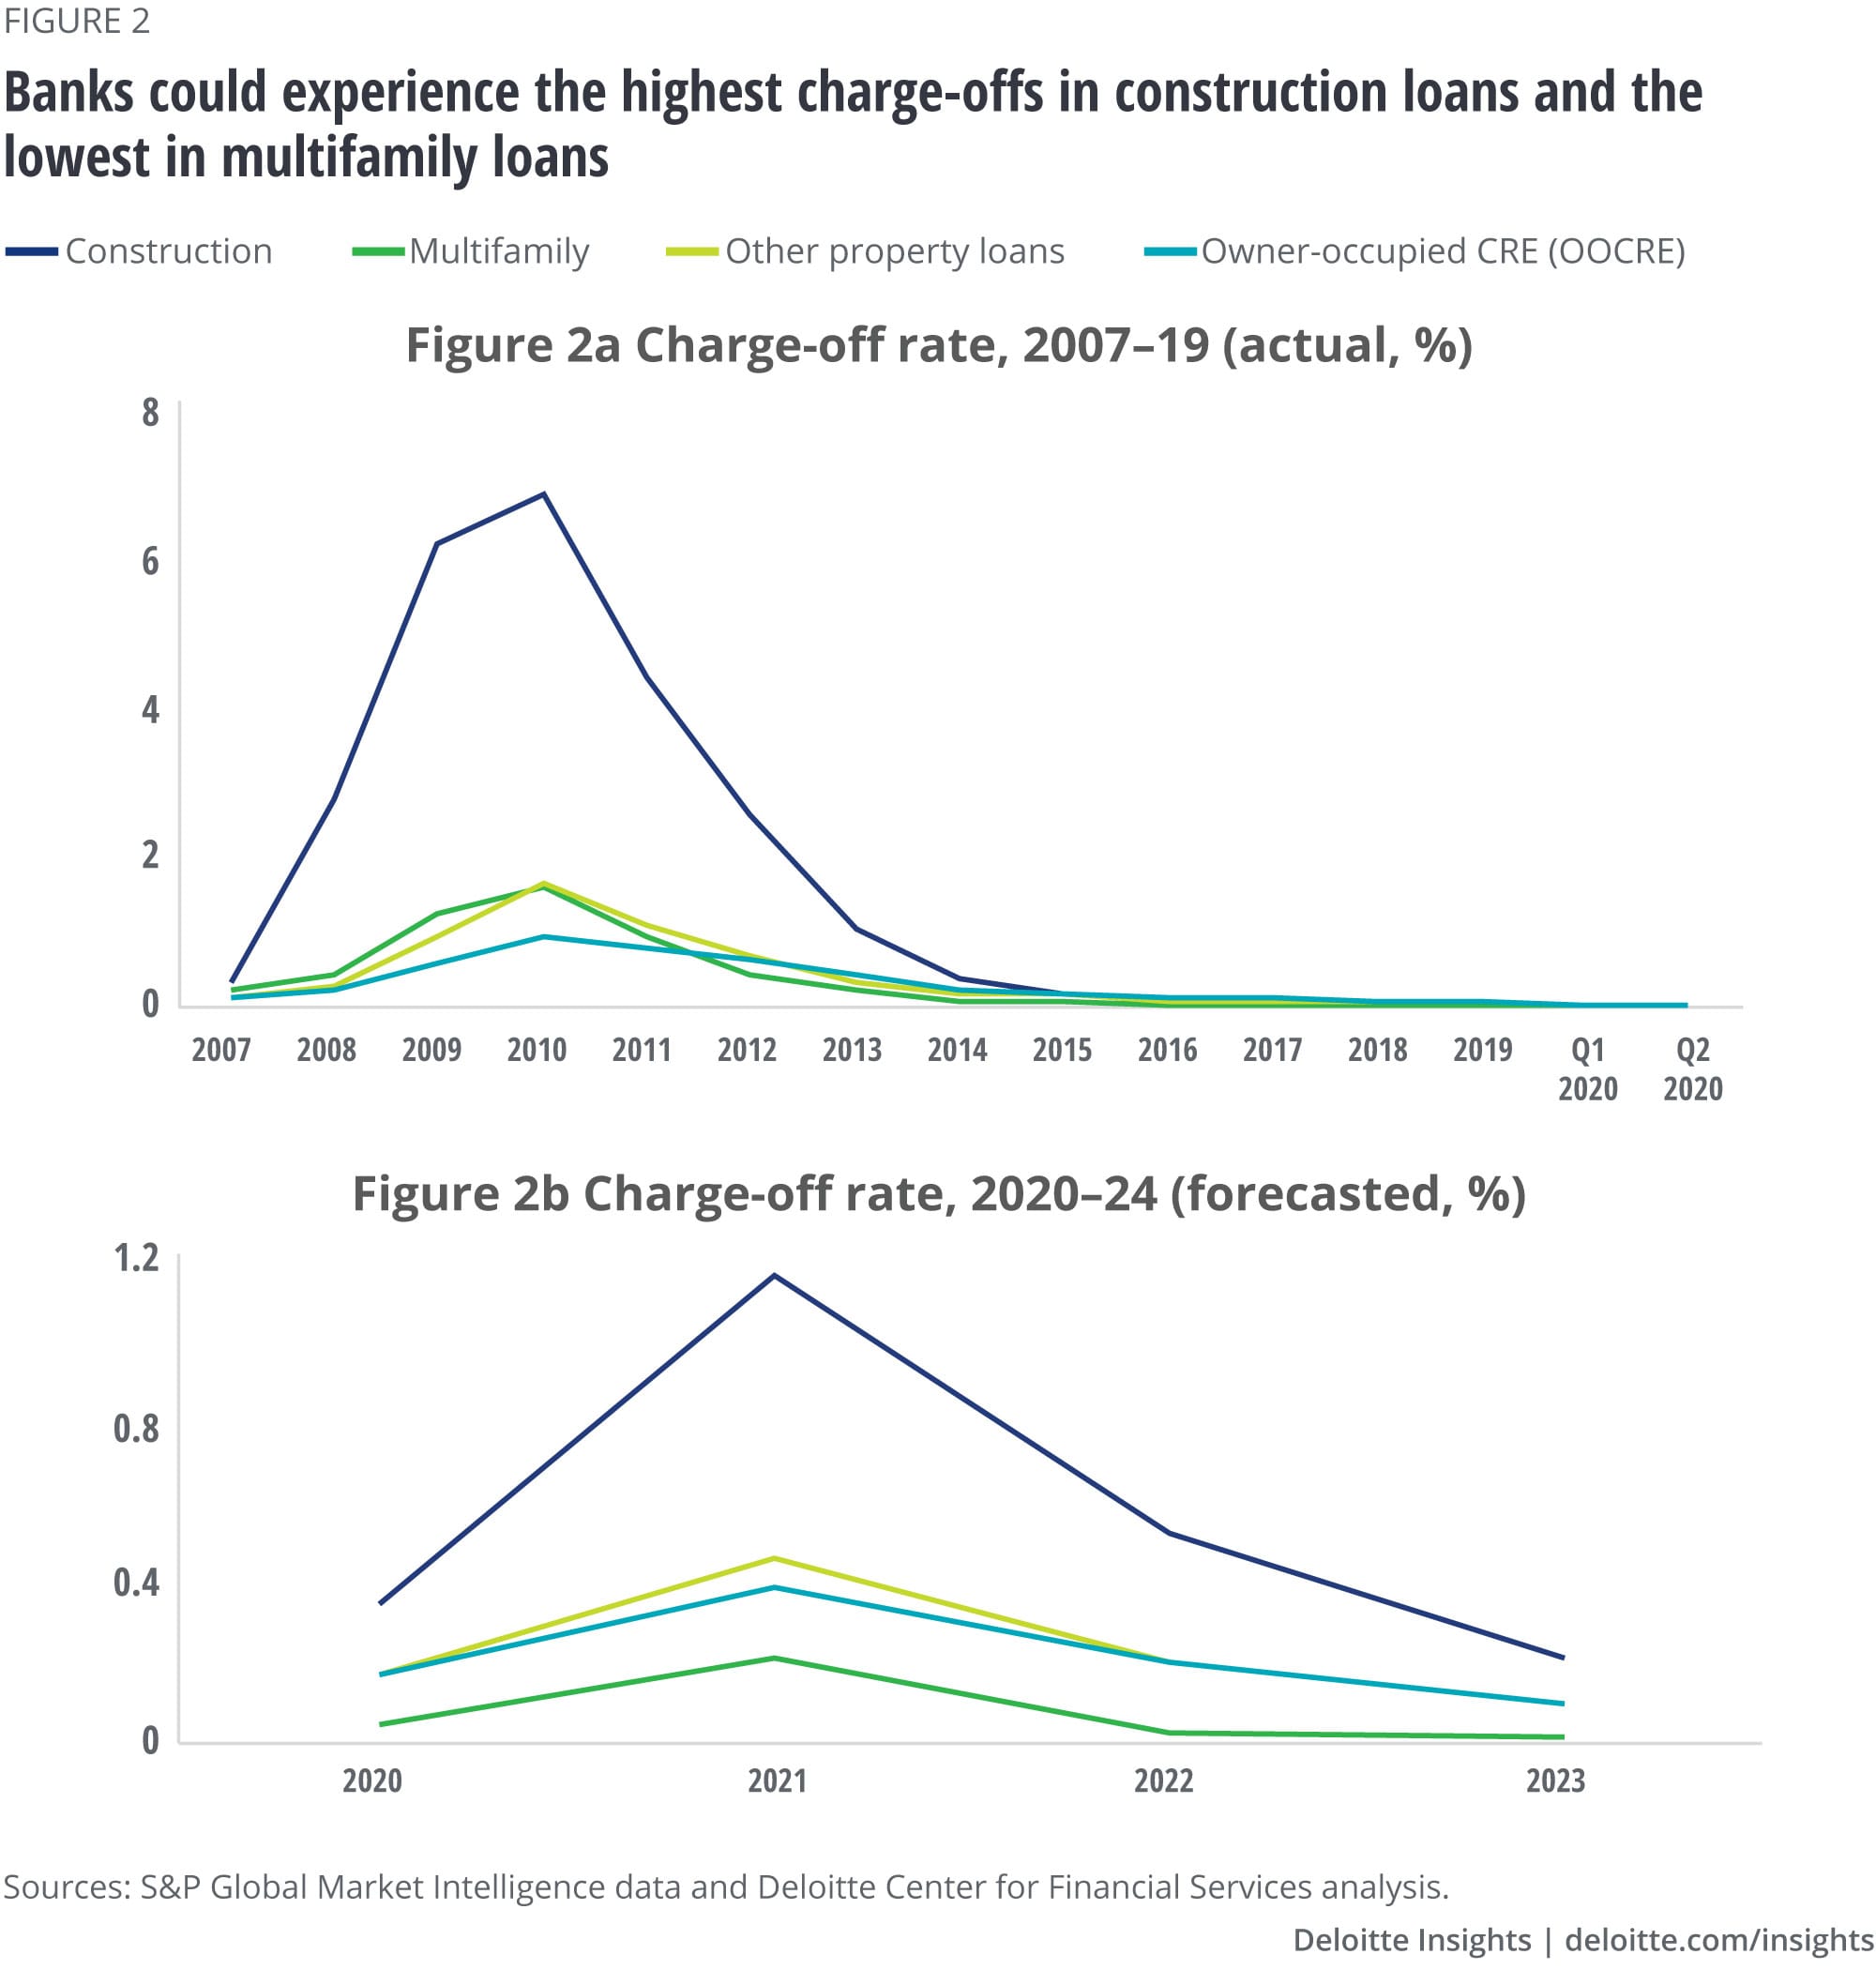
Charge-off rates in construction loans are expected to increase to as much as 1.2% in 2021, compared with 0.04% in 2019 but significantly below the peak of 7% hit in 2010 (see the sidebar, “Forecasting methodology,” for more details). On the bright side, most banks had tightened their underwriting standards and significantly lowered their exposure to the riskier bucket of construction loans after the last financial crisis. Moreover, stability in annualized construction spending76 and an improvement in the construction unemployment rate77 are positive signs for the sector’s recovery. On the flip side, project cancellations, supply chain delays,78 and the end of banks’ forbearance programs could be potential headwinds.
Charge-offs in other property loans,79 which include loans secured by office, retail, industrial, and hotel properties, could rise up to 47 bps in 2021. While this is well above the 5 bps seen in 2019, it would fall well below the GFC high of 165 bps hit in 2010. Among the bright spots, public REITs, an important property owner segment, have maintained stable financial performance.80 Rent collection has remained healthy for loans secured by office and industrial properties and has recovered in free-standing retail and shopping centers.81 But hotels, with occupancy rates declining 64% YoY to as low as 25% in April, have been hardest hit.82 The industry’s occupancy rate has rebounded in certain locations since that low point83 but is expected to remain subdued for the foreseeable future, especially due to a decline in business travel.84 Meanwhile, for sectors that were struggling pre-COVID-19, the pandemic seems to only have exacerbated challenges. In the retail industry, for example, shifting consumer preferences toward digital commerce have challenged price appreciation in retail properties over the last few years.85 It is therefore not surprising that 90% of newly distressed assets in Q2 2020 originated from the hotel and retail sectors.86
Multifamily loans, on the other hand, are likely to remain one of the safe havens in banks’ CRE portfolios. Charge-off rates could increase up to 20 bps in 2021, compared with 1 bp in 2019 but well below the peak of 159 bps hit in 2010. Government stimulus and expanded weekly unemployment benefits helped tenants stay on top of rent payments for the time being, and banks’ forbearance options have supported landlords’ loan burdens. However, the end of the current fiscal support package87 and an increase in vacancy rates88 could dampen rent collection over the coming few quarters and increase charge-offs in 2021. In a July Census Bureau survey, 34% of renters said they would not be able to make their rent payments in August.89
Finally, charge-offs in OOCRE loans could increase to as much as 40 bps in 2021, up from 5 bps in 2019 but below the GFC high of 96 bps in 2010. With a credit profile more similar to commercial and industrial loans, some OOCRE loan borrowers have likely bolstered liquidity, thanks to government stimulus checks, banks’ forbearance programs, and access to banks’ lines of credit. However, the impact of COVID-19 on credit quality may be felt in 2021, when some OOCRE businesses do not resume operations in a post-COVID world.
The way forward: Triage portfolio risk and assess strategic options
With continuing uncertainty about the financial consequences from the pandemic, banks should continue to identify and proactively manage their exposure to at-risk properties that demand immediate attention. In addition to tapping into existing data and analytics capabilities, banks should consider adding alternative data to strengthen credit models, such as whether a restaurant has access to outdoor seating or whether its seating arrangement meets the latest city guidelines.90 Partnerships with fintechs to access alternative data could also help strengthen credit models.
At the same time, banks should continue to focus on elevating customer relationships.91 They should double down on their servicing efforts, demonstrate empathy, and maintain a proactive line of communication with borrowers.
And most important, banks should recognize that one size will not fit all borrowers. They will have to adapt their strategic responses on a case-by-case basis depending on how the COVID-19 pandemic is affecting a borrower’s creditworthiness based on property characteristics. These include rental income, tenant business mix, and collateral value.
Following are strategic steps banks can take to support CRE loan portfolio recovery. Options would depend on whether a loan is low-risk, moderate-risk, or high-risk:
- Continue to work with borrowers on deferrals and/or loan modifications and help them stand on their feet. This option tends to work best with properties and borrowers demonstrating low risk. Industrial Bank has provided nearly 30% of its CRE clients with some sort of workout plan.92
- Tap connections in the investor community to find potential buyers of bank-owned CRE (OREO) properties and facilitate deal-making.
- Restructure loan books to gain priority as secured creditors over bondholders and other creditors.
- For loans under significant distress and high loan-to-value ratio (>100%), prepare to seize properties and operate them until prices recover. This is one of the strategies banks had considered during the GFC and, recently, for distressed O&G assets.93
Forecasting methodology
To forecast the impact of the COVID-19 pandemic on charge-off rates from 2020 to 2024, the research team at the Deloitte Center for Financial Services studied the relationships among charge-off rates; macroeconomic variables, such as the national unemployment rate, the renters’ unemployment rate, and construction unemployment rates; and other metrics related to the CRE sector. These included public REITs’s financial performance and rent collection across different property types. For metrics that lacked historical data, we relied on subjective estimates to make our forecasts.
Our insights can help you take advantage of change. If you’re looking for fresh ideas to address your challenges, we should talk. View our services page.
Contacts
Mark Shilling |
Nathan Florio |
Jim Eckenrode |
Val Srinivas, PhD |
View sector performances
Impact on proptechs
Investor interest in proptechs remains unabated
With the onset of COVID-19, it was uncertain whether investors would remain interested in funding real estate tech startups (“proptechs”). Based on our analyses of Venture Scanner data, investors pulled back from funding US proptechs significantly in 1Q 2020, which led to a decline of 41.5% YOY in the first half of the year.94 But in the second quarter, a promising bounce back occurred: Investment grew by more than 100% YOY.95 This second-quarter growth was largely directed toward US proptechs, which raised more than US$2billion and comprised nearly 95% of proptech investments globally.96 It was also heavily weighted toward proptechs that focused on leasing and purchase-sale transactions, which received 71% of the funding.97
Our research revealed a growing dichotomy between recent proptech funding and performance. Many cosharing proptechs and startups were significantly hit by the pandemic due to rapid contraction in business activity, travel restrictions, and health and safety concerns related to shared spaces. Coworking companies experienced negative rental impacts as some of their primary sources of income comes from freelancers, startups, and small businesses, which were adversely affected by the government-led economic shutdowns.98 Many of them adopted cost-saving measures, such as layoffs, while others offered discounts and attractive terms to retain customers.99 However, during 2Q 2020, a large proportion of funding was directed toward cosharing spaces, which raised U$1.2 billion, signifying continued investor confidence.100
Increasing M&A activity
Meanwhile, in the United States, there has been a gradual rise in M&A activity in the first half of 2020. There were five deals in the first quarter 2020 and six in the second.101 Proptechs in the property development and management category continued to be the prime target and accounted for seven out of 11 acquisitions. Instead of going public with an IPO, some proptechs are choosing the special purpose acquisition companies (SPACs) route. For example, Porch, a home improvement software and services proptech, plans to merge with PropTech Acquisition Corporation to become a publicly listed company.102 Globally, SPACs raised nearly US$24 billion across industries in the first seven months of 2020, with the majority raised in the United States.103 This surpassed their previous annual high of US$19 billion in 2019.104
Our funding forecast, 2020—2021
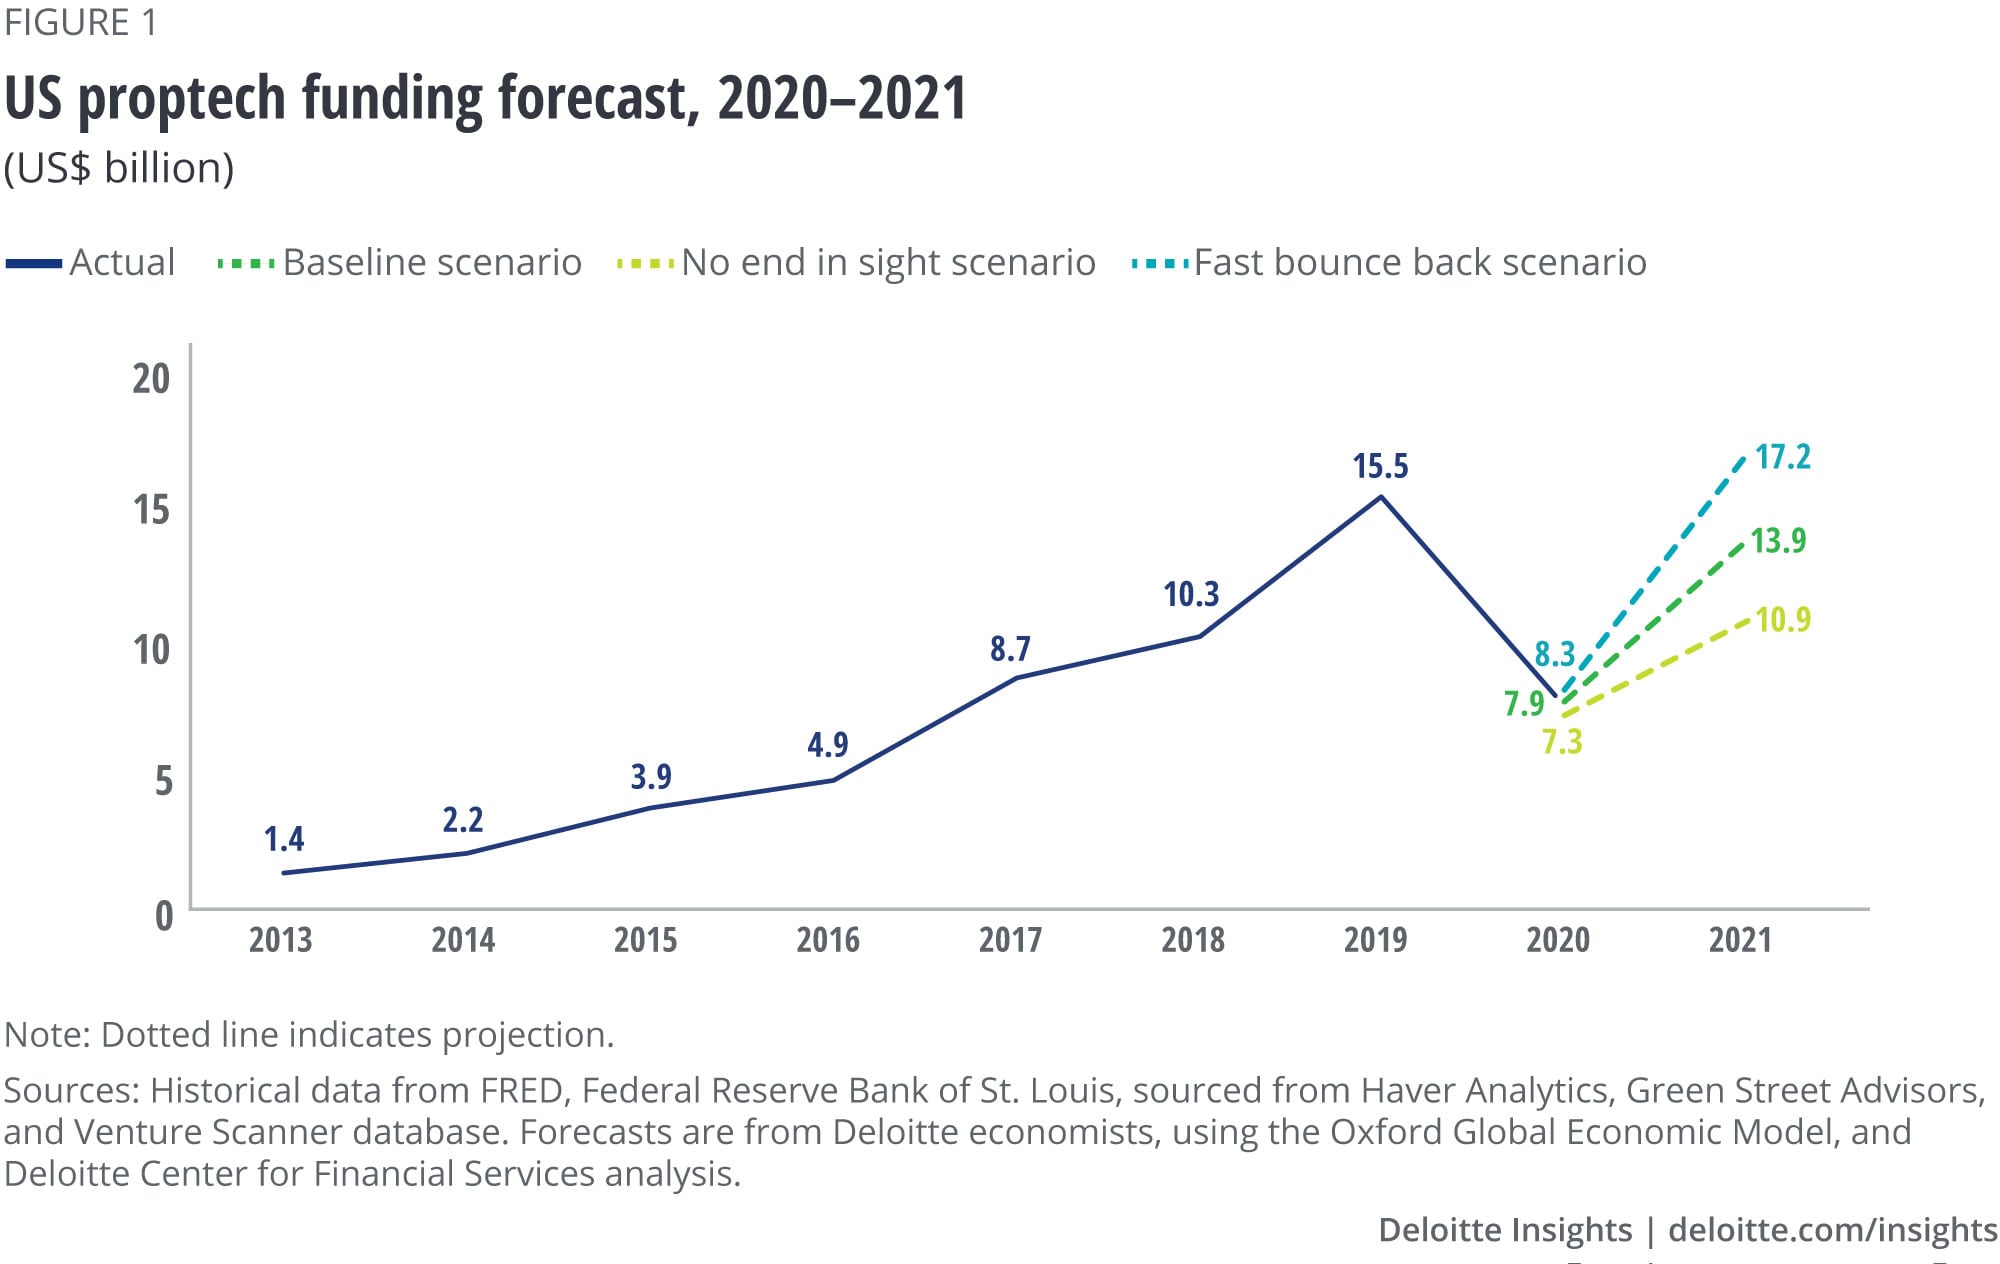
Considering three different scenarios based on the potential speed of recovery from COVID-19—baseline, no end in sight, and fast bounce back, our forecast estimates that total funding in the US proptechs may decline to US$7.3 billion–US$8.3billion in 2020, even as funding improves in the second half. In 2021, we believe funding will likely increase in the range of US$10.9 billion–US$17.2 billion (figure 1; see sidebar, “Forecasting methodology”). That said, the following opportunities and recommendations will apply to all funding scenarios and a lower funding scenario will only make investors more selective, increasing competition.
With the increased focus on digital solutions, we could see higher demand for products and services such as smart cleaning and monitoring, virtual appraisals, touchless property navigation, digital lease transactions, and remote property management (figure 2). Since the onset of the pandemic, there has been accelerated demand for property management solutions that enable smooth and safe reentry into physical spaces. Demand has also increased in the residential segment, in areas such as smart home solutions and home furniture rentals, as people are increasingly working from home. The increased demand is highlighted in the recent funding pattern. For instance, UpKeep, an app-based maintenance management solution provider, received US$36 million in funding in May.105 Arizona-based SmartRent, focused on home automation platforms, also raised US$60 million funding in May.106 And, CasaOne, an on-demand home furniture rental company, received US$50 million funding in June.107

Proptechs should adapt to meet the needs of the postpandemic world
Technology-induced innovation is the ethos of the proptech industry. As workspaces and the lines between “live, work, and play” may look and feel much different post–COVID-19, real estate company operations will likely need to evolve to meet new demands. This could create new business opportunities for existing proptechs, but some proptechs may need to revamp their business models and reinvent solutions.
Evolving business models. Proptechs could take different approaches to evolve, spot, and capitalize on new opportunities. They can expand their target customer segments and consider adding complementary products and services through strategic alliances or M&As. We have already seen some proptechs taking steps in this direction. For instance, prior to the pandemic, Sonder focused on short-term rentals in the hospitality space and was dependent on leisure and business travelers. During the pandemic, the company quickly pivoted to focus on temporary housing for students, families, and medical workers.108 It raised US$170 million series E funding in June.109 Kaiterra, an air quality monitoring solutions provider recently acquired ChemiSense, allowing the company to expand its portfolio of offerings and build a stronger network with HVAC and building automation and management firms.110 Proptechs can also enter into strategic partnerships with real estate companies. Here, proptechs could provide real estate companies with innovative technology solutions to help them reduce costs and improve operational efficiency while proptechs would benefit by gaining a stable revenue stream.
Reinventing products and services. Proptechs can realign products and services to meet the needs of the new environment. They can tailor their solutions to digitize the tenant experience, with an emphasis on health, safety, and convenience. They can also broaden data and analytics solutions to enable property owners and operators to closely track occupancy rates and social distancing at their properties. Openpath, for instance, provides cloud-based mobile software solutions that allow keyless access to buildings and workspaces.111 During the pandemic, the company tailored its offerings toward wellness verifications, temperature screenings, and contactless elevator systems.112 VergeSense, which provides sensor technology to effectively measure and manage occupancy, is now calculating social distancing scores using their existing machine learning platforms and computer vision models.113 These scores could help companies determine which strategies, such as alternating work hours or staggering shifts, are most helpful in maintaining social distancing and ensuring occupant safety.114
Forecasting methodology
Developed in collaboration with the Deloitte Economics team, our study is based on an econometric forecasting model that projects US proptechs funding.
Key factors in our model that influence funding are commercial real estate (CRE) prices and home prices. Both have a positive influence on proptechs funding, with home prices having a three-quarter lag.
We have used multiple sources for the data on model variables. Historical data on US proptechs funding is from Venture Scanner database; CRE prices are from Green Street Advisors; and home prices are from Federal Reserve Economic Data (FRED) of the Federal Reserve Bank of St. Louis. Forecasts for home prices are from the Deloitte economists, using the Oxford Global Economic Model, and the rest of all forecasts are based on Deloitte Center for Financial Services analysis.
Our insights can help you take advantage of change. If you’re looking for fresh ideas to address your challenges, we should talk. View our services page.
Contacts
Jim Berry |
Dharmesh Ajmera |
Jim Eckenrode |
Surabhi Kejriwal |
© 2021. See Terms of Use for more information.
More from the Financial services collection
-
COVID-19 return-to-the-workplace strategies Article4 years ago
-
Embedding trust into COVID-19 recovery Article4 years ago
-
Insurers step up as financial first responders Article4 years ago
-
Potential implications of COVID-19 for the insurance sector Article5 years ago
-
COVID-19 and the investment management industry Article5 years ago
-
Opportunities for private equity post-COVID-19 Article4 years ago


