Global ups and downs amid Chinese excess capacity
A surge in China’s high-tech and green energy goods exports amid falling domestic demand will ripple through the global economy—benefitting some countries while hurting others
China is indisputably the world’s largest manufacturer. In 2019, it accounted for about a third of global gross manufacturing output.1 Most economic indicators suggest that China’s share of global manufacturing has grown since then and at a rate faster than it can reasonably absorb into its own economy. For example, its merchandise trade surplus grew from about US$1 trillion in 2019 to just over US$1.7 trillion in 2023.2 Goods exports grew by 35% over the four-year period, besting nominal gross domestic product growth by more than 10 percentage points.3
While exports have soared, domestic demand has struggled. A slump in its property sector has deprived China of a critical engine of growth. Not only has investment in real estate weakened, but consumer spending has also struggled to accelerate as falling home prices, a critical component of household wealth, have encouraged consumers to save more and spend less. In an effort to revive economic growth, policymakers have prioritized industrial policies to develop high-tech industries and advanced manufacturing. Policies to boost consumer spending have been scant in recent policy documents.4
Such policy priorities are not radically different from those seen in other large economies, such as the United States and the European Union.5 Since the pandemic, governments around the world have increasingly looked for ways to minimize disruptions to critical supply chains and gain self-sufficiency, particularly in high-tech and green energy products. What is different about China is that it is already self-sufficient and indeed a global leader in many of these manufactured products. The large merchandise trade surplus it runs with the rest of the world is a testament to this outsized production relative to domestic demand.
The other difference is the magnitude of government support. Conservative estimates of the scale of Chinese subsidies came to 1.7% of GDP in 2019, which is more than it spent on defense that year.6 As a share of GDP, this is twice as much as South Korea, which is the second largest spender. In US dollar terms, it is more than twice as much as the United States spends.7 Another estimate shows that subsidies could cover up to 65% of the cost of doing business for some solar panel manufacturers.8 However, Chinese policymakers have insisted that innovation, rather than subsidies, is the driving force of its competitively priced goods7 and that any government support for industry is in compliance with the World Trade Organization.10
As China pursues these policy priorities, countries will find themselves benefitting or hurting as a result. The winners will include suppliers of intermediate inputs to China’s manufacturers as they will see a rise in demand for their goods in the medium term. Importing countries that have little domestic capacity of their own will also benefit as their consumers will face an increased supply of goods that will likely become more affordable. The losing countries will be those that have their own production bases of the same goods, particularly those that are net exporters. Those countries will have to compete with Chinese producers both at home and abroad. In the subsequent sections, we highlight which countries stand to gain or lose the most.
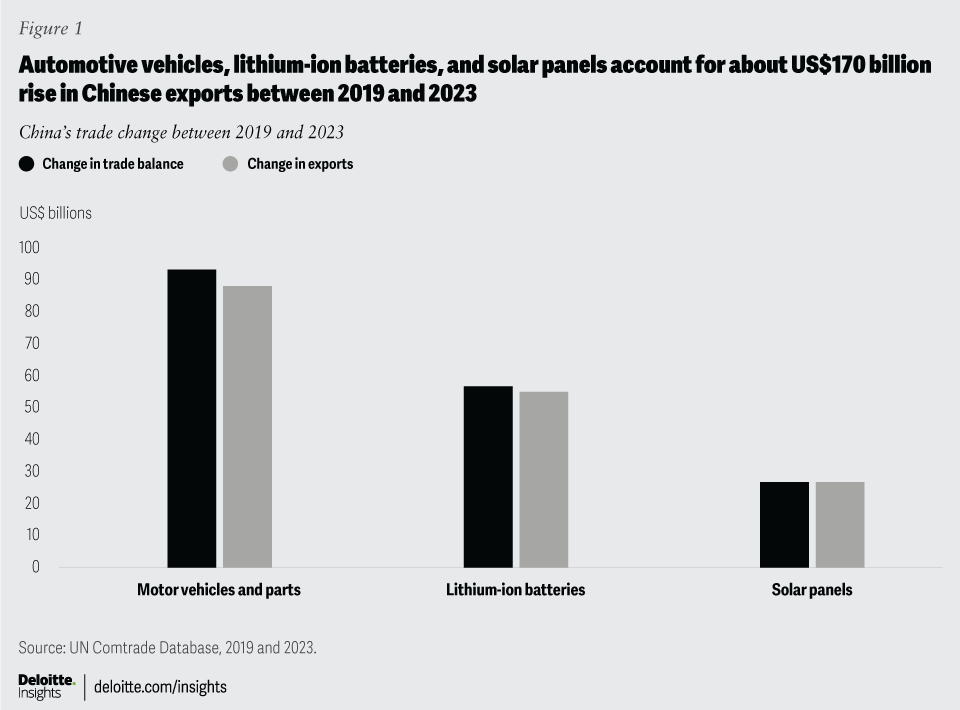
We have limited the analysis to focus on the three manufactured goods where China saw the largest gains in its trade surplus that was driven by export growth. These include automotive vehicles, lithium-ion batteries, and solar panels. These three categories, when grouped in their 4-digit Harmonized System codes,11 account for a nearly US$170 billion rise in Chinese exports between 2019 and 2023 (figure 1).12
Implicit in this analysis is that China will be able to continue to grow in these areas. This assumes that China can grow its export positions or offset any loss in export growth with its domestic market. However, there is an alternative scenario where China cannot achieve this. Numerous countries have already erected barriers to trade with China,13 which could limit its ability to grow its exports. Policymakers in the United States and the European Union, which have very large consumer markets, have raised trade barriers to protect their domestic production and reduce what they see as overreliance on China in the supply chain of critically important goods.
Without a corresponding rise in domestic demand for these goods, China will face a loss of global market share and could even see its production contract outright. It is also not at all obvious that China’s domestic demand can easily overcome a drop in exports, given persistently weak consumer spending and an aversion to fiscal stimulus. Excess capacity itself has contributed to deflationary pressure in China as excess supply pushes prices lower. This in turn can lead to a vicious cycle of lower wages, lower consumer spending, and even lower prices. China’s excess capacity therefore risks an ability to overcome global pushback on its export sector.
Motor vehicles
China’s motor vehicle trade surplus has grown faster than any other commodity group between 2019 and 2023.14 China went from exporting just US$8.6 billion worth of autos in 2019 to exporting US$77.6 billion in 2023. Electric vehicles (EVs) get much of the attention, and rightly so. EV exports were virtually nonexistent in 2019 but surged to US$34.1 billion by 2023. However, internal combustion EVs are also part of the meteoric rise in this category, with exports of these autos rising from US$16.4 billion over the period to US$19.7 billion.15
China has simultaneously increased its auto exports and reduced its imports of finished vehicles, further helping widen its trade surplus in this category. The reduction in imports came primarily at the expense of autos produced in Japan. Thailand, Canada, and the United States also saw their auto exports to China drop in dollar terms between 2019 and 2023.16 Auto exports to China from Germany, Slovakia, and the United Kingdom all increased over the period.
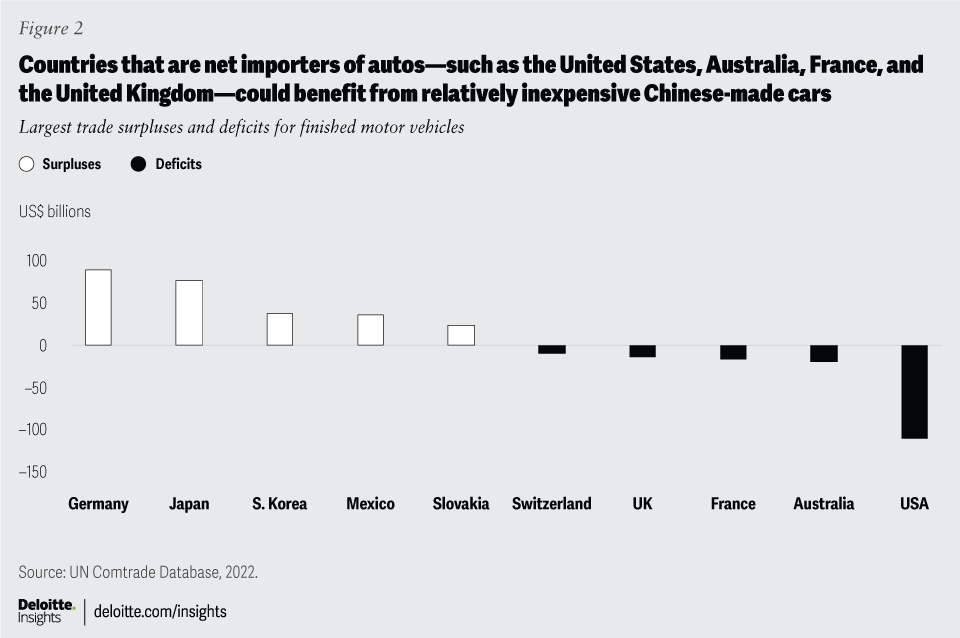
Looking ahead, Germany seems to be the most vulnerable to import replacement with domestically produced autos in China. In 2023, it accounted for just over a third of all Chinese auto imports in dollar terms. The United States, Japan, Slovakia, and the United Kingdom all have sizable auto exports to China that could be eroded in coming years. Germany was also the largest net exporter to the world of finished autos, followed by Japan, South Korea, Mexico, and Slovakia.17 These countries face stiff international competition from China’s automakers.
Countries that are net importers of autos could benefit from access to relatively cheap Chinese-made cars. In US dollar terms, the United States is by far the largest net importer of finished autos. Australia, France, the United Kingdom, and Switzerland are all large net importers as well (figure 2).18 However, it is relatively small economies that would likely see the largest gains. Countries such as Lebanon, Kyrgyzstan, Georgia, Iceland, and Montenegro are some of the largest net importers of autos in terms of share of GDP. Auto imports in Lebanon for example added up to 6.6% of GDP in 2023.19
The United States is also unlikely to benefit from access to low-cost Chinese vehicles due to its trade policies. EVs coming from China face 100% tariffs,20 which is a formidable barrier. The European Union also raised tariffs on EVs from China, though the rate only goes up to 38%, which is on top of the 10% tariff for all EV imports.21 Still, this will limit upside for EU countries that are net importers of vehicles.
Auto parts manufacturers could also benefit from an increased competitive landscape for finished autos. China’s largest sources of auto parts outside the country are Germany and Japan, where more than US$11 billion worth of auto parts came from.22 The United States, Mexico, South Korea, and France each sent at least US$1 billion worth of parts to China in 2023.23
Unfortunately for these countries, China has also become a very large producer of auto parts. Its auto parts exports in 2023 were valued at US$49.7 billion, up 58% from 2019. Only Germany exported more in 2023. China’s rise in auto parts manufacturing puts large auto parts net exporters such as Japan, Germany, South Korea, Mexico, and Poland at risk.24
Net importers of auto parts could also reap benefits. The United States is by far the largest net importer in US dollar terms, with auto parts imports worth US$45.5 billion more than its exports in 2022,25 But any benefit to the United States would be limited by US opposition to auto parts made by Chinese-owned companies. Slovakia, the United Kingdom, Spain, Brazil, and Canada all run sizable trade deficits in auto parts. It is in Slovakia where the benefit could be the greatest as it imported US$12.6 billion of auto parts in 2022, which is 10.9% of its GDP.26
Producers of raw materials could also benefit from rapidly growing auto production in China in the medium term. In the longer term, overcapacity in auto production risks oversupplying those raw materials if there is eventually a correction in the auto market. Aluminum, thanks to its lightweight, is increasingly important in car manufacturing. Guinea, Vietnam, Australia, Brazil, and Jamaica have the largest bauxite mining, which produces aluminum.27 Copper is used in numerous auto parts, especially those that are electrified. Chile, Peru, the Democratic Republic of Congo, and the United States have the largest market shares of copper mining.28 Platinum group metals, which are used for catalytic converters, are primarily mined in South Africa, with Russia coming in a distant second place.29
Lithium-ion batteries
China’s exports of the broad group of lithium-ion batteries were valued at US$69.9 billion in 2023, up from just US$16.9 billion in 2019.30 At the same time, imports of these goods fell by about a third, widening the trade surplus by US$54.5 billion.31 Lithium-ion batteries can be inputs to finished motor vehicles, but they are identified separately in the trade data, which is how we will treat them here. China is the clear world leader when it comes to lithium-ion battery production. In 2022, it had 75% of the world’s existing manufacturing capacity.32
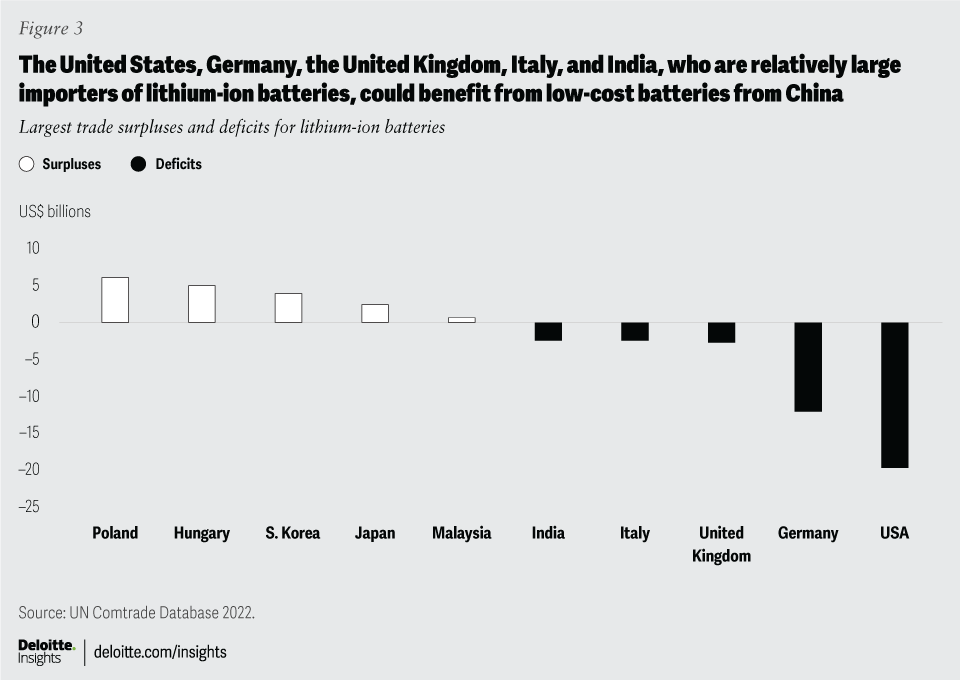
The United States and Germany had the second and third largest manufacturing capacities, respectively. However, each of them produced less than one-tenth of the batteries that China produced.33 Although the United States and Germany have domestic capacity to produce lithium-ion batteries, they are also the largest net importers of them (figure 3).34 The United Kingdom, Italy, and India are also relatively large importers. Apart from the fact that the adoption of lithium-ion batteries is seen as a critical step to energy independence, these countries could benefit from a flood of cheap batteries coming from China. However, with a new 25% tariff on lithium-ion batteries for EVs, upside to the United States may be limited in the near term.35 On the other hand, US protectionism is expected to boost domestic capacity.36
Meanwhile, there are only a few net exporters of lithium-ion batteries. Poland, Hungary, South Korea, and Japan are the only countries with more than a US$1 billion trade surplus in this category.37 These countries could be disadvantaged by China’s growth. However, because China is already such a dominant player in batteries and other countries have implemented policies to boost their domestic capacity, China is expected to lose some of its market share by 2030.38 Even so, China is expected to see its capacity increase over this period, just not as quickly as it will happen in other countries.
Although China is the largest producer of batteries and refines most of the lithium and cobalt necessary for those batteries, it lacks many of the raw materials that are necessary to build them. Countries with large deposits of lithium, cobalt, and nickel stand to gain. Australia and Chile account for just over 79% of the world’s lithium ore and brine exports, most of which are already destined for China.39 The Democratic Republic of Congo accounted for 70% of cobalt ore exports in 2022.40 Nickel is heavily concentrated in Indonesia, with the Philippines a distant second in terms of production.
Solar panels
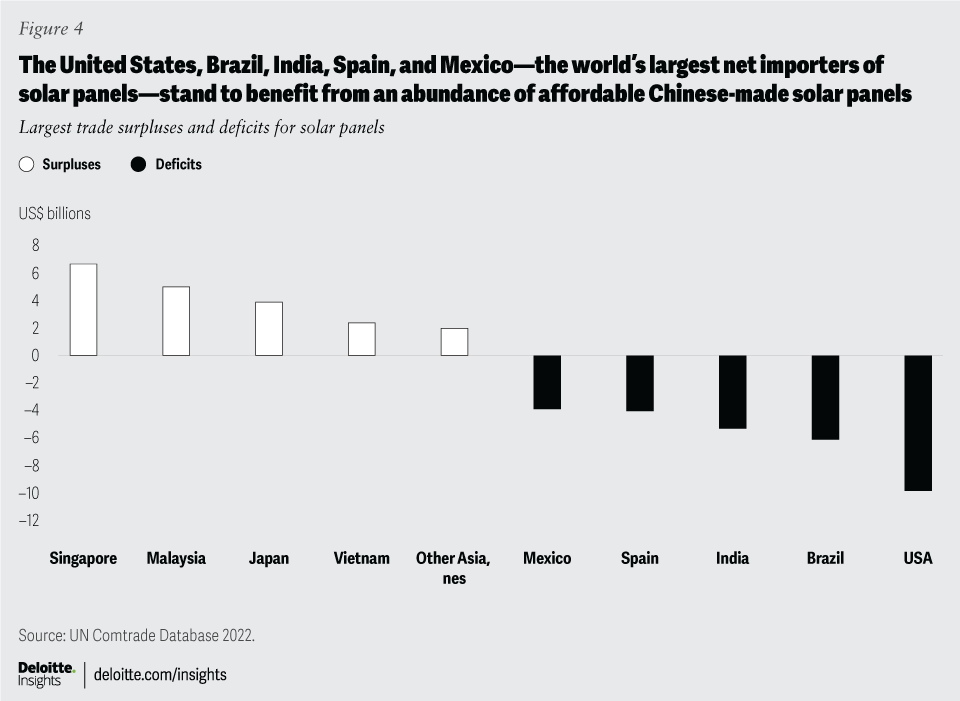
China is also by far the largest producer of solar panels, exporting just under US$56 billion in 2023.41 The next largest exporter was Singapore at just US$13.1 billion. Germany, Malaysia, Japan, and the United States didn’t export more than US$10 billion each. Similar to lithium-ion batteries, very few countries are net exporters of solar panels.42 China is followed by Singapore, Malaysia, Japan, and Vietnam (figure 4). China’s share in all stages of solar panel production exceeded 80% in 2022.43
The world’s largest net importers of solar panels were the United States, Brazil, India, Spain, and Mexico.44 These countries could benefit from an abundance of cheap Chinese-made solar panels. However, the United States has imposed sizable tariffs on solar panels coming from China, which limits much of the upside.45 The United States is attempting to build out its own capacity for domestic demand. Although the European Union has not imposed trade barriers on solar panels from China as it attempts to balance its climate targets with protection of its domestic manufacturing capabilities, it has provided subsidies to its domestic solar panel manufacturers to help level the playing field.46
Unlike with lithium-ion batteries, China has access to large deposits of many of the materials required for solar panel production. China is by far the largest producer of silicon.47 Norway, the United States, and Brazil all have relatively large mining production, but they are dwarfed by China’s. China was also the second largest producer of silver in 2023, after Mexico. Peru, Chile, Poland, Russia, Bolivia, and Australia recorded relatively large production levels in 2023 as well.48
China’s dominant position in so much of the solar panel supply chain could create opportunities for other countries to increase their market share. This is especially true in the US market, where Chinese producers are largely priced out due to trade barriers. However, China is expected to maintain its dominant position through at least 2026, with only small gains in market share made by other countries over this period.49
Focusing exclusively on the trade data, the United States could benefit from China’s excess capacity in motor vehicles, batteries, and solar panels due to it being a net importer of all three. Access to these cheap Chinese goods would allow the United States to achieve its climate goals more quickly and reduce costs for consumers. However, the United States has raised trade barriers for these goods as it looks to build its own capabilities domestically. Conversely, Japan has been hesitant to impose trade restrictions on these goods despite the fact that it is a net exporter of all three. China is often Japan’s largest export market, making it risky to raise trade barriers.
As demand for all three goods continues to grow, the clearest winners will be the countries that are endowed with the raw materials necessary to make them. It likely matters very little which countries ultimately produce the finished good. Any producing country will still require the same raw materials. Australia, Chile, and the Democratic Republic of Congo stand out as clear winners under any scenario, assuming the chemistry for these goods remains relatively unchanged.