Jobs in government have rebounded since 2020—the harder part will be to fill these roles
The June 2024 Economics Insider explores the growing challenges facing local, state, and federal government employers in the post-pandemic era
Patricia Buckley
Akrur Barua
Business cycles1 normally do not have much impact on the government workforce. The recession of February to April 2020 was, however, different. While the private sector bore the brunt of the COVID-19 pandemic, employment fell sharply in government too. Between February and May 2020, nonfarm payrolls in local and state governments fell by about 1.5 million2 as tax revenues plummeted owing to shutdowns and social distancing restrictions—conditions unheard of in previous recessions.
Fortunately, this didn’t last too long. As economic activity started recovering, the labor market—for both the private sector and the government—rebounded. Government payrolls3 are now 1.8% higher than in February 2020, and layoffs4 have stabilized. Yet, as the pandemic recedes from memory, the government faces a new challenge: filling in for vacancies, as job openings now are higher than pre-pandemic times. This won’t be easy, especially for roles in technology, finance, and management where the government will have to increasingly compete with the private sector for talent.
The government workforce has grown at a steady pace over the years
As of April 2024, there were 23.3 million people on government payrolls, which made up 14.7% of the total payrolls in the economy. Local governments employed close to 64% of these people, followed by state governments (23.4%) and the federal government (12.9%). Since the beginning of the new millennium, the government workforce has been increasing steadily—13.3% over the years. This rate of increase may be lower than the corresponding growth in the overall private sector (22.5%), but it is still higher than the growth in key sectors like wholesale trade, retail trade, and manufacturing (where payrolls have decreased).
Within total government payrolls, those in state governments have risen the most during this period (14.4%), followed by local governments (14%), and then the federal government (8%). A key reason behind rising payrolls in state and local governments (especially in states) is growing employment in education. In April 2024, for example, total payrolls in education services in state and local governments amounted to 10.7 million or 46% of total government payrolls in the economy.
While the rise in payrolls in federal government may seem low, the data doesn’t capture two key workforces within the federal government. First, the payrolls data doesn’t include the figures for contract and grant workers,5 which have been increasing steadily in the federal government over the years. In 2020, for example, a study by Brookings found that contract and grant employees amounted to more than three times the figure for full-time employees in the federal government.6 Second, the payrolls data doesn’t include the military; the same study by Brookings found that the military numbered 1.4 million in 2020.7 No wonder then that payrolls in federal government are now roughly at the same level as they were in the mid-1980s and mid-1990s.
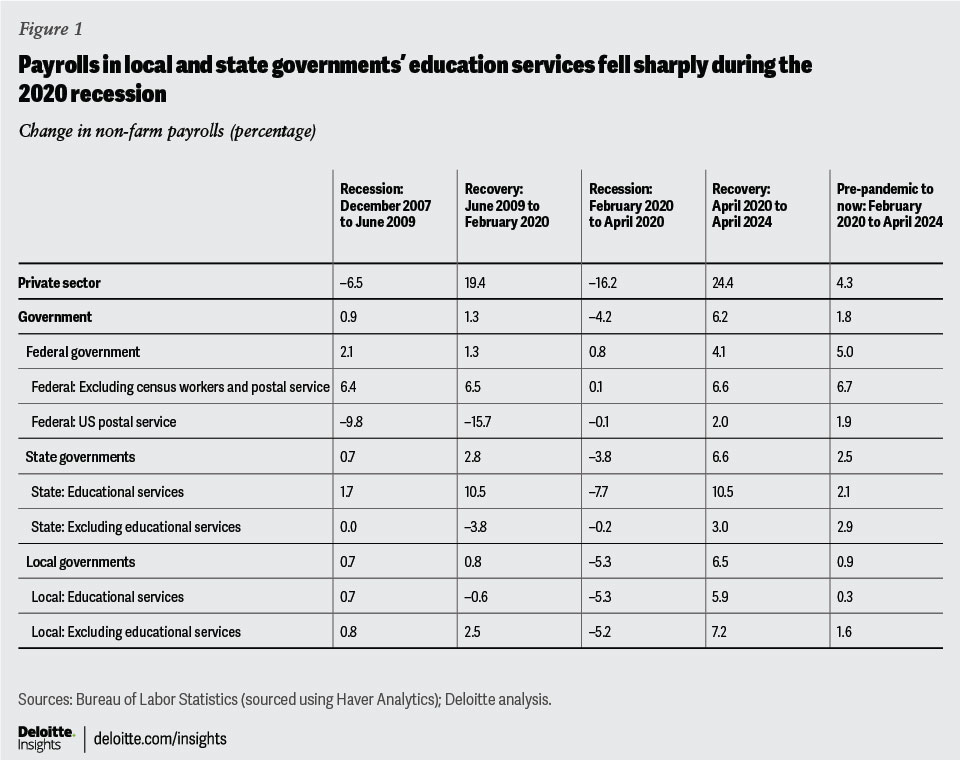
Unlike previous recessions, government employment fell sharply in the downturn of 2020
Business cycles—downturns and expansions—affect private-sector employment more than government employment. That’s because government activity depends more on congressional budgeting at the federal level and tax revenues at the state and local levels than on economic fluctuations. In the recession from December 2007 to June 2009, for instance, government payrolls increased by 200,000, while private sector payrolls dropped by 7.6 million.
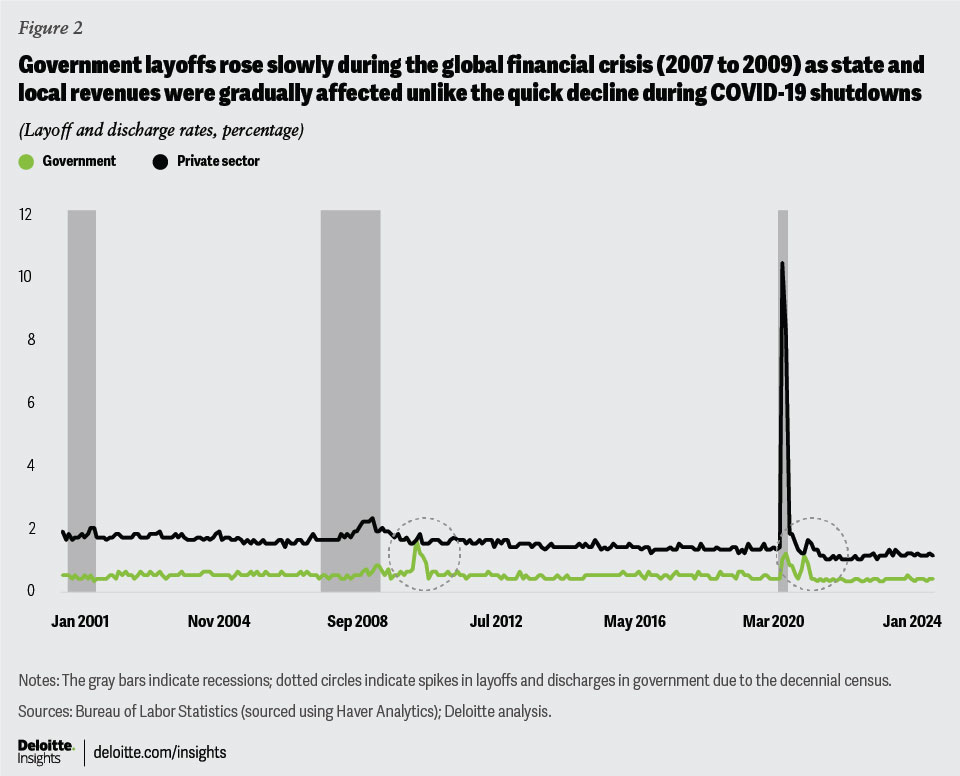
The recession of 2020, however, was different (figure 1). Led by state and local, government payrolls declined by 4.2% between February and April 2020—the period of the recession—and by another 2.4% in May. Why did this happen? The contraction in the government workforce in 2020 was primarily due to the nature of that recession—a global health emergency due to the COVID-19 pandemic and not because of any economic or financial factors. When tax revenues plummeted due to shutdowns and social distancing requirements, state and local governments had to lay off workers as almost all states have balance-budget requirements.8 Data from the US Bureau of Labor Statistics’ Job Openings and Labor Turnover Survey shows that layoffs in state and local government between March and June 2020 were 795,000, almost 93% of total layoffs in government during that time. And education services accounted for nearly 56% of state and local government layoffs. While tax revenue fell in other recessions too, it did so much more slowly—that is why we see an uptick in layoffs only toward the end of the global financial crisis (figure 2).
Figure 2 also reveals that there was a second peak in the layoff and discharge rate for the government in 2020. This was, however, unrelated to the pandemic and had nothing to do with state and local governments. Instead, layoffs rose in the federal government between September and November 2020 (about 308,000) because of the way temporary and intermittent decennial census workers are treated in the data: When their contracts expire, it is considered as layoffs.9 This is similar to the spike in the layoff rate for the government between June and August 2010, the period of the previous decennial census.
Another thing to note in figure 1 is the faster decline in payrolls in the US Postal Service in the recovery of June 2009 to February 2020 compared to the recession just preceding this period. That’s because postal service employment wasn’t reacting to a business cycle but continuing its steady decline since the 1990s. Fortunes of the US Postal Service have been falling steadily since that period due to technological changes (like emails) and increasing competition from the private sector.10 In fact, the Bureau of Labor Statistics estimates that employment of postal service workers is set to decline by another 8% between 2022 and 2023.11
Figures 1 and 2 also show that while government employment fell during the last recession, the decline was much lower than what it was in the private sector. For example, the layoff and discharge rate for the government peaked at 1.2% in April 2020, while for the private sector, the peak rate was 10.4% (in March 2020).
Government employment has stabilized since the dip of 2020
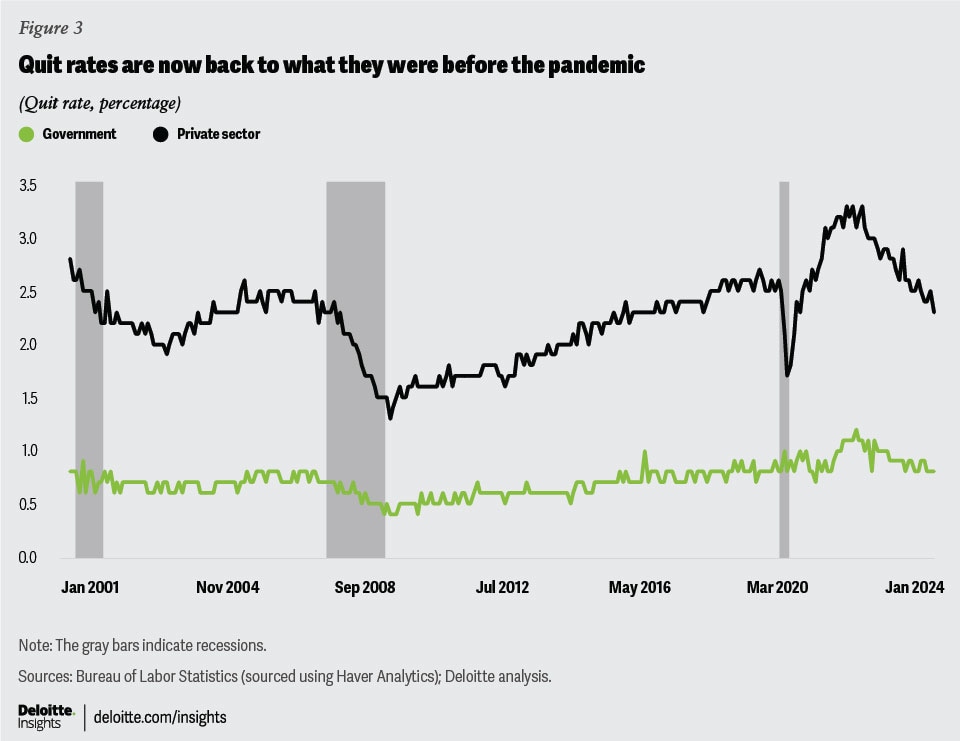
Like the private sector, the drop in government jobs was short-lived and reversed as the economy reopened in mid-2020. As figure 1 showed, government jobs are now above pre-pandemic levels, with federal jobs growing the most—5% more than in February 2020. Data on layoffs (figure 2) and quits (figure 3) also shows that both rates have settled for the government and the private sector and are now similar to pre-pandemic times. In fact, the average monthly rate of layoffs and discharges in the first quarter of 2024 for the federal government (0.2%) and for state and local governments (0.4%) are now slightly lower than the average monthly figure for 2019.
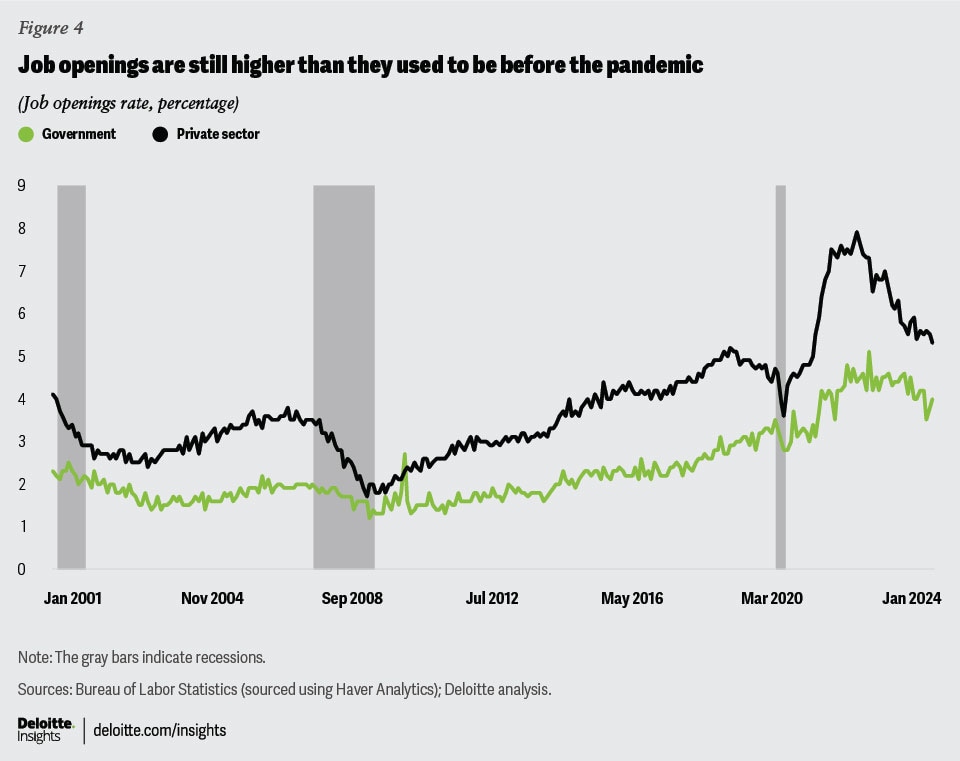
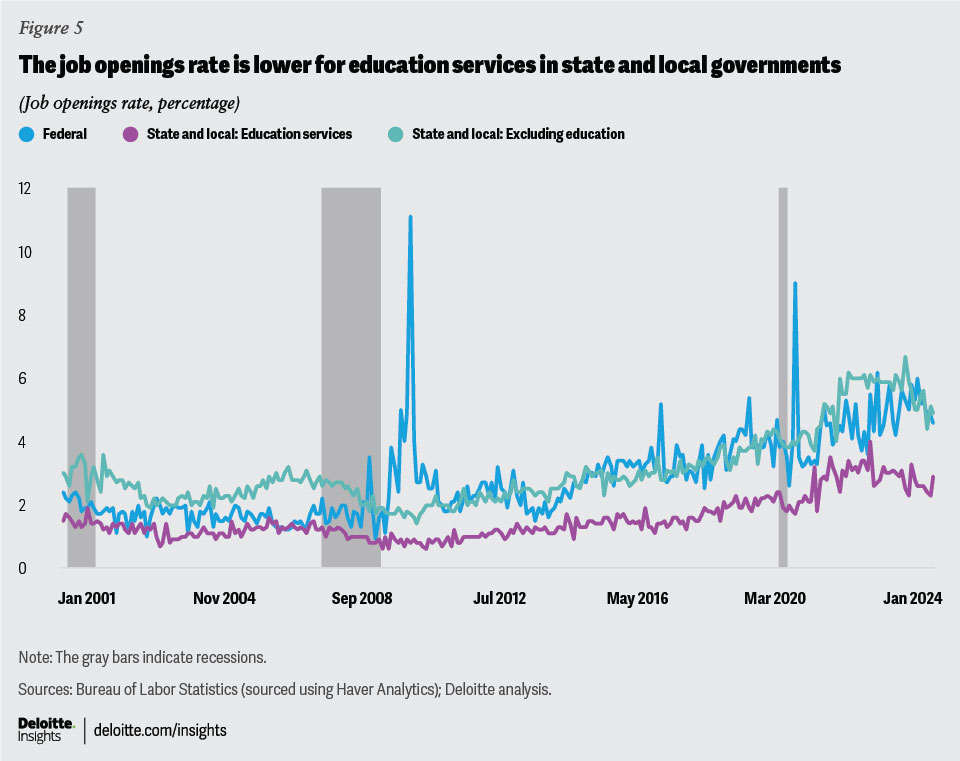
The same, however, cannot be said for job openings. Job openings in the government fell in 2020 due to the recession but picked up as an economic recovery took shape. And despite a decline since 2022, the rate of job openings is still higher than what it was before the pandemic, as figure 4 shows. Within the government, the rate of job openings has been higher for the federal government and state and local governments, excluding education services (figure 5).
What figures 4 and 5 also show is that the rise in job openings in the government and the private sector is not a recent phenomenon; openings have been going up steadily since 2009. The likely reason behind this trend is that while the demand for personnel with specific skill sets have gone up in the government and the private sector, both haven’t been able to find adequate personnel to fill these roles. In government, some of these roles may be specific to the work it typically does such as provision of social services and ensuring law and justice. But in others such as technology, the government has been increasingly competing with the private sector for tech-related talent. This is evident from trends in occupational employment.
Competition for in-demand occupations
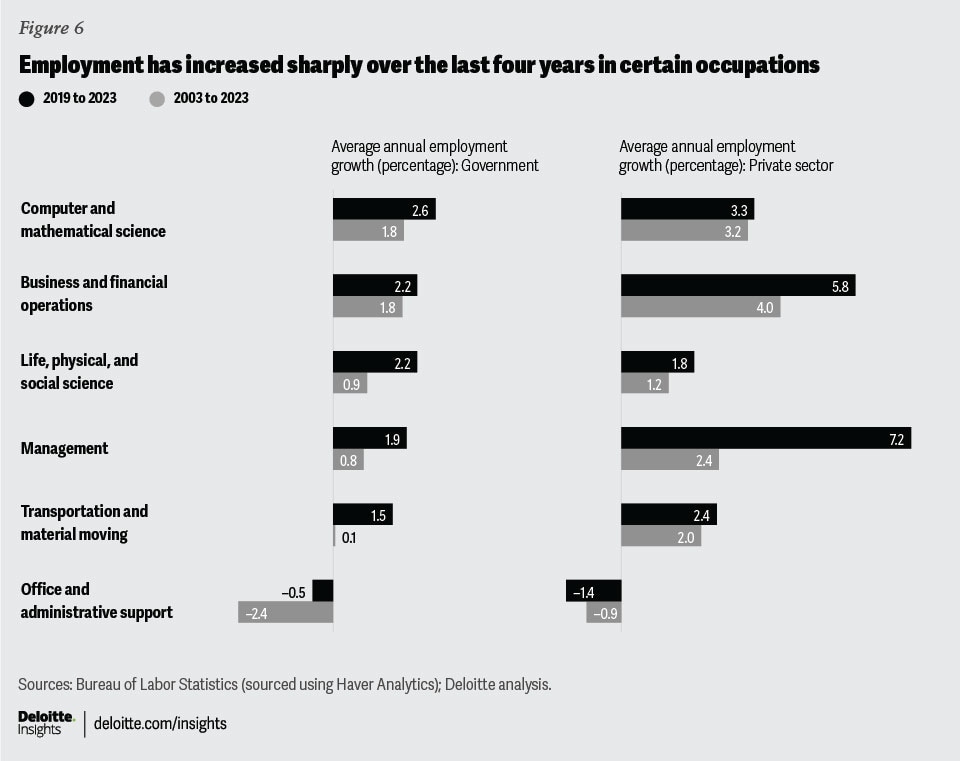
As government and business processes have evolved, both types of employers have been increasingly keen to hire specialists as tech workers and financial and management professionals enable these process changes.12 Figure 6 illustrates the growth rates in employment in some key occupations since 2003 in both the private sector and the government. For instance, employment in computer and mathematical science occupations—a vital part of the tech workforce13—has grown by 1.8% on average per year between 2003 and 2023 in the government; the equivalent increase in the private sector is even higher (3.2%). In fact, the rate of growth has risen in recent years as technology adoption accelerated with the COVID-19 pandemic likely acting as an accelerator.14 On the other hand, as technology’s role has expanded, demand for occupations like office and administrative support has declined.
It’s not just tech workers that are in demand; employment in occupations like business and financial operations has also gone up sharply for both the government and the private sector (figure 6) but with a difference. In the government, budget analysts, claims adjusters, examiners, and investigators have a bigger role—given the need for more extensive oversight in government—while the private sector has a much larger need for personal financial advisers, financial analysts, loan officers, insurance underwriters, and tax preparers.15
Figure 6 also shows that the fastest-growing occupations in the longer period between 2003 and 2023 continued in the more recent period between 2019 and 2023, but at a more rapid pace. With the strongest demand from these two types of employers continuing to overlap and intensify, the competition for specific types of talent will continue to be intense. While this requires the government to change its value proposition to compete better with the private sector—a topic covered in a previous paper by Deloitte experts16—what will also help is focused economic policy to bridge the gap between supply and demand of requisite talent in the labor market.