Article
5 minute read 16 December 2021

The tech workforce is expanding—and changing—as different sectors battle for talent

Economics Spotlight, December 2021

Akrur Barua

Akrur Barua

India

With technology’s ever-growing presence in every aspect of public, commercial, and personal life, the demand for tech talent is increasing rapidly. We look at how the tech workforce has evolved, and which sectors are driving this growth.

The spread of technological progress has never been so evident to the common observer as in the last decade. From e-commerce to fintech, digitization of businesses to the wide use of shared services such as taxi cabs, it’s apparent that technology now touches every aspect of household, commercial, and public life. In fact, shocks such as COVID-19 are only likely to accelerate technology adoption, heralding new ways in which we work, access public services, do business, and live. Driving this change is a core workforce with professionals such as engineers, programmers, information specialists, mathematicians, and data scientists. This is what we refer to as the technology (tech) workforce (see sidebar, “Six occupations make up the tech workforce in the economy”). In this workforce, occupations such as electronics engineers have been around for long, but others such as data science specialists have grown in prominence in recent years, due to growing importance of data to consumers, business, and governments. The increasing adoption of artificial intelligence (AI) and the Internet of Things (IoT) has also accelerated this trend, with businesses vying for talent with analytical skills.1

How has the tech workforce evolved over time? Which sectors employ most of the tech workforce? And are other sectors catching up as technology adoption increases? Analysis of the US labor market data by occupation from the Occupational Employment and Wage Statistics (OEWS)2 by the Bureau of Labor Statistics (BLS) reveals that the size of the tech workforce has grown by more than half and its share in total employment in the economy has increased by more than a percentage point in the last 20 years—with much of the increase occurring in the last couple of years. And while their presence in sectors such as professional, scientific, and technical services is sizable and has also increased significantly, other sectors are increasingly hiring more tech workers as they climb up the technology ladder.3

Six occupations make up the tech workforce in the economy

The OEWS data tracks wages and employment for close to 800 occupations, clubbed for ease of analysis under 22 broad occupations. A closer look at these occupations—both granular and broad—reveals that six occupations comprise the tech workforce (figure 1). Only one among these six, computer and mathematical science occupations, is a broad occupation category (part of the 22 broad ones we referred to earlier). Among the other five, four are suboccupations under architecture and engineering, while one is a suboccupation under management occupations. Within computer and mathematical science occupations, there are multiple suboccupations, some of which fall under the subset of computer occupations, while the others are referred to as mathematical occupations (figure 2).

The tech workforce has been growing steadily and now accounts for 4% of total employment

Analysis of trends in employment reveals that the tech workforce in 2020 was 5.5 million strong and has been growing at an average annual rate of 2.2% since 2001.4 The pace of growth is well above the 0.4% average rise per year for total employment in the economy during this period.5 As a result, the share of the tech workforce in total employment went up to 4% in 2020 from 2.9% in 2001 (figure 3). What is also evident from the data is that the pace of expansion in the tech workforce has gone up in recent years compared to a decade back, given the increasing focus of businesses and governments on technology and digitization, and the expansive use of data. For example, the tech workforce grew by 3.1% on average per year between 2010 and 2020, much higher than the 1.2% annual average rise during 2001–2010.

It is interesting to note that even during the pandemic, the tech workforce continued to expand, rising by 0.7% in 2020, when employment for all other occupations, taken together, contracted by 5.5%. This is likely due to two factors. First, as businesses diverted from in-person to remote work during the pandemic, investment in technology to support remote work went up and so did tech-related talent to support such moves. Second, the secular trend of rising demand for talent with advanced analytical skills continued through the pandemic as the digitization of businesses and economywide adoption of AI and the IoT likely intensified.

Not all occupations within the tech workforce have fared equally

While the size of the total tech workforce has been on a broad upward trend, not all occupations within this workforce have been growing. Computer and information systems managers, and computer and mathematical science occupations have been the key differentiators in driving growth in the tech workforce (figure 4). Between 2001 and 2020, employment in computer and information systems managers grew by 2.9% on average per year, while the corresponding growth in computer and mathematical science occupations was 2.6%. In contrast, employment of electronical and electrical engineering technicians fell 3.4% on average per year during this period. Over time, shares of computer and information systems managers, and computer and mathematical science occupations in the total tech workforce have gone up, while those for engineering occupations and technicians have declined (figure 5). This relative decline in demand for core engineering-related talent is most likely due to increased digitization and the rise of more sophisticated systems that may not require a proportionate increase in the engineering and technician talent pool. For example, the rise of cloud computing and related technologies has dented demand for talent working on the hardware side of router and disk management.6

That this trend has continued through the pandemic is evident from changes in employment numbers for the six occupations in 2020: Employment in computer and information systems managers (5.4%) and computer and mathematical science occupations (0.8%) went up last year, while it fell for the other four occupations.

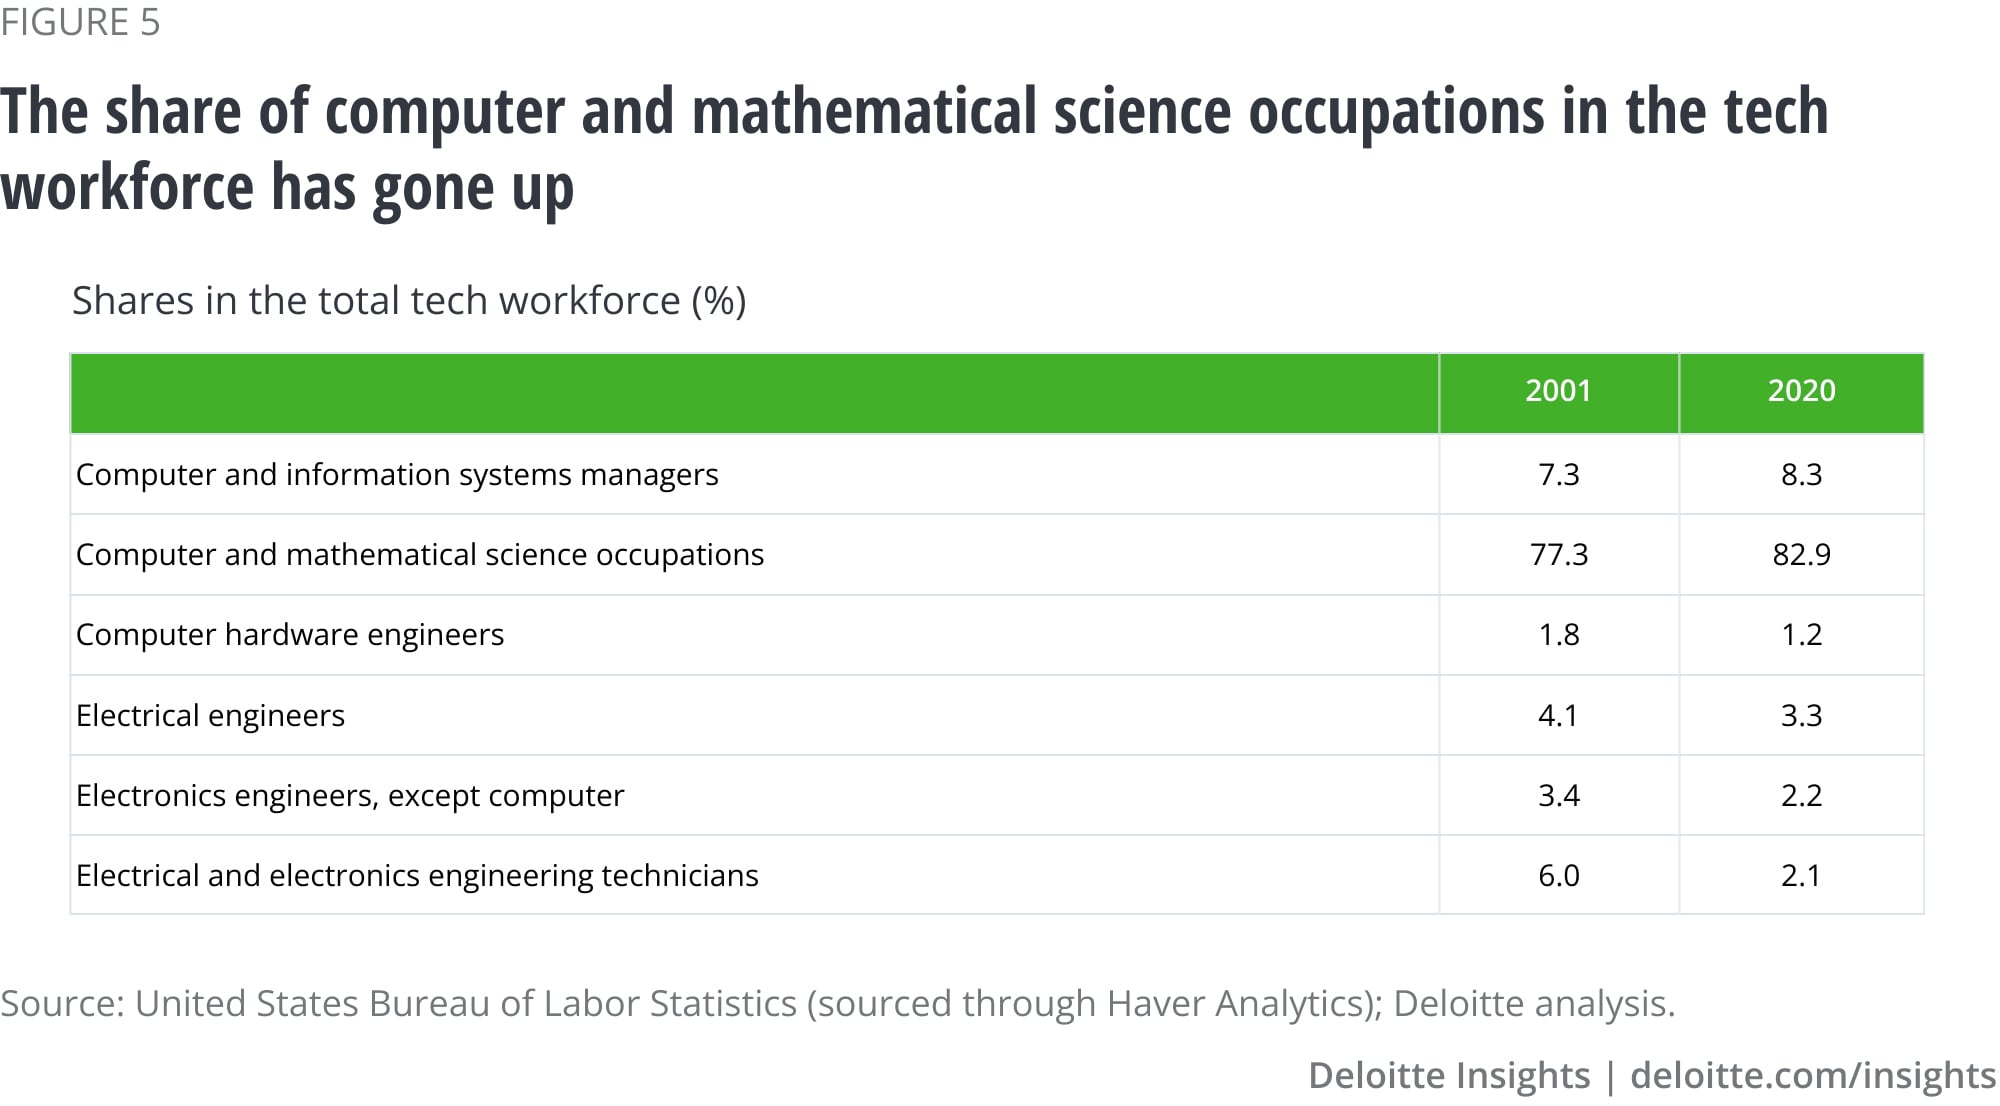
Analysis of trends7 within computer and mathematical science occupations reveals that mathematical science occupations (refer to the sidebar, “Six occupations make up the tech workforce in the economy” for more details) have grown at a faster pace than computer occupations in the last decade. For example, during 2012–2020, employment in mathematical occupations grew by 7.7% on average per year, buoyed likely by strong growth in jobs in statistical analysis and data sciences. Growth in computer occupations was lower (3%) during this period. No wonder then that the share of mathematical occupations within computer and mathematical science occupations went up to 5% in 2020 from 3% in 2012. Within computer occupations, information security analysts, which accounted for 3% of total computer and mathematical science occupations in 2020, grew by 8.3% on average per year during 2012–2020, while computer support specialists (share of 14% in 2020) went up 2.4%. The rise in employment for information security analysts isn’t surprising. As businesses go digital, they are increasingly worried about cybersecurity and data privacy and, hence, have been increasing investments in technology and talent to bolster their tech defenses.8 

Who’s hiring more of the tech workforce? The usual suspects and many more

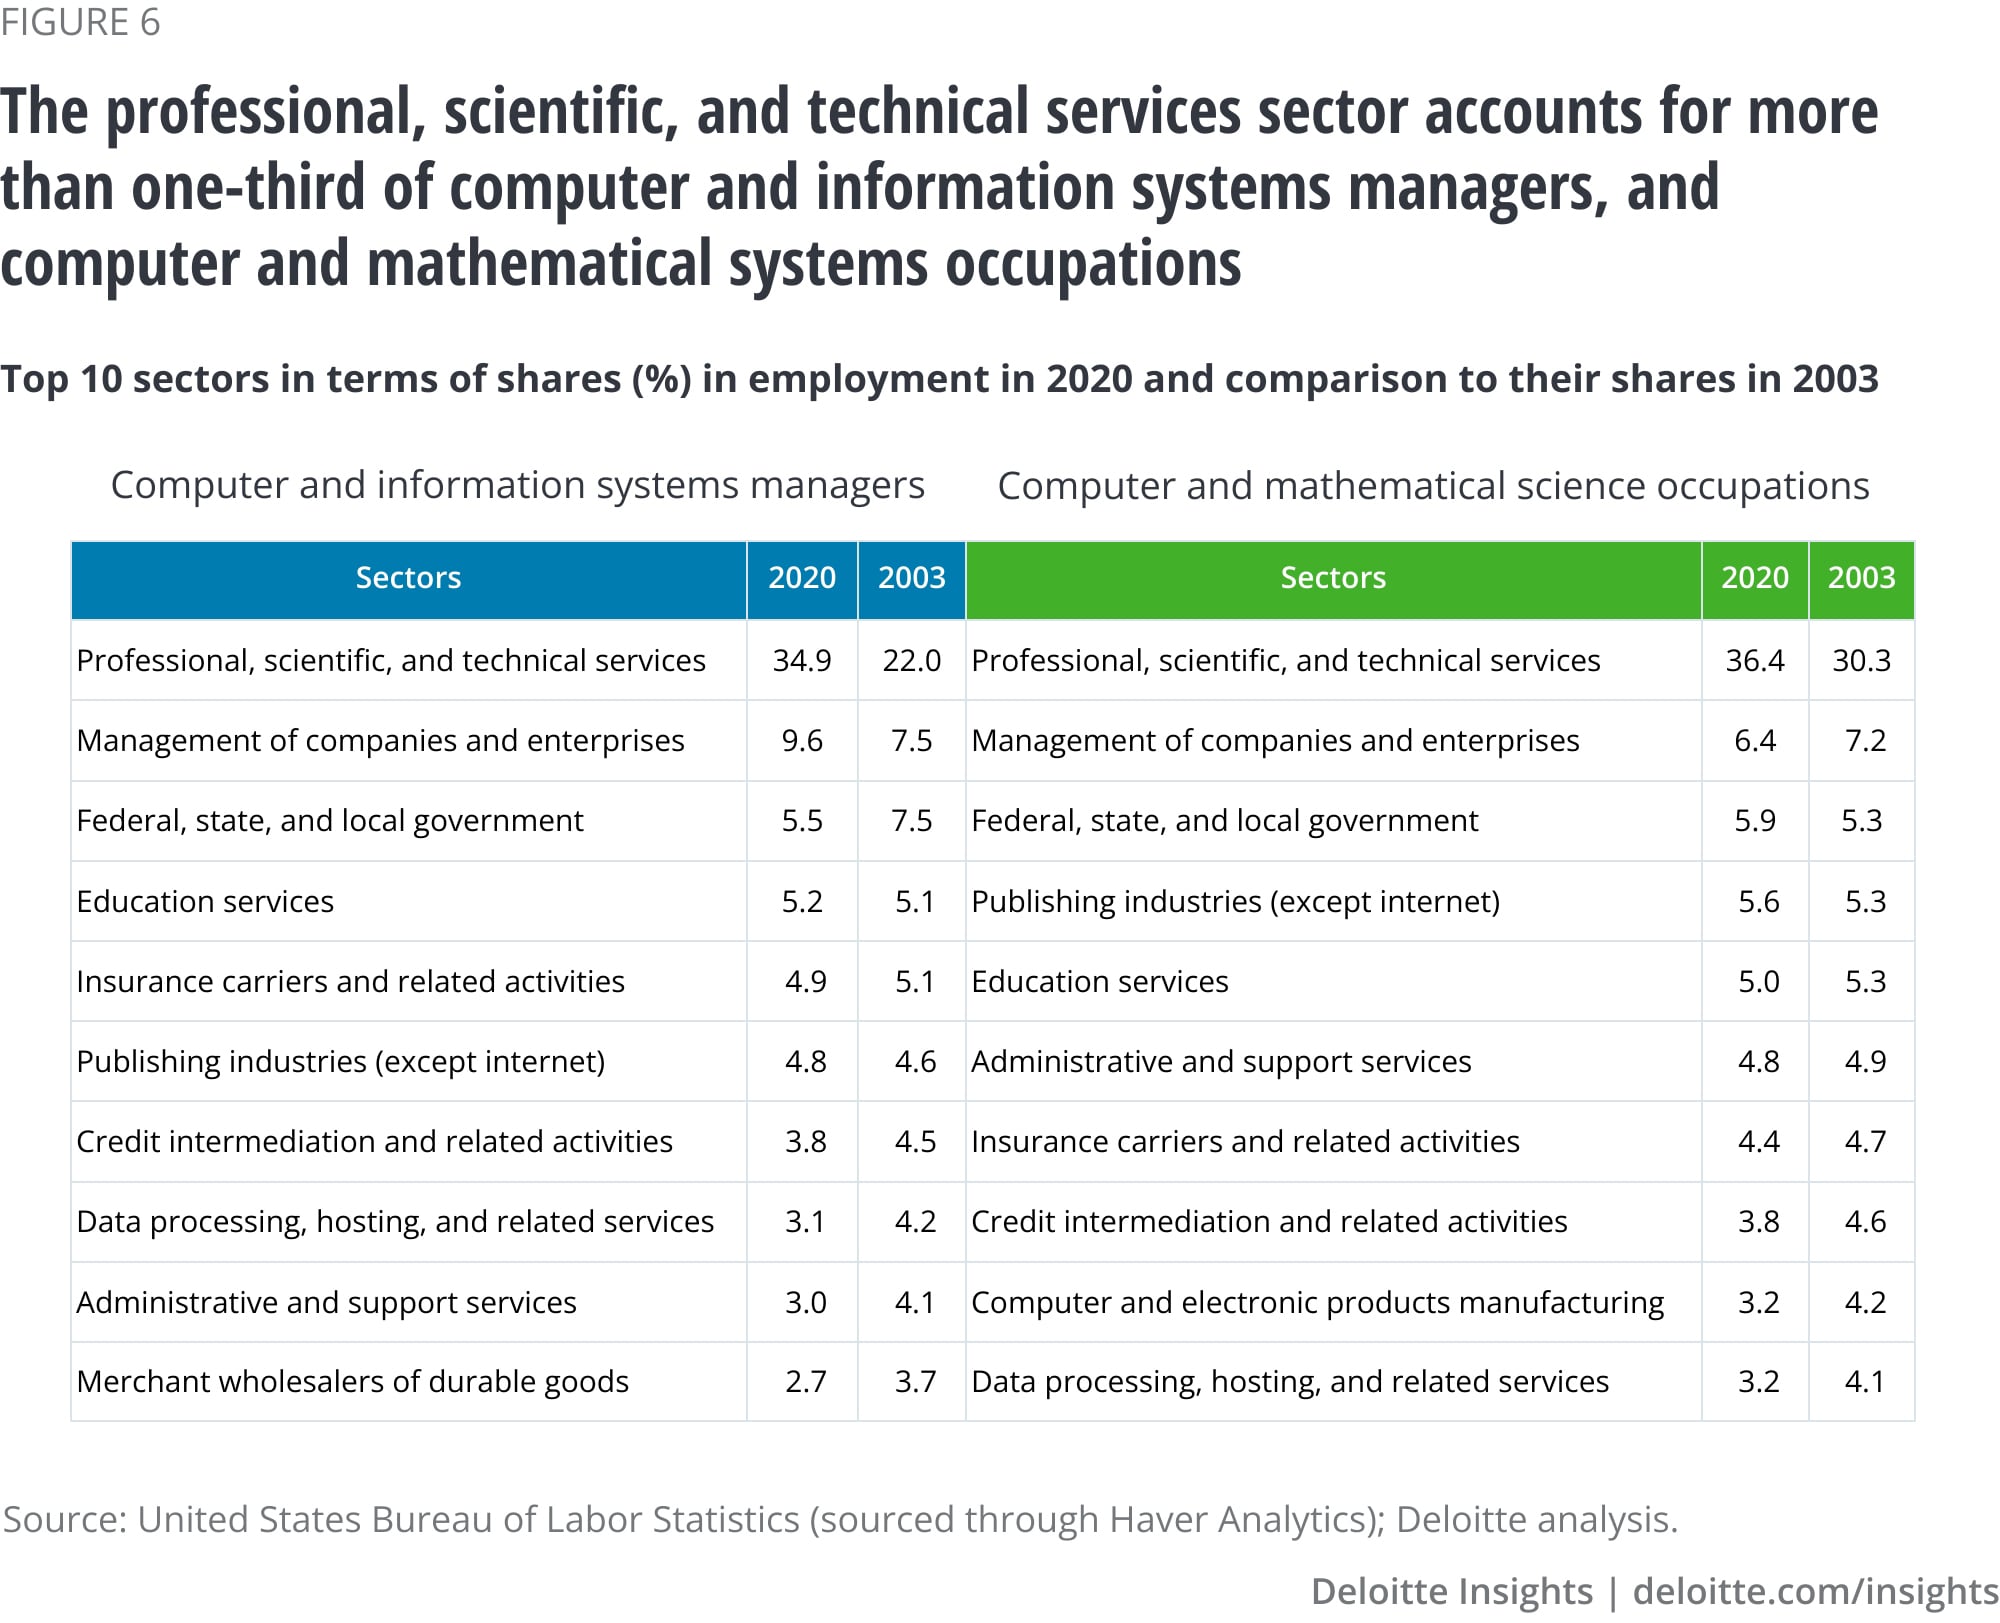
Which sectors account for a large share of the tech workforce? As technology spreads its presence in the economy, are we seeing any shifts? To answer these, the OEWS data again comes in handy. This database contains data on employment by sectors—88 of them. While there are gaps in the data for certain years, sectors, and occupations, there’s enough to draw some interesting conclusions on sector-level employment trends of the tech workforce.

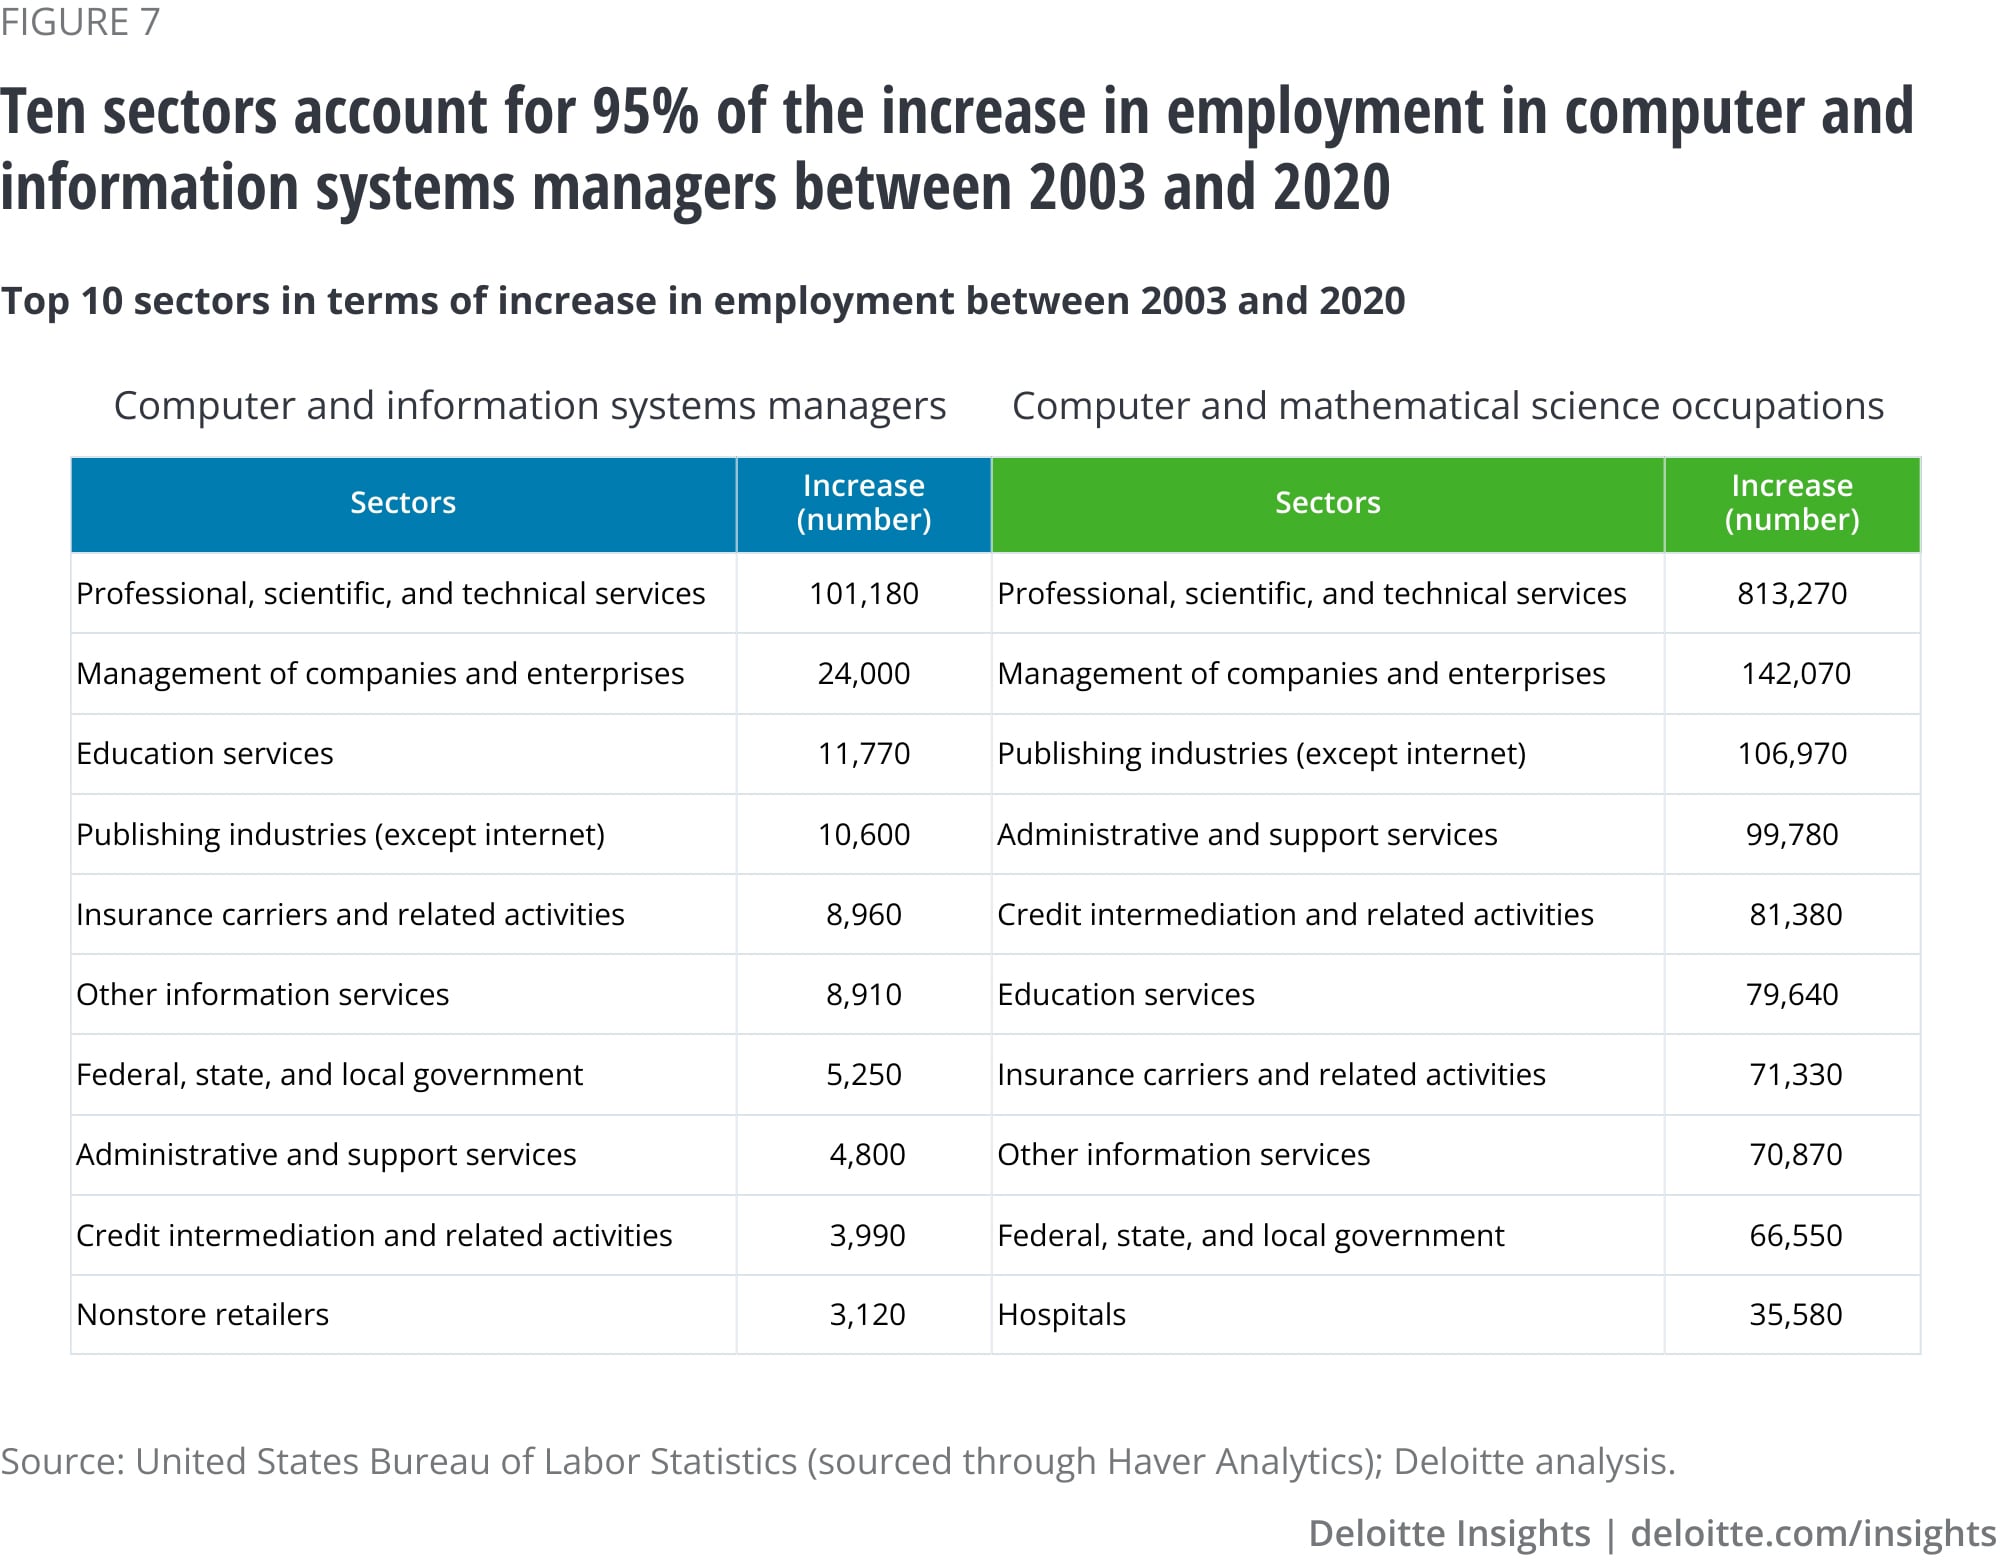
Analysis of employment data by sectors for computer and mathematical science occupations—which forms the bulk of the tech workforce—reveals that 10 key sectors employed nearly 78% of the workforce in 2020. Of these, professional, scientific, and technical services had the largest share (figure 6). The same is true for computer and information systems managers, where 34.9% of the workforce was engaged in the professional, scientific, and technical services sector. Interestingly, the sector—as figure 6 reveals—has strongly increased its presence in total employment for both the occupations over the years. That’s not surprising, given the strong growth in employment of both occupations in the sector. For example, the sector accounted for 46% of the nearly 1.8 million increase in personnel in the economy’s computer and mathematical science occupations between 2003 and 2020. Similarly, it accounted for 53% of the total increase in computer and information systems managers in the economy during this period. The trend of strong growth in the sector’s employment of these two key occupations within the tech workforce is most likely due to the rise of outsourcing, especially of professional and technical services—in light of increasing complexity, some sectors have chosen to purchase these services rather than keep this work in-house.

However, with increasing adoption of technology and digitization, and rising requirement for more data-driven and customer-focused strategies, sectors that are not traditionally tech-heavy such as education services, administrative services, government, and health care have recognized that technology is core to their businesses and are increasing their tech workforce (figure 7). For example, education services accounted for a net addition of 91,410 personnel from the two tech occupations cited above during 2003–2020. In addition, sectors such as banking and financial services, which have been early adopters of technology and facing increasing concerns about information security,9 are increasingly widening their tech talent pool. This is evident, for example, in the increase in the technology workforce for credit intermediation and related activities, which added 85,370 more tech-related personnel during this period.

In sectors such as education and finance, the emergence of ed-tech and fintech will likely add to this trend in the near to medium term. This is already visible in sectors such as retail, where nonstore retailers (primarily online shopping establishments) are increasing their tech workforce (figures 7 and 8) to handle the rise in ecommerce demand. Also, emerging concerns related to network management, network security, and cybercrimes will keep certain sections of the tech workforce, such as computer systems analysts, information security analysts, and network architects, in demand. That is likely one of the reasons why sectors such as oil and gas, which traditionally do not account for a large share of the tech workforce, are trying to attract more tech-related talent, as figure 8 shows.

The surge in employment in these sectors is in addition to the rise in tech talent in sectors traditionally linked to such a workforce, such as noninternet publishing; traditional broadcasting; data processing, hosting, and related services; computer and electronic production; and telecom. Yet, within this basket of sectors, the fastest pace of increase in employment for computer and mathematical science occupations, and computer and information systems managers has been in the other information services sector,10 which includes fast-growing businesses such as internet publishing, broadcasting, and web search portals. For example, between 2003 and 2020, the employment of computer and mathematical science occupations in the sector grew at an average annual rate of 21.6%, much higher than the corresponding growth for the whole workforce in that occupation (2.9%).   

Rising demand and high wages will lure talent, but businesses face rising costs

To start with, the tech workforce includes occupations that enjoy relatively high wages. In 2020, the occupation within this workforce that had the lowest median hourly wage was electrical and electronics engineering technicians. But, at US$32.5, this median hourly wage was much higher than the national average of US$20.2. And rising demand will ensure that wage growth remains relatively high: Median hourly wage for five out of these six occupations have been increasing faster, on average, than the national median wage (figure 9). Some suboccupations within computer and mathematical science occupations that are high in demand, such as statisticians and web developers, are witnessing an even faster rise in wages. As key sectors try to compete for the tech workforce, wage growth is likely to remain strong: Other information services, for example, which witnessed the highest pace of growth for computer and mathematical occupations during 2003–2020, also saw median wages rise the most during this period. 

Rising wages will keep occupations in the tech workforce, especially those in demand, a lucrative proposition for potential entrants into the workforce and will serve as an incentive for talent. The flipside, though, is that if this workforce doesn’t expand with strong growth in new entrants, it may make attracting tech-related talent tougher for businesses. With businesses in some sectors willing to outbid others in attracting talent, those that have traditionally been favorites for this workforce may find that they need to shell out more money to retain talent. Or they may have to reimagine their workplaces and the way they work to offer just the right nonmonetary incentives to keep employees happy and motivated enough to offset any lure of more money from other businesses in other sectors.

  1. Karthik Ramachandran and Jeanette Watson, Tech looks to analytics skills to bolster its workforce: Addressing the analysis talent shortage, Deloitte Insights, March 10, 2021. View in Article
  2. United States Bureau of Labor Statistics (US BLS), “Occupational employment and wage statistics,” accessed November 18, 2021. View in Article
  3. In this report “occupations” refers to the type of work and “sector” refers to the type of business employing the worker.View in Article
  4. US BLS, “Occupation employment and wage statistics,” sourced through Haver Analytics in November 2021. Unless otherwise stated, all data is from this source. View in Article
  5. Here the employment trends analysis is performed using the OEWS database from the BLS. View in Article
  6. Leslie Stevens-Huffman, “Tech jobs in danger of becoming extinct,” Dice, October 24, 2017; Ramachandran and Watson, Tech looks to analytics skills to bolster its workforce.  View in Article
  7. Analysis of this dataset is only possible for the period between 2012 and 2020 due to data gaps. Also, some of the occupations don’t have data for 2019 and 2020. View in Article
  8. Financial Times, “The inescapable problem of cyber attacks,” October 11, 2021; Center for Strategic and International Studies, “Significant cyber incidents,” accessed November 2021. View in Article
  9. Deloitte, Tech trends 2021: A financial services perspective, accessed November 2021. View in Article
  10. According to the North American Industry Classification System (NAICS), industries in Other information services include establishments supplying information, storing and providing access to information, searching and retrieving information, operating websites that use search engines to allow for searching information on the internet, or publishing and/or broadcasting content exclusively on the internet. The main components of the subsector are news syndicates, libraries, archives, exclusive Internet publishing and/or broadcasting, and web search portals.View in Article

The author would like to thank Patricia Buckley and Daniel Bachman, US Economics, and Susan Hogan, Deloitte Center for Integrated Research, for their reviews and suggestions on this article. The author would also like to thank Karthik Ramachandran, Deloitte Center for Technology, Media & Telecommunications, for his help in ideation, research guidance, and reviews.

Cover image by: Molly Woodworth

Deloitte Global Economist Network

The Deloitte Global Economist Network is a diverse group of economists that produce relevant, interesting and thought-provoking content for external and internal audiences. The Network’s industry and economics expertise allows us to bring sophisticated analysis to complex industry-based questions. Publications range from in-depth reports and thought leadership examining critical issues to executive briefs aimed at keeping Deloitte’s top management and partners abreast of topical issues.

Patricia Buckley

Patricia Buckley

Chief US economist

Subscribe

to receive more business insights, analysis, and perspectives from Deloitte Insights