Edison Electric Institute, America’s electric companies are leading on clean energy, accessed May 17, 2023.
View in ArticleGregory Aliff, The math does not lie, Deloitte, accessed May 17, 2023.
View in ArticleIvan Penn, “Get ready for another energy price spike: High electric bills,” New York Times, May 3, 2022.
View in ArticleUS Energy Information Administration, “US energy consumption increases between 0% and 15% by 2050,” Today in Energy, April 3, 2023.
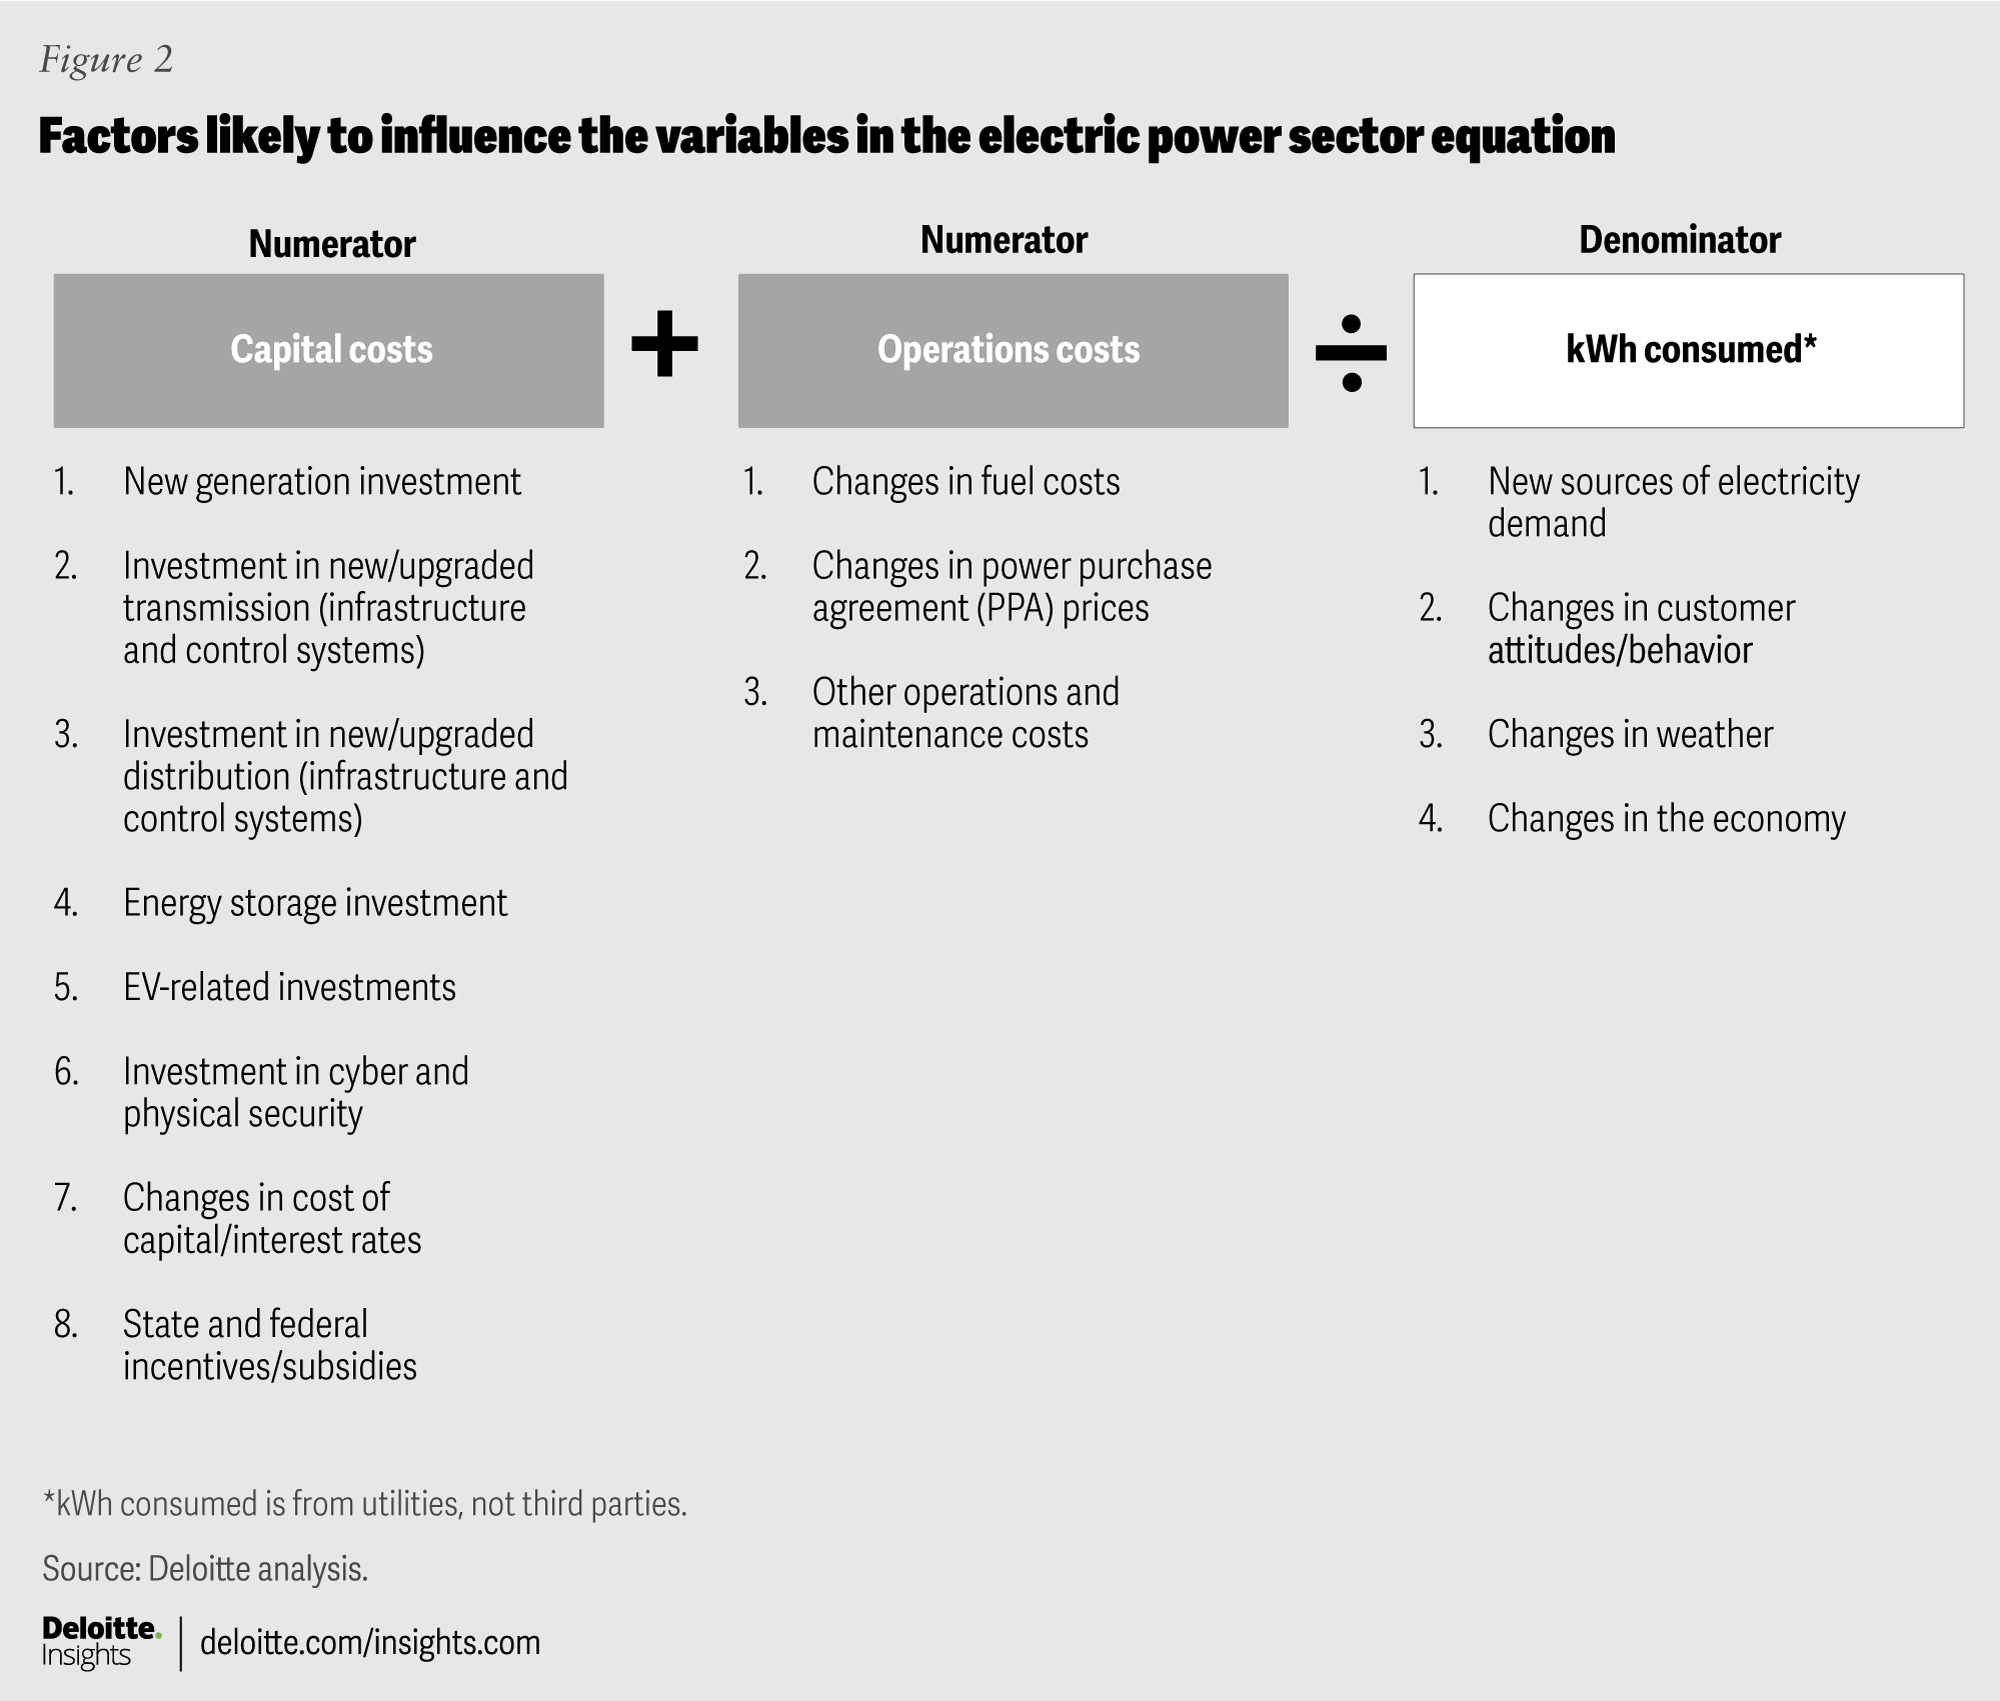
View in ArticleThe authors recognize that electricity tariffs include a fixed demand charge and an energy charge based on consumption in terms of kilowatt hours (kWh). In most electric utilities (except those where regulators have adopted full “decoupling” or a straight fixed-variable rate design), the dominant revenue-recovery mechanism for electric utilities is the kWh charge. Thus, in the spirit of keeping it simple, this paper addresses the cost of electricity on a kWh basis rather than dividing the cost between demand and energy components.
View in ArticleUS EIA, Short-term energy outlook, accessed April 16, 2022.
View in ArticleLilian Federico et al., The big picture: 2023 electric, natural gas and water utilities outlook, S&P Global Market Intelligence, November 2, 2022.
View in ArticleElectric Power Monthly, “Net generation by energy source: Total (all sectors), 2013–February 2023,” EIA, accessed May 2023.
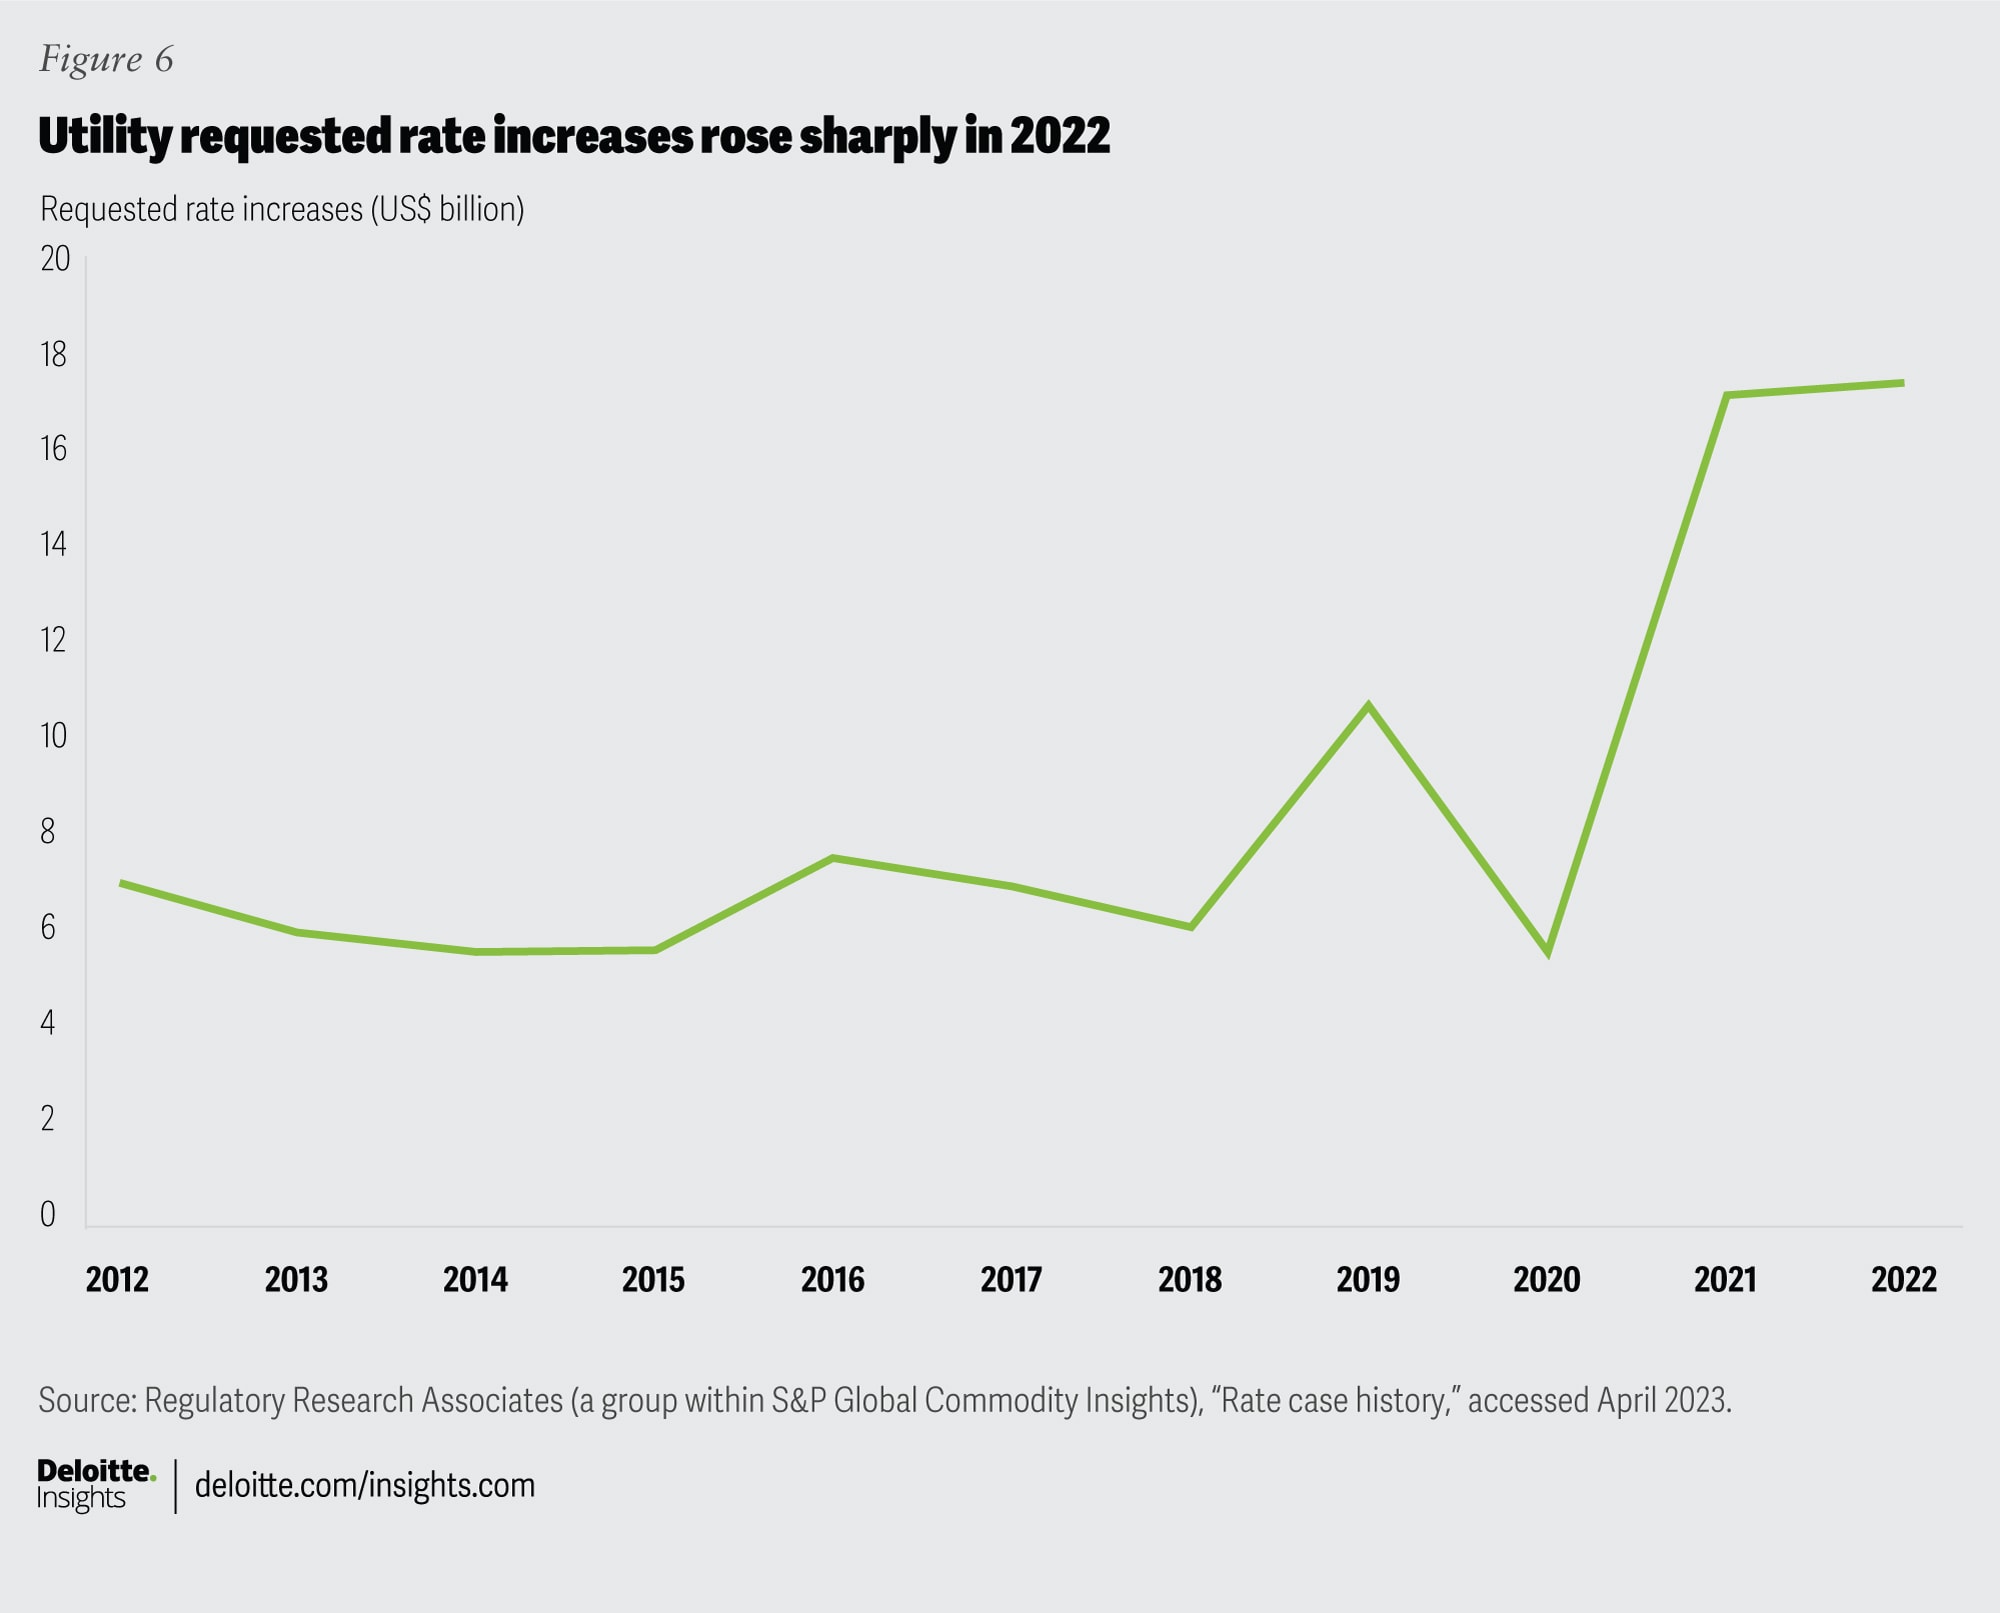
View in ArticleBrian Collins, “US retail electric prices rise by largest factor in more than 4 decades,” S&P Global Market Intelligence, April 5, 2023.
View in ArticleCAPIQ, “Rate-cases,” S&P Global, accessed April 9, 2023.
View in ArticleBrian Collins, Jason Lehmann, Dan Lowrey and Heike Doerr, “Seismic shift in capex plans reported by utilities for 2023 through 2025,” S&P Global Market Intelligence, March 16, 2023.
View in ArticleIbid.
View in ArticleWe projected the capital expenditure (capex) range from 2023–2030 by extrapolating the historical compound annual growth rate (CAGR) of spending for a group of the 38 largest electric and multiutility companies, as reported by S&P Global Market Intelligence on March 16, 2023, using a CAGR range of 5%–8% based on analysis of historical growth rates during five-year periods from 2014 to 2022.
View in ArticleWe calculated the new generation investments for 2023–2030 using the range of generation investment’s share in the historical total capex over 2016–2022 by the Edison Electric Institute (EEI), which was between 24% and 35% annually. We extrapolated these percentages forward as a proportion of our estimated total capex for the period (described in endnote 13).
View in ArticleFederico et al., The big picture: 2023 electric, natural gas and water utilities outlook.
View in ArticleEIA, “Wind, solar, and batteries increasingly account for more new US power capacity additions,” Cleantechnica.com, March 6, 2023.
View in ArticleIbid.
View in ArticleThe White House, “Fact Sheet: Biden-Harris administration announces new actions to expand US offshore wind energy,” press release, September 15, 2022.
View in ArticleThe White House, Building a clean energy economy: A guidebook to the Inflation Reduction Act’s investments in clean energy and climate action—Version 2, Cleanenergy.gov, January 2, 2023.
View in ArticleWe calculated the transmission investments for 2023–2030 using the range of transmission investments’ share in the historical total capex over 2016–2022 provided by the EEI, which was between 17% and 20% annually. We extrapolated these percentages forward as a proportion of our estimated total capex for the period (described in endnote 13).
View in ArticleUS Department of Energy (DOE), “Biden administration launches $2.5 billion fund to modernize and expand capacity of America’s power grid,” May 10, 2022.
View in ArticleEmma Penrod, “US grid interconnection backlog jumps 40%, with wait times expected to grow as IRA spurs more renewables,” Utility Dive, April 11, 2023.
View in ArticleIbid.
View in ArticleEthan Howland, US grid congestion costs soared to $13.3B in 2021, will likely grow until transmission capacity is built: Report, Utility Dive, April 14, 2023.
View in ArticleDOE, “Biden administration launches $2.5 billion fund to modernize and expand capacity of America’s power grid.”
View in ArticleWe estimated investment in advanced technologies by calculating 7% of the total transmission investment, derived from the historical splits provided by EEI’s CapEx Taxonomy for adaptation, hardening, and resilience.
View in ArticleDOE, “Biden administration launches $2.5 billion fund to modernize and expand capacity of America’s power grid.”
View in ArticleWe calculated the distribution investments for 2023–2030 using the range of distribution investment’s share in the historical total capex over 2016–2022 provided by the EEI, which was between 27% to 33% annually. We extrapolated these percentages forward as a proportion of our estimated total capex for the period (described in endnote 13).
View in ArticleAndrew Moore, “Lights out: Climate change could plunge America into darkness. Here's why,” College of Natural Resources News, March 8, 2021.
View in ArticleWe estimated investment in advanced technologies by calculating 12% of the total distribution investment, derived from the historical splits provided by EEI’s CapEx Taxonomy for adaptation, hardening, and resilience.
View in ArticleDeloitte Insights, Digital technology solutions for utilities, collection, accessed May 17, 2023.
View in ArticleJennifer Hiller, ”Utility bills rise as Americans pay off storm-recovery costs for decades to come,” Wall Street Journal, December 11, 2022.
View in ArticleEEI, America’s electric companies: Delivering resilient clean energy across our economy—Electric Power Industry Outlook, February 21, 2023.
View in ArticleJim Thomson et al., Carbon-proofing the grid: Increasing renewables and resilience, Deloitte Insights, February 24, 2022.
View in ArticleUS Government, “Public law 117–58 (Infrastructure Investment and Jobs Act),” Congress.gov, November 15, 2021.
View in ArticleWe calculated the installed utility-scale battery-storage capacity based on NREL, S&P Global Market Intelligence, and Energy Storage Association (ESA) data in the sources referenced below. We multiplied the forecasted new installed capacity by the forecasted overnight capital cost for utility-scale battery-storage installations from NREL’s Storage Futures Study, May 2021; see: Tony Lenoir and Aude Marjolin, Charging up on battery energy storage 101, US market outlook, S&P Global Market Intelligence, March 27, 2023; NREL, Storage Futures Study, May 2021; ESA, Enabling the clean power transformation, August 2020.
View in ArticleBloombergNEF, “Lithium-ion battery pack prices rise for first time to an average of $151/kWh,” December 6, 2022.
View in ArticleNREL, Grid-scale US storage capacity could grow five-fold by 2050, June 1, 2021.
View in ArticleLenoir and Marjolin, Charging up on battery energy storage 101, US market outlook.
View in ArticleAdam Gerza, ”Standalone energy storage—Investment tax credit (ITC) in the Inflation Reduction Act of 2022,” Energy Toolbase, August 2, 2022.
View in ArticleCongressional Research Service, Energy and minerals provisions in the Infrastructure Investment and Jobs Act, March 31, 2023.
View in ArticleIbid.
View in ArticleEEI, “EEI projects 26.4 million electric vehicles will be on US roads in 2030,” press release, June 20,2022.
View in ArticleIbid.
View in ArticleCharles Satterfield and Kellen Schefter, Electric vehicle sales and the charging infrastructure required through 2030, EEI, June 2022, p. 4.
View in ArticleTo estimate EV infrastructure investment, we multiplied the average capital cost per charger from the International Council on Clean Transportation by the number of required chargers as projected by EEI through 2030.
View in ArticleSatterfield and Schefter, Electric vehicle sales and the charging infrastructure required through 2030, p. 15.
View in ArticleLouis Columbus, “Benchmarking your cybersecurity budget in 2023,” Venture Beat, February 16, 2023.
View in ArticleRobert Walton, ”New White House cyber strategy could drive utility costs higher, warns security expert,” Utility Dive, March 6, 2023.
View in ArticleDOE, Cybersecurity considerations for distributed energy resources on the US electric grid, October 2022, pp. 17–18; North American Electric Reliability Corporation, “Frequently asked questions,” August 2013, p. 1.
View in ArticleWalton, “New White House cyber strategy could drive utility costs higher, warns security expert.”
View in ArticleDr. Daniel Bachman, Deloitte economist.
View in ArticleOur “over US$500 billion” estimate is derived from the sum of the amounts estimated for IIJA, IRA, and CHIPS Act legislations in the sidebar.
View in ArticleJeffrey Tomich and Kristi E. Swartz, “Utility CEOs expect climate law to boost profits, lower rates,” Energywire, October 28, 2022.
View in ArticleAmerican Clean Power, Clean energy investing in America Q1 2023 report, Cleanpower.org, April 2023, pp. 8–9.
View in ArticleIbid. p. 9.
View in ArticleUS Government, “Public law 117-58 (Infrastructure Investment and Jobs Act).”
View in ArticleUS Government, “Public law 117–169 (Inflation Reduction Act of 2022),” Congress.gov, August 16, 2022.
View in ArticleLachlan Carey and Jun Ukita Shepard, “Congress’s climate triple whammy: Innovation, investment, and industrial policy,” RMI, August 22, 2022.
View in ArticleElectric Power Monthly, “Net generation by energy source: Total (all sectors), 2013–February 2023,” EIA, accessed May 2023; Tyler Hodge, “EIA expects significant increases in wholesale electricity prices this summer,” Today in Energy, EIA, June 16, 2022.
View in ArticleEIA, “Electricity data browser,” accessed April 2023.
View in ArticleIbid.
View in ArticlePenn, “Get ready for another energy price spike.”
View in ArticleAllison Good, “Interest rates, inflation could crimp utilities' spending plans,” S&P Global Market Intelligence, March 11, 2022.
View in ArticleEIA, Annual energy outlook 2023, March 16, 2023.
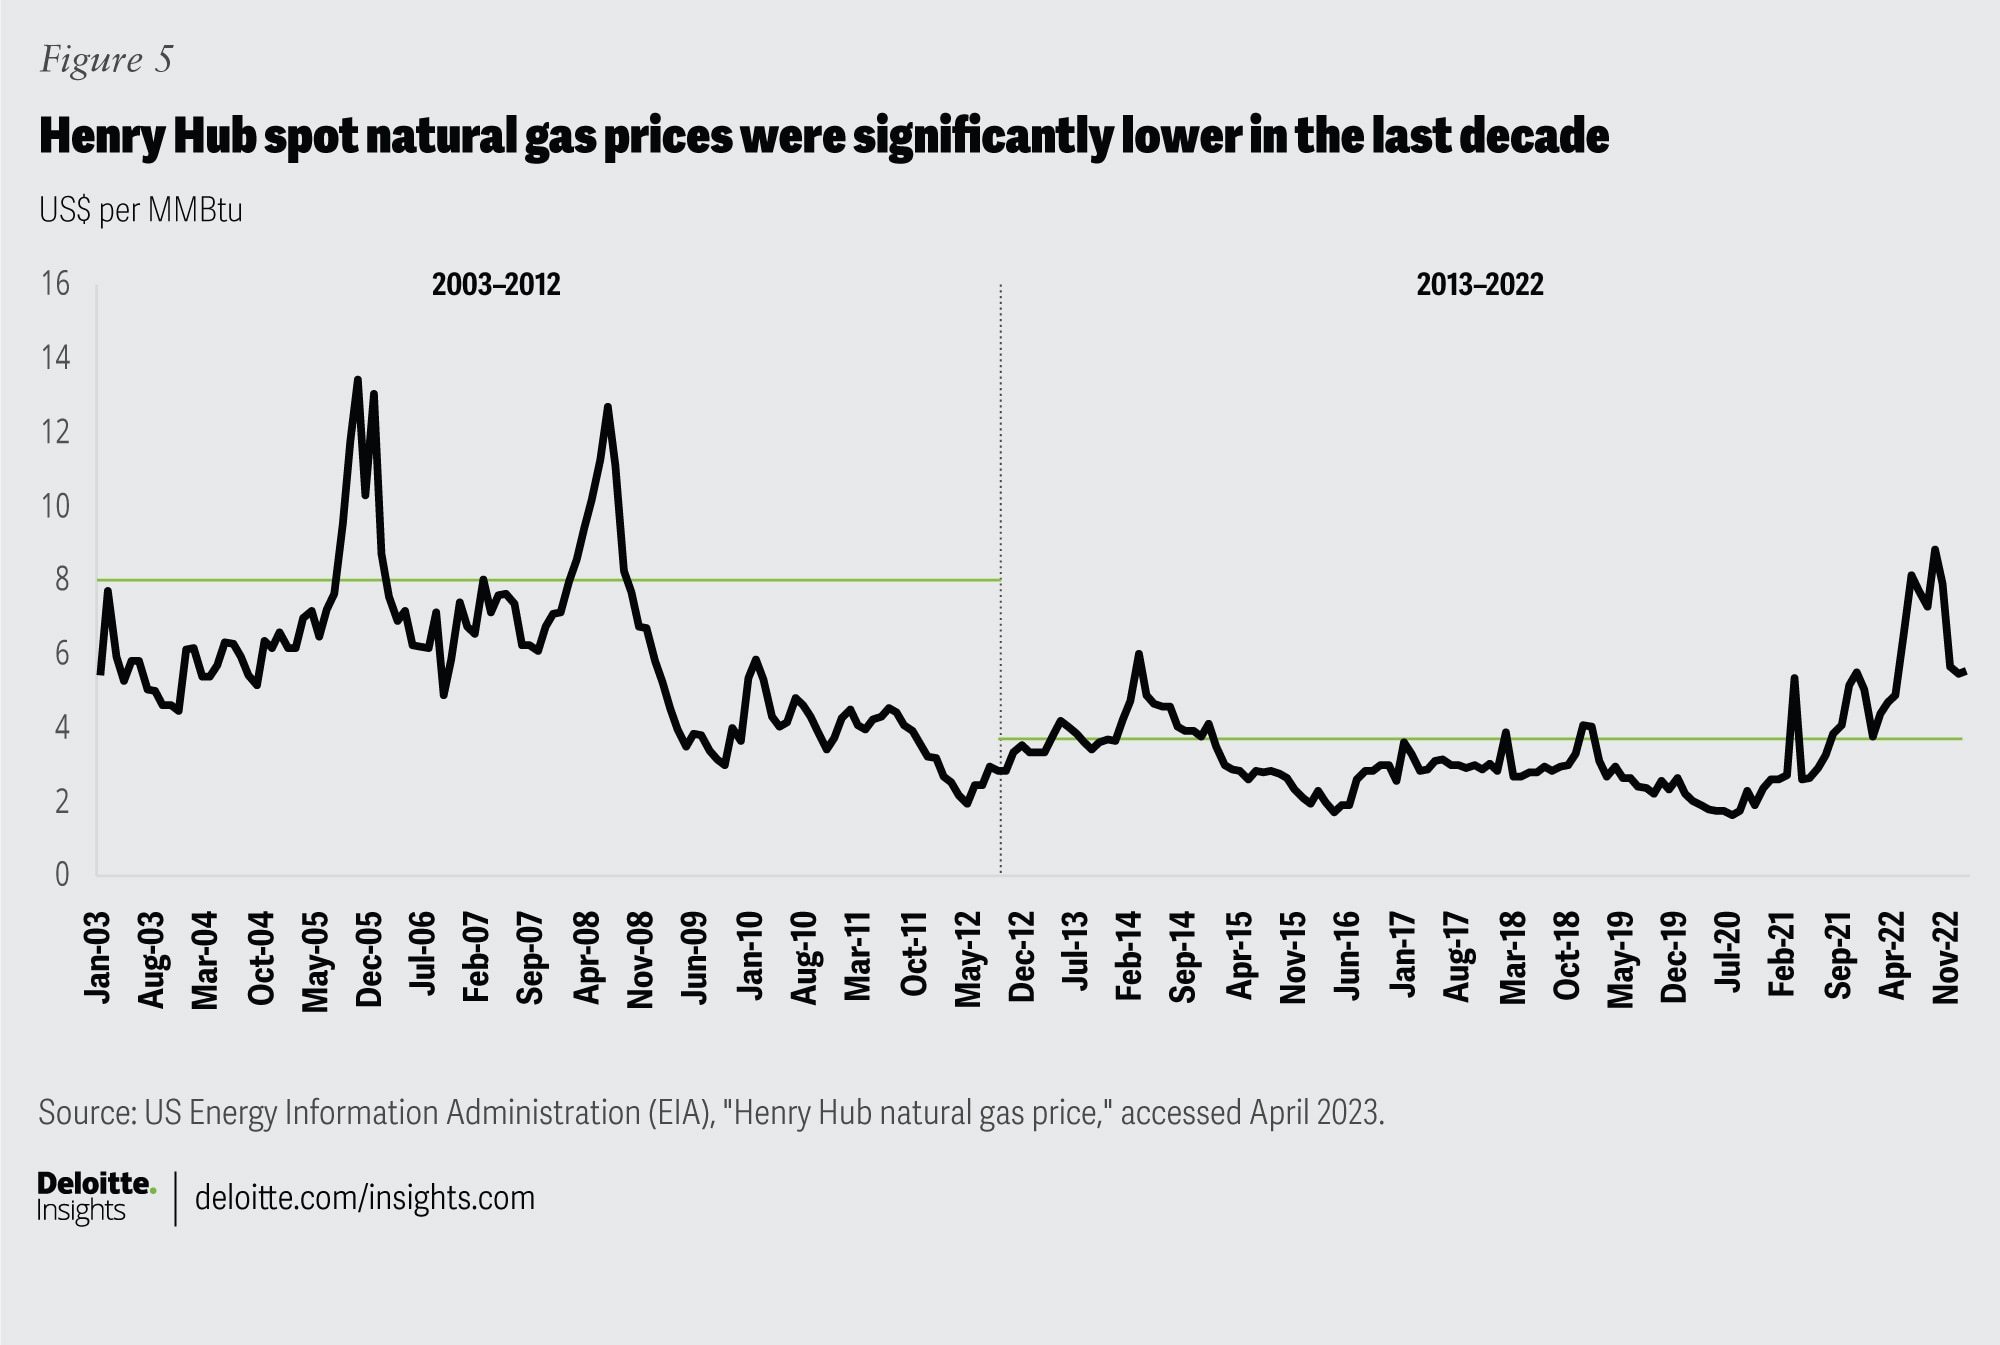
View in ArticleDavid Uberti and Ryan Dezember, “Why gas bills are going crazy—With no end in sight,” Wall Street Journal, March 15, 2023.
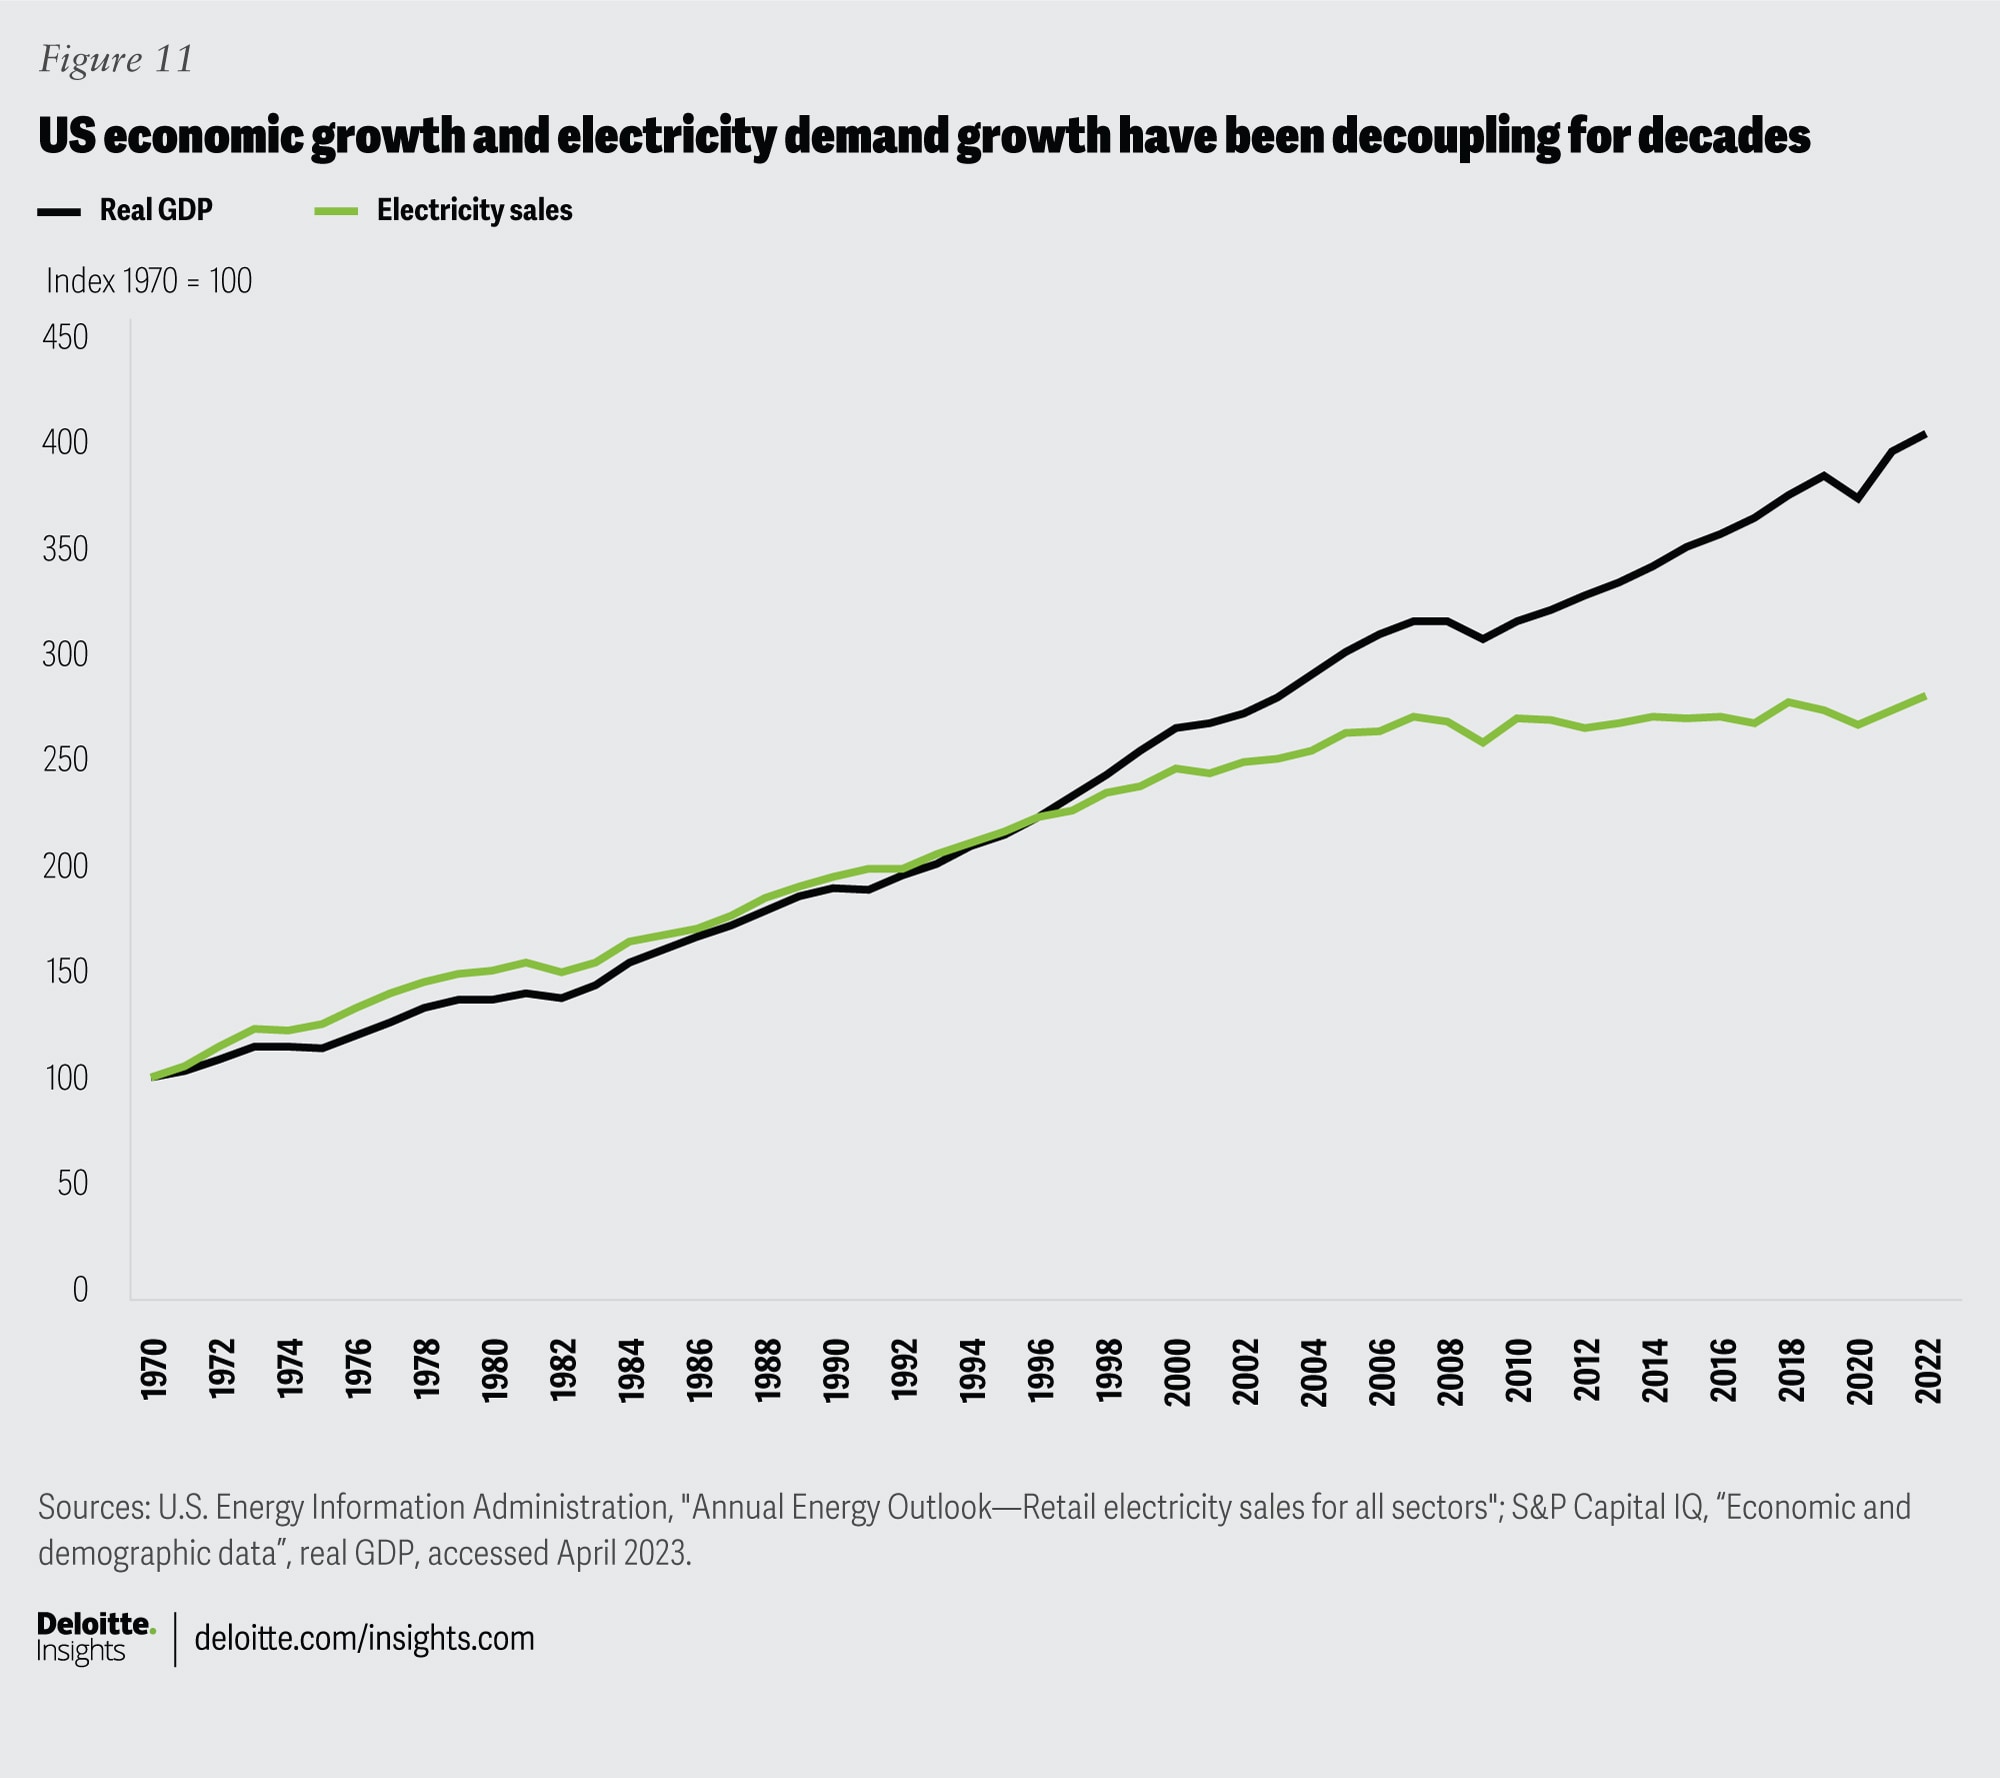
View in ArticleDeloitte analysis of AEO 2023 data.
View in ArticleThis is our deduction. For a utility example of similar reasoning, see: Portland General Electric, Clean energy plan and integrated resource plan 2023—chapter 4, accessed May 17, 2023, p. 82.
View in ArticleLevelTen Energy, “North American solar and wind PPA prices increased 6.6% in Q1 of 2023, marking two years of rising prices, according to LevelTen Energy,” press release, April 18, 2023.
View in ArticleIbid.
View in ArticleLori Aniti, “Major utilities’ spending on the electric distribution system continues to increase,” Today in Energy, May 27, 2021.
View in ArticleWood Mackenzie Supply Chain, “Impact of potential labor shortages on costs for North American utilities,” Wood Mackenzie Cost Insights, June 17, 2021.
View in ArticleThe statements in this paragraph were based on information in the Q4 2022 company earnings call transcripts from multiple electric companies, such as Entergy, Edison International, CenterPoint Energy, and IDACORP, Inc.
View in ArticleGary McAuliffe, “Addressing the challenges presented by a retiring utility workforce,” POWER, June 22, 2022.
View in ArticleThe term “demand” used here denotes “consumption” of electricity rather than the rate of consumption.
View in ArticleUS Census Bureau, “Growth in US population shows early indication of recovery amid COVID-19 pandemic,” press release, December 22, 2022.
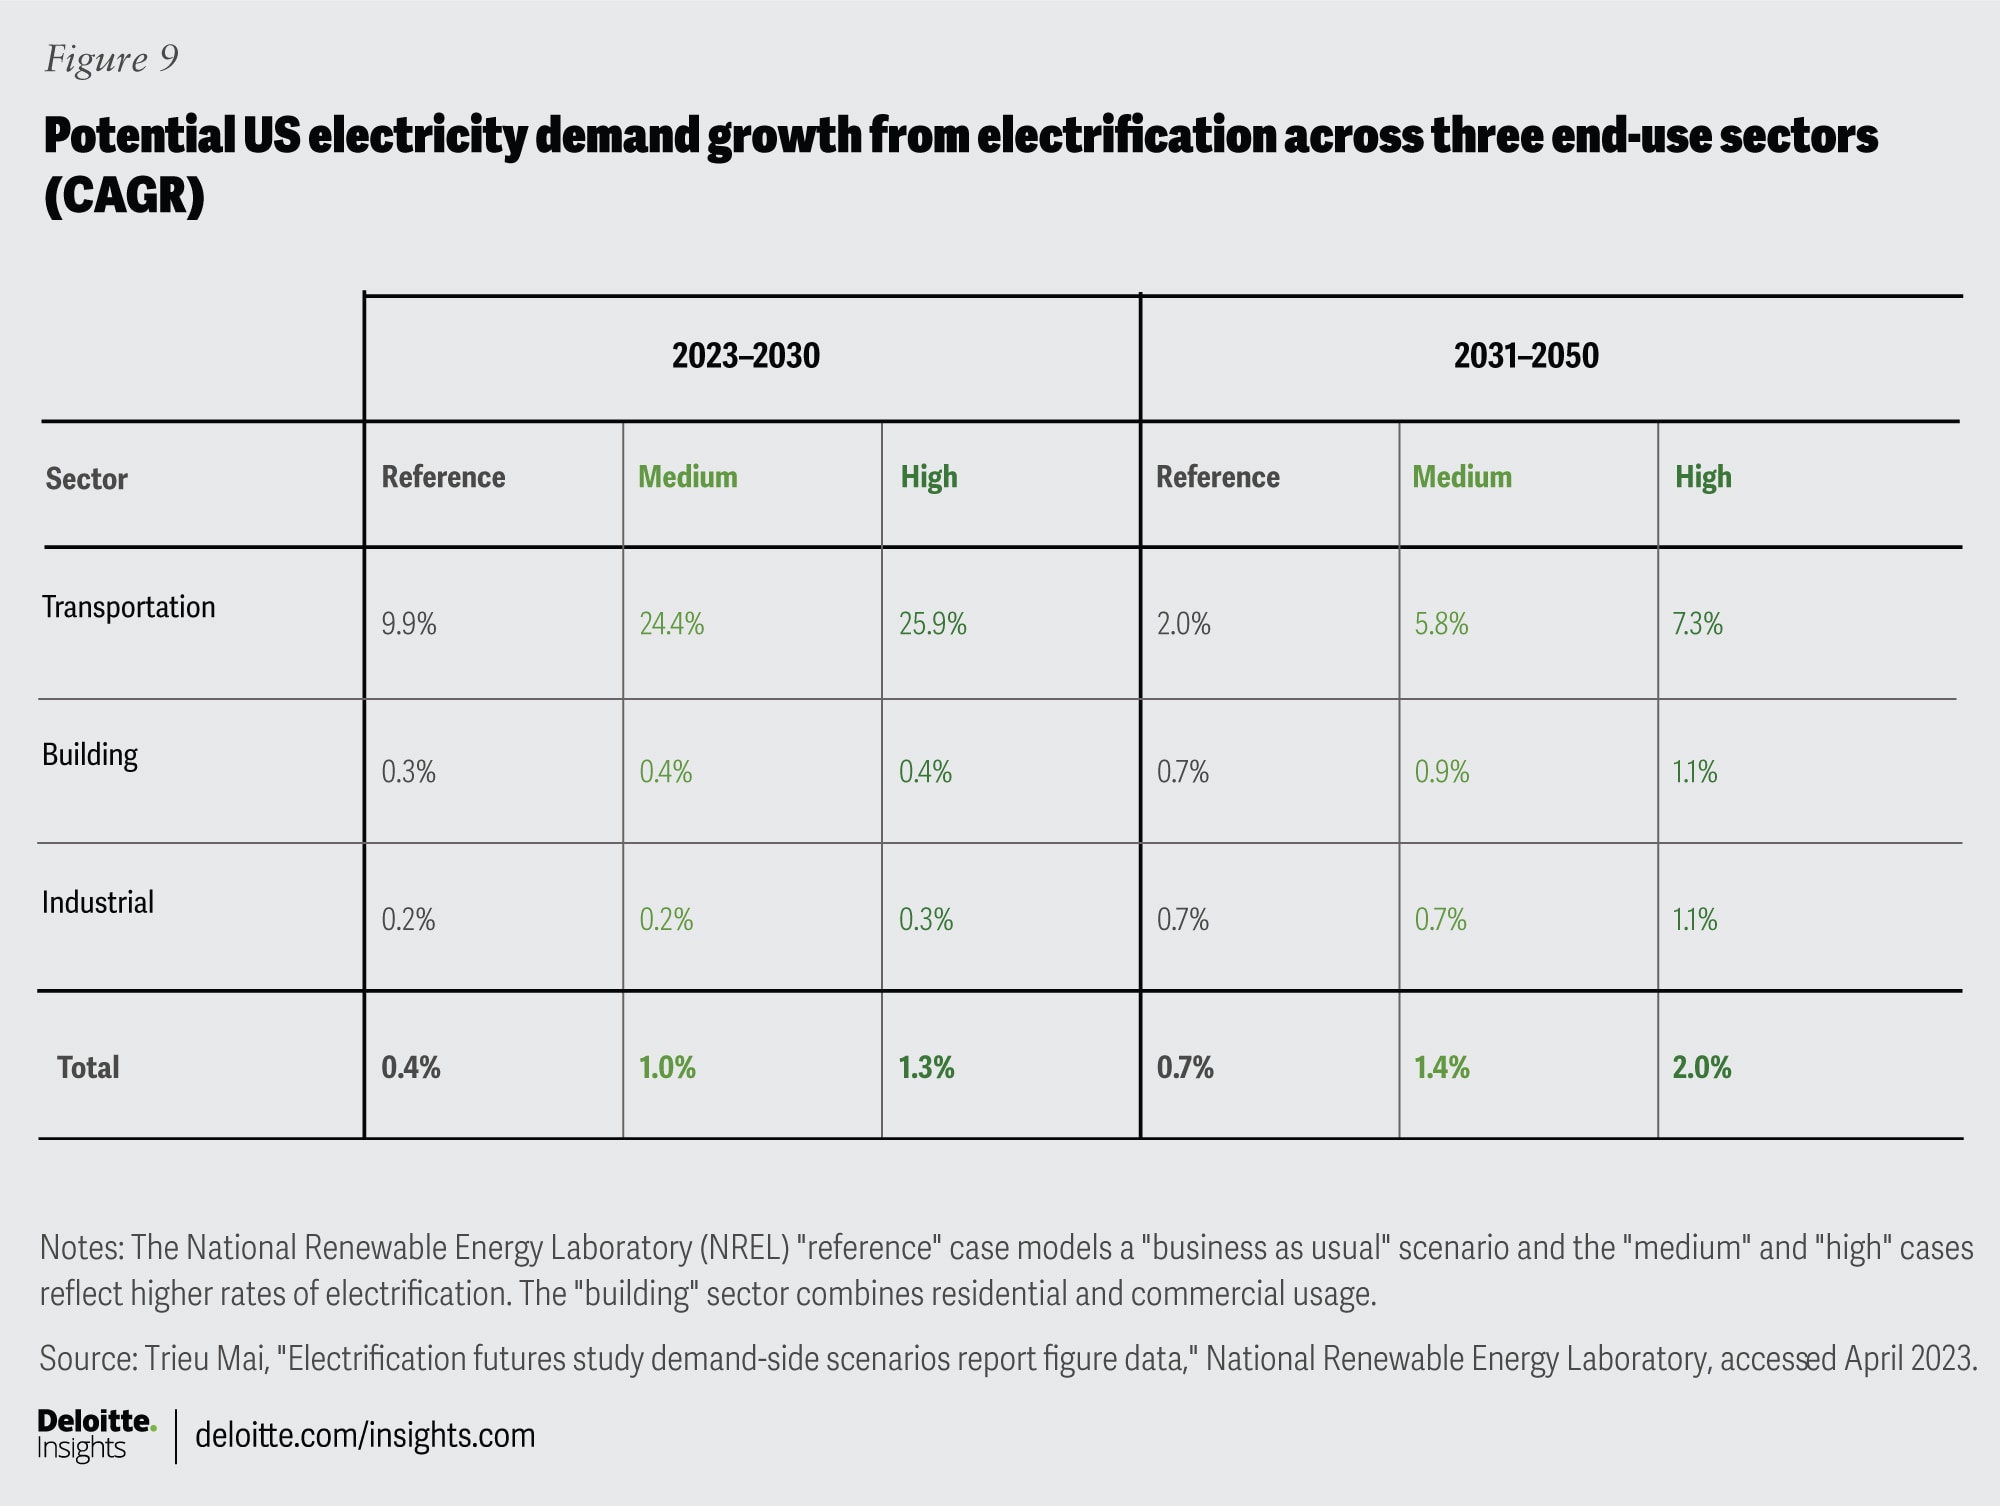
View in ArticleJavier Colato and Lindsey Ice, “Charging into the future: The transition to electric vehicles,” Beyond the Numbers 12, no. 4 (2023).
View in ArticleSaverio Zefelippo, “Industrial decarbonization is impossible without transforming heat generation,” Illuminem, March 13, 2023.
View in ArticleCA.gov, “CPUC adopts transportation electrification program to help accelerate electric vehicle adoption,” press release, November 17, 2022; NRDC, “CA building decarbonization: What’s coming in 2022?,” February 23, 2022.
View in ArticleEdison International Q4 2022 earnings call transcript.
View in ArticleMother Jones, “What ‘Electrify everything’ actually looks like,” May–June 2023; Molly Seltzer, “Princeton energy and climate experts weigh in the impact of the Inflation Reduction Act,” Princeton University Center for Policy Research on Energy and the Environment, August 25, 2022.
View in ArticleDarren Sweeney, “Utility execs prepare for ‘tripling’ of electricity demand by 2050,” S&P Global Market Intelligence, April 19, 2023.
View in ArticleUsing NREL’s State Level Electric Energy Efficiency Potential Estimates, we have calculated the potential savings from energy efficiency measures and advanced technologies. Our analysis considered a range of incentives and scenarios, validated by secondary research.
View in ArticleEIA, Annual energy outlook 2023.
View in ArticleEIA estimates that small-scale solar PV systems generated 58 billion kWh of electricity in 2022 compared to 4,243 billion kWh of utility-scale generation from all sources; see: EIA, “Frequently asked questions,” accessed May 17, 2023.
View in ArticleUS EPA, “Climate change indicators: High and low temperatures,” accessed May 17, 2023.
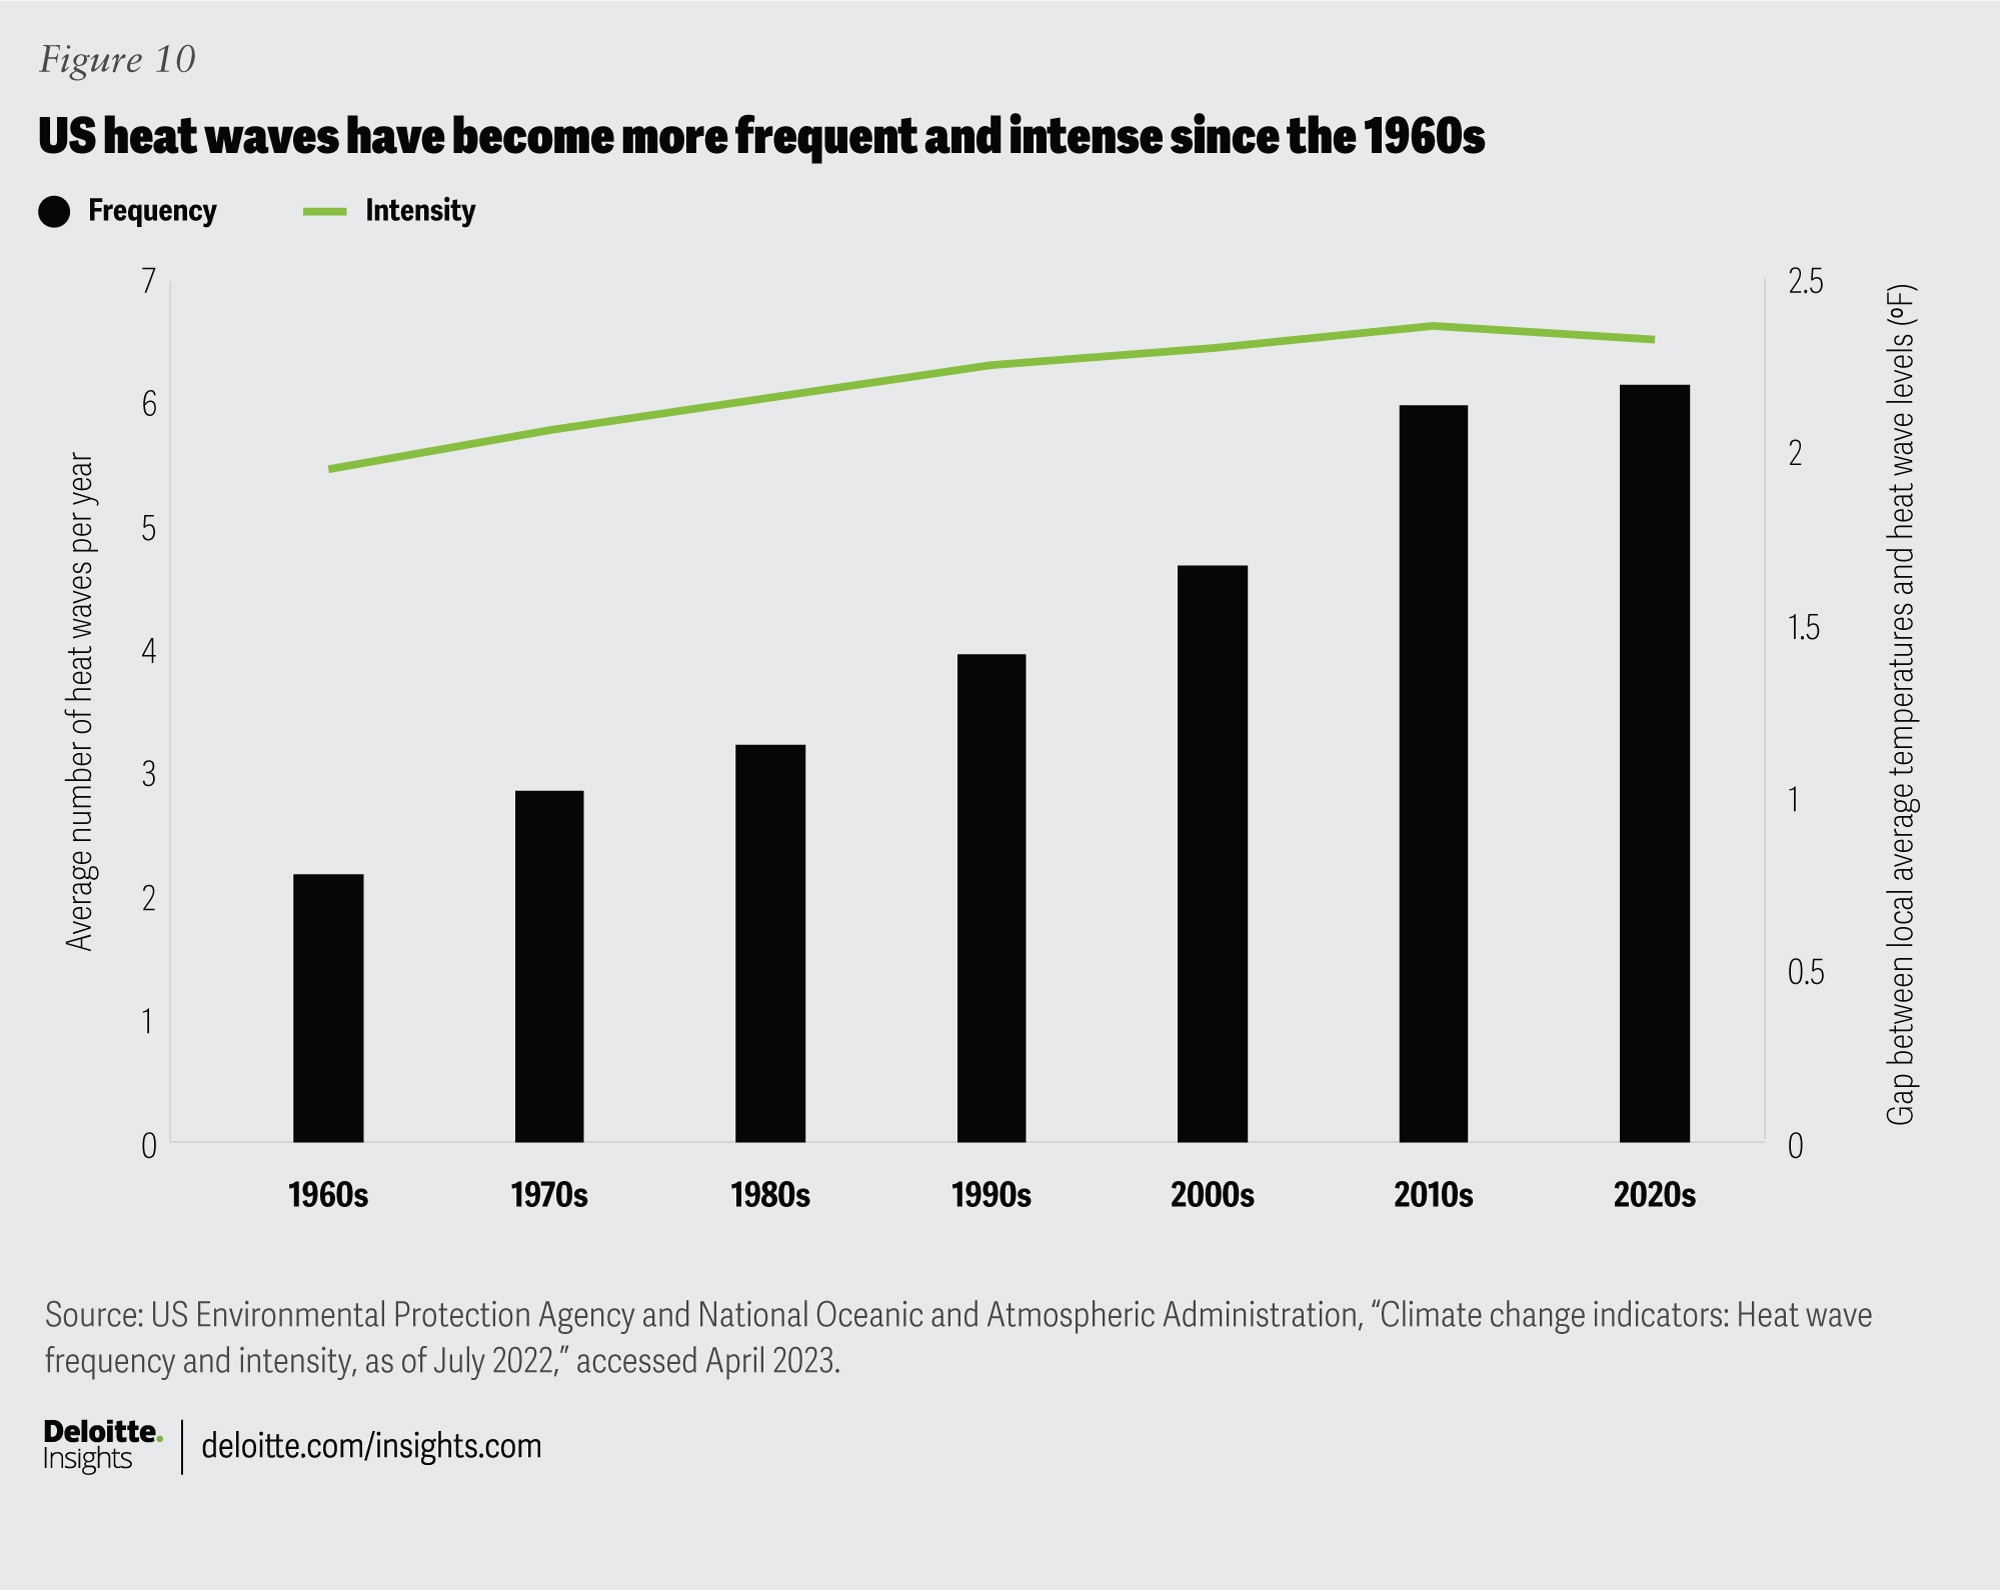
View in ArticleUS EPA, “Climate change indicators: Heat waves,” accessed May 17, 2023.
View in ArticleEarth.org, “Summers in the northern hemisphere could last six months by 2100, wreaking havoc,” March 22, 2021.
View in ArticleAndrew Moore, “Extreme heat is getting worse. Is North Carolina’s power grid ready?,” NC State University News, July 14, 2022.
View in ArticleUS Census Bureau, “Why we ask questions about ... Home heating fuel,” accessed May 17, 2023; John Muyskens, Shannon Osaka, and Naema Ahmed, “US home heating is fractured in surprising ways: Look up your neighborhood,” Washington Post, March 6, 2023.
View in ArticleRandy Altschuler, “Three key strategies to drive American manufacturing reshoring,” Forbes, April 20, 2023.
View in ArticleUS Government, “Public law 117–169 (Inflation Reduction Act of 2022).”
View in ArticleAmerican Clean Power, “Five years’ worth of clean energy investments announced in less than nine months,” accessed May 25, 2023.
View in ArticleTim Mullaney, “How manufacturing chips in the US could make smartphones more expensive,” CNBC, March 9, 2023.
View in Article


