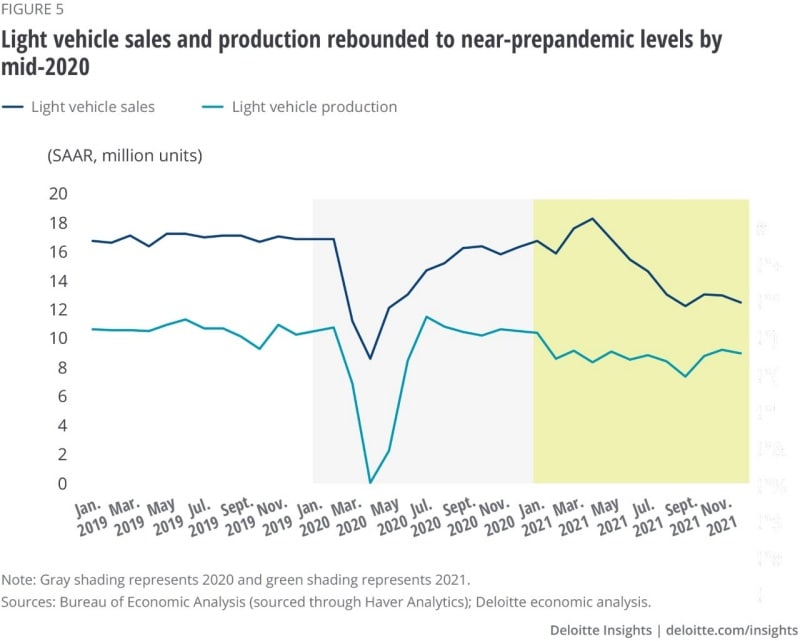
Second, substantial changes in the structure of consumer demand created a swift, but challenging recovery.5 Specifically, a broad shift in consumer demand from services to goods led to a faster-than-expected recovery in the demand for light vehicles in the second half of 2020. Car dealerships suddenly got a lot busier and the waitlist for new vehicles got longer. Light vehicle sales rose to near–prepandemic levels of 16.3 million units (at an annual rate) in September 2020. At the same time, auto producers and parts suppliers found it difficult to increase production due to just-in-time production principles and uncertainty in the availability of key parts.6 A relative shortage of semiconductors—an inexpensive but essential component of autos—exacerbated this production delay.7 With new cars unavailable, consumers turned to used cars and trucks, leading to a dramatic spike in used car prices.8
Despite the disruption in auto manufacturing, light vehicle production exceeded prepandemic levels in July 2020. The gray shaded area in figure 4 shows the V-shaped recovery in 2020—after sharp declines in April 2020, both sales and production rebounded to near–prepandemic levels between July and September 2020.
Supply chain challenges restrained recovery in 2021
While 2020 was incredibly volatile and unprecedented for autos, the demand-production gap saw only a mild recovery in 2021 (green shaded area in figure 5). Consumer demand for autos rose in 2021 and light vehicle sales reached a multiyear high of 18.3 million in April. On the supply side, production was slightly lower than the prepandemic level. Overall production in 2021 lagged sales by 6.1 million, lower than the 6.4 million deficit in 2019. This shows that the major deficit in supply came from imports, rather than from domestic production. Imports of automotive vehicles and parts declined for three straight quarters between Q1 and Q3 2021. Light vehicle sales also declined for five straight months until September 2021, after peaking in April 2021. With fewer cars at dealerships, auto inventories continued to remain under intense pressure. In December 2021, domestic inventories were nearly depleted at 115,000 units—only 20% of the prepandemic level.
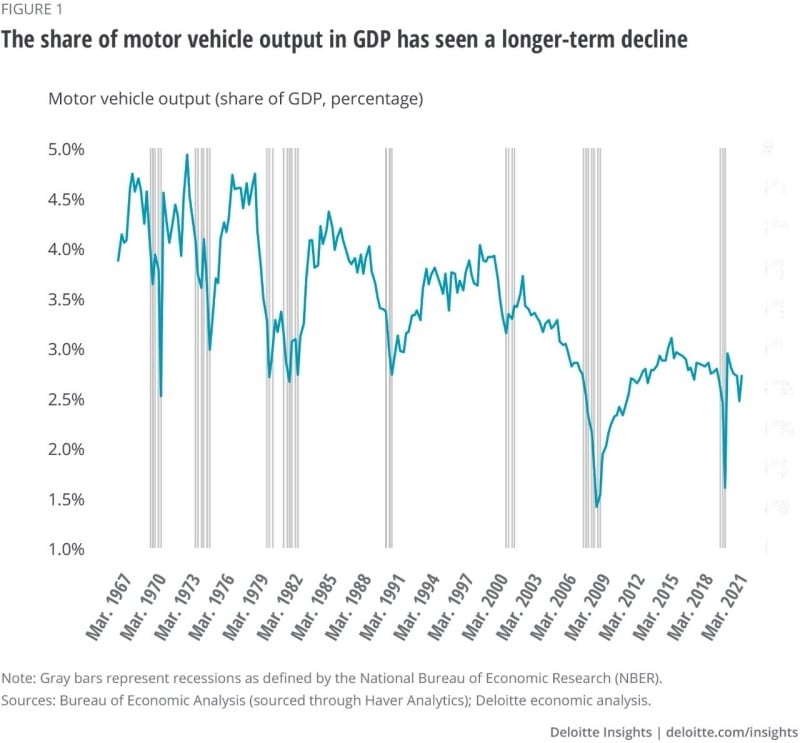
Supply chain pressures impacted the auto industry in distinct ways—production did not decline much, consumption fell more, and imports dipped. Thus, in the National Accounts, motor vehicle output declined less than spending on motor vehicles. The decline in real motor vehicle output in 2020 accounted for 0.4% of 2020 GDP. To put the potential impact on GDP in context, had the pandemic not occurred, and motor vehicle output not fallen, real GDP would have been 0.6 percentage points higher in 2021.
Meanwhile, the decline in light vehicle sales in 2020 accounted for 0.6% of total consumer spending in 2020. The potential implication of lower vehicle sales on consumer spending was higher—Had light vehicle sales clocked in at the 2019 annual rate of 17 million units in 2020 and 2021, consumer spending would have been US$150 billion higher, equivalent to 1% of consumer spending in 2021.
A few dents in near-term recovery
It’s still too early for automakers to shake off pandemic blues as vehicle sales and production continue to be constrained by low inventory and supply chain disruptions. According to forecasts by IHS Markit, light vehicle sales are expected to reach 15.5 million units in 2022, slightly higher than the 2021 level of 15.1 million units.9 Two factors are key to the industry’s near-term recovery.
First, the auto sector may continue to benefit from the shift in consumer spending patterns. Factors that contributed to the initial rebound in auto demand in 2020, such as the preference for personal vehicles as a safe mode of transportation, may boost demand.10 Lower borrowing rates provided additional incentives, but the winding down of economic support by the Federal Reserve and the expected rise in borrowing rates might hold demand back, although “pandemic savings” will lend some support to the existing pent-up demand.11
Second, while there are no quick fixes to supply chain disruptions, early indications suggest that supply chain problems are starting to abate. The Global Supply Chain Pressure Index, developed by the New York Federal Reserve, suggests that elevated global supply chain pressures may have peaked and might start to moderate going forward.12 Another gauge called the Ocean Timeliness indicator, which measures the timeline of a shipment starting from the exporter’s warehouse to its destination port, reported that shipping times from Asia to the Transpacific, while historically high, dipped by one day to 113 days.13 Other related indicators such as Taiwan’s surge in semiconductor exports (Taiwanese firms account for 92% of leading-edge semiconductor production) and a sizeable decline in the Baltic Dry Index in January 2022 also point to an improvement in the supply chain.14 Supply chain pressures may appear difficult, but it is precisely these types of problems that US manufacturers excel at solving.


