
Deciphering the performance puzzle in shales Moving the US shale revolution forward
12 minute read
23 October 2019
 Scott Sanderson United States
 Andrew Slaughter United States
 Anshu Mittal India
 Vivek Bansal United States
In a few short years, shales have changed the narrative of the US energy landscape. But to achieve its true potential, shale operators need to rethink traditionally defined success factors.
Executive summary
In mid-2019, US crude oil and natural gas production reached a record high of 12 million barrels per day (MMbbl/d) and 90 billion cubic feet per day (Bcf/d), respectively, mainly due to the high growth of unconventional tight oil and shale gas in recent years.1 In fact, the shale-rich state of Texas is now producing 5 MMbbl/d of oil—more than any OPEC member, barring Saudi Arabia.2 But, while volumetric growth rates are well known, more specific factors driving this success are far less understood by most stakeholders.
Learn more
Explore the collection
Read more in Oil, Gas & Chemicals
Explore the stats on well design for growth opportunities
Download the Deloitte Insights and Dow Jones app
Subscribe to receive more content from Deloitte Insights
Isolating shale’s success factors or continually improving productivity in shales isn’t easy, and that’s probably why many shale operators face regular questions on productivity, efficiency, and returns. In the series, Moving the US shale revolution forward, we undertake an integrated statistical analysis of geological, engineering, and productivity data from over 80,000 horizontal shale wells to bring more clarity in understanding this relatively young resource, its performance, and potential.
Although not a substitute for well- or play-specific reservoir and petrophysical interpretations, our work highlights success factors, ongoing challenges, and improvement opportunities for shale operators.
Our four-part article series, Moving the US shale revolution forward, aims to study the learning curves, unearth success factors, and identify operational well-enhancement opportunities for US shale operators. The analysis is based on Deloitte’s statistical interpretation of reported well-level geological, engineering, and productivity data.
The analysis focuses on aggregate performance indicators across the plays. It is intended to complement, not replace, companies’ sophisticated geological and field planning models of their own operations. The opportunities highlighted in these articles are at a well level, as against at the overall field/portfolio level. Given the heterogeneity of shale geology, operators could use this analysis to identify specific factors to explore in their own proprietary drilling, completion, and operations data.
Key highlights
- Unique engineering designs, intense completions, and higher above-surface efficiency gains are augmenting yields from formations of varying quality targeted by US shale operators.
- Permian and Appalachian basins have benefitted from higher-quality formations, while mature engineering designs and completion effectiveness drove gains in Gulf Coast and Bakken.
- The previously assumed linear relationship between completion intensity and well productivity has peaked over the past 2–3 years, giving rise to concerns from investors and financial markets.
- Although every company is in an experimentation phase with this relatively young resource play, large pure-play independents seem to be slightly ahead of most integrated oil companies in balancing completion intensity and productivity.
- Knowing that companies highlight the performance and productivity of their best wells, our analysis reveals there is considerable upside for higher growth potential by applying learnings and best practices more broadly across portfolios of wells.
This is the first article of the, Moving the US shale revolution forward research series, on US shales, which statistically decodes the evolution and progress of the shale boom by analyzing more than 80,000 horizontal shale wells spread across the United States. The following papers deep dive into two of the primary basins (the Permian and Eagle Ford) and discuss the role of all stakeholders (including oilfield services and midstream companies) in extending the US shale boom.
The US oil and gas renaissance
For much of the first decade of this century, US energy agencies and policymakers foresaw continuing declines in US oil and gas production, even when taking account of continued investments in deepwater plays in the Gulf of Mexico. However, the advent and commercialization of hydraulic fracturing and horizontal drilling beginning in the Barnett Shale paved the way for rapid expansion in unconventionals starting 2005.3 Optimism gained momentum when the US Energy Information Administration (EIA) estimated US shale gas and tight oil reserves at 750 trillion cubic feet (Tcf) and 24 billion barrels, respectively, in 2011, and the confidence soared every time the agency revised its estimates upward. Latest estimates peg reserves at 1,280 Tcf of shale gas and 112 billion barrels of tight oil.4
Fast forward a couple of years, shales have outstripped most previous expectations and seem to have altered the entire oil and gas landscape, with the United States now projected to be energy-independent by 2020.5 By mid-2019, US tight oil production reached 8.5 million barrels per day (MMbbl/d), or almost 10 percent of world production.6 The economic impact of this growth has been considerable, as US shales have contributed close to US$1.5 trillion since 2006, close to three times Nigeria’s GDP in 2018, for example (see figure 1).7

Understanding shale’s growth drivers
Shales are organic mudstones consisting of silt and clay that have a complex and heterogenous mineralogic accumulation/thickness (formation), require custom engineering designs and completion stimulations (E&C), and are strongly guided by many above-surface planning and efficiency measures (P&E). Given the intricacy and interdependency among variables, a statistical analysis of all three components (formation, E&C, and P&E), and multiple metrics within each, is necessary to understand its success in the United States (refer to the appendix).
Certainly, every operator wants to have majority of its acreage and wells in high-quality formations and many have been successful, when measured in absolute terms. But over-crowding and high valuation of acreage in these sweet spots have limited the upside from these areas.8 The result: An operator’s portfolio ends up comprising many wells in lower-quality formations, reflected in a flat-to-lower formation quality index for all wells spud in the United States since 2009 (see figure 2). Dissecting formation quality, about 85 percent of wells spudded since 2017 have had a low gamma ray reading, which measures natural radioactivity of a formation.9 Similarly, petrophysical properties such as deep resistivity logs have been far less encouraging for recently drilled wells.
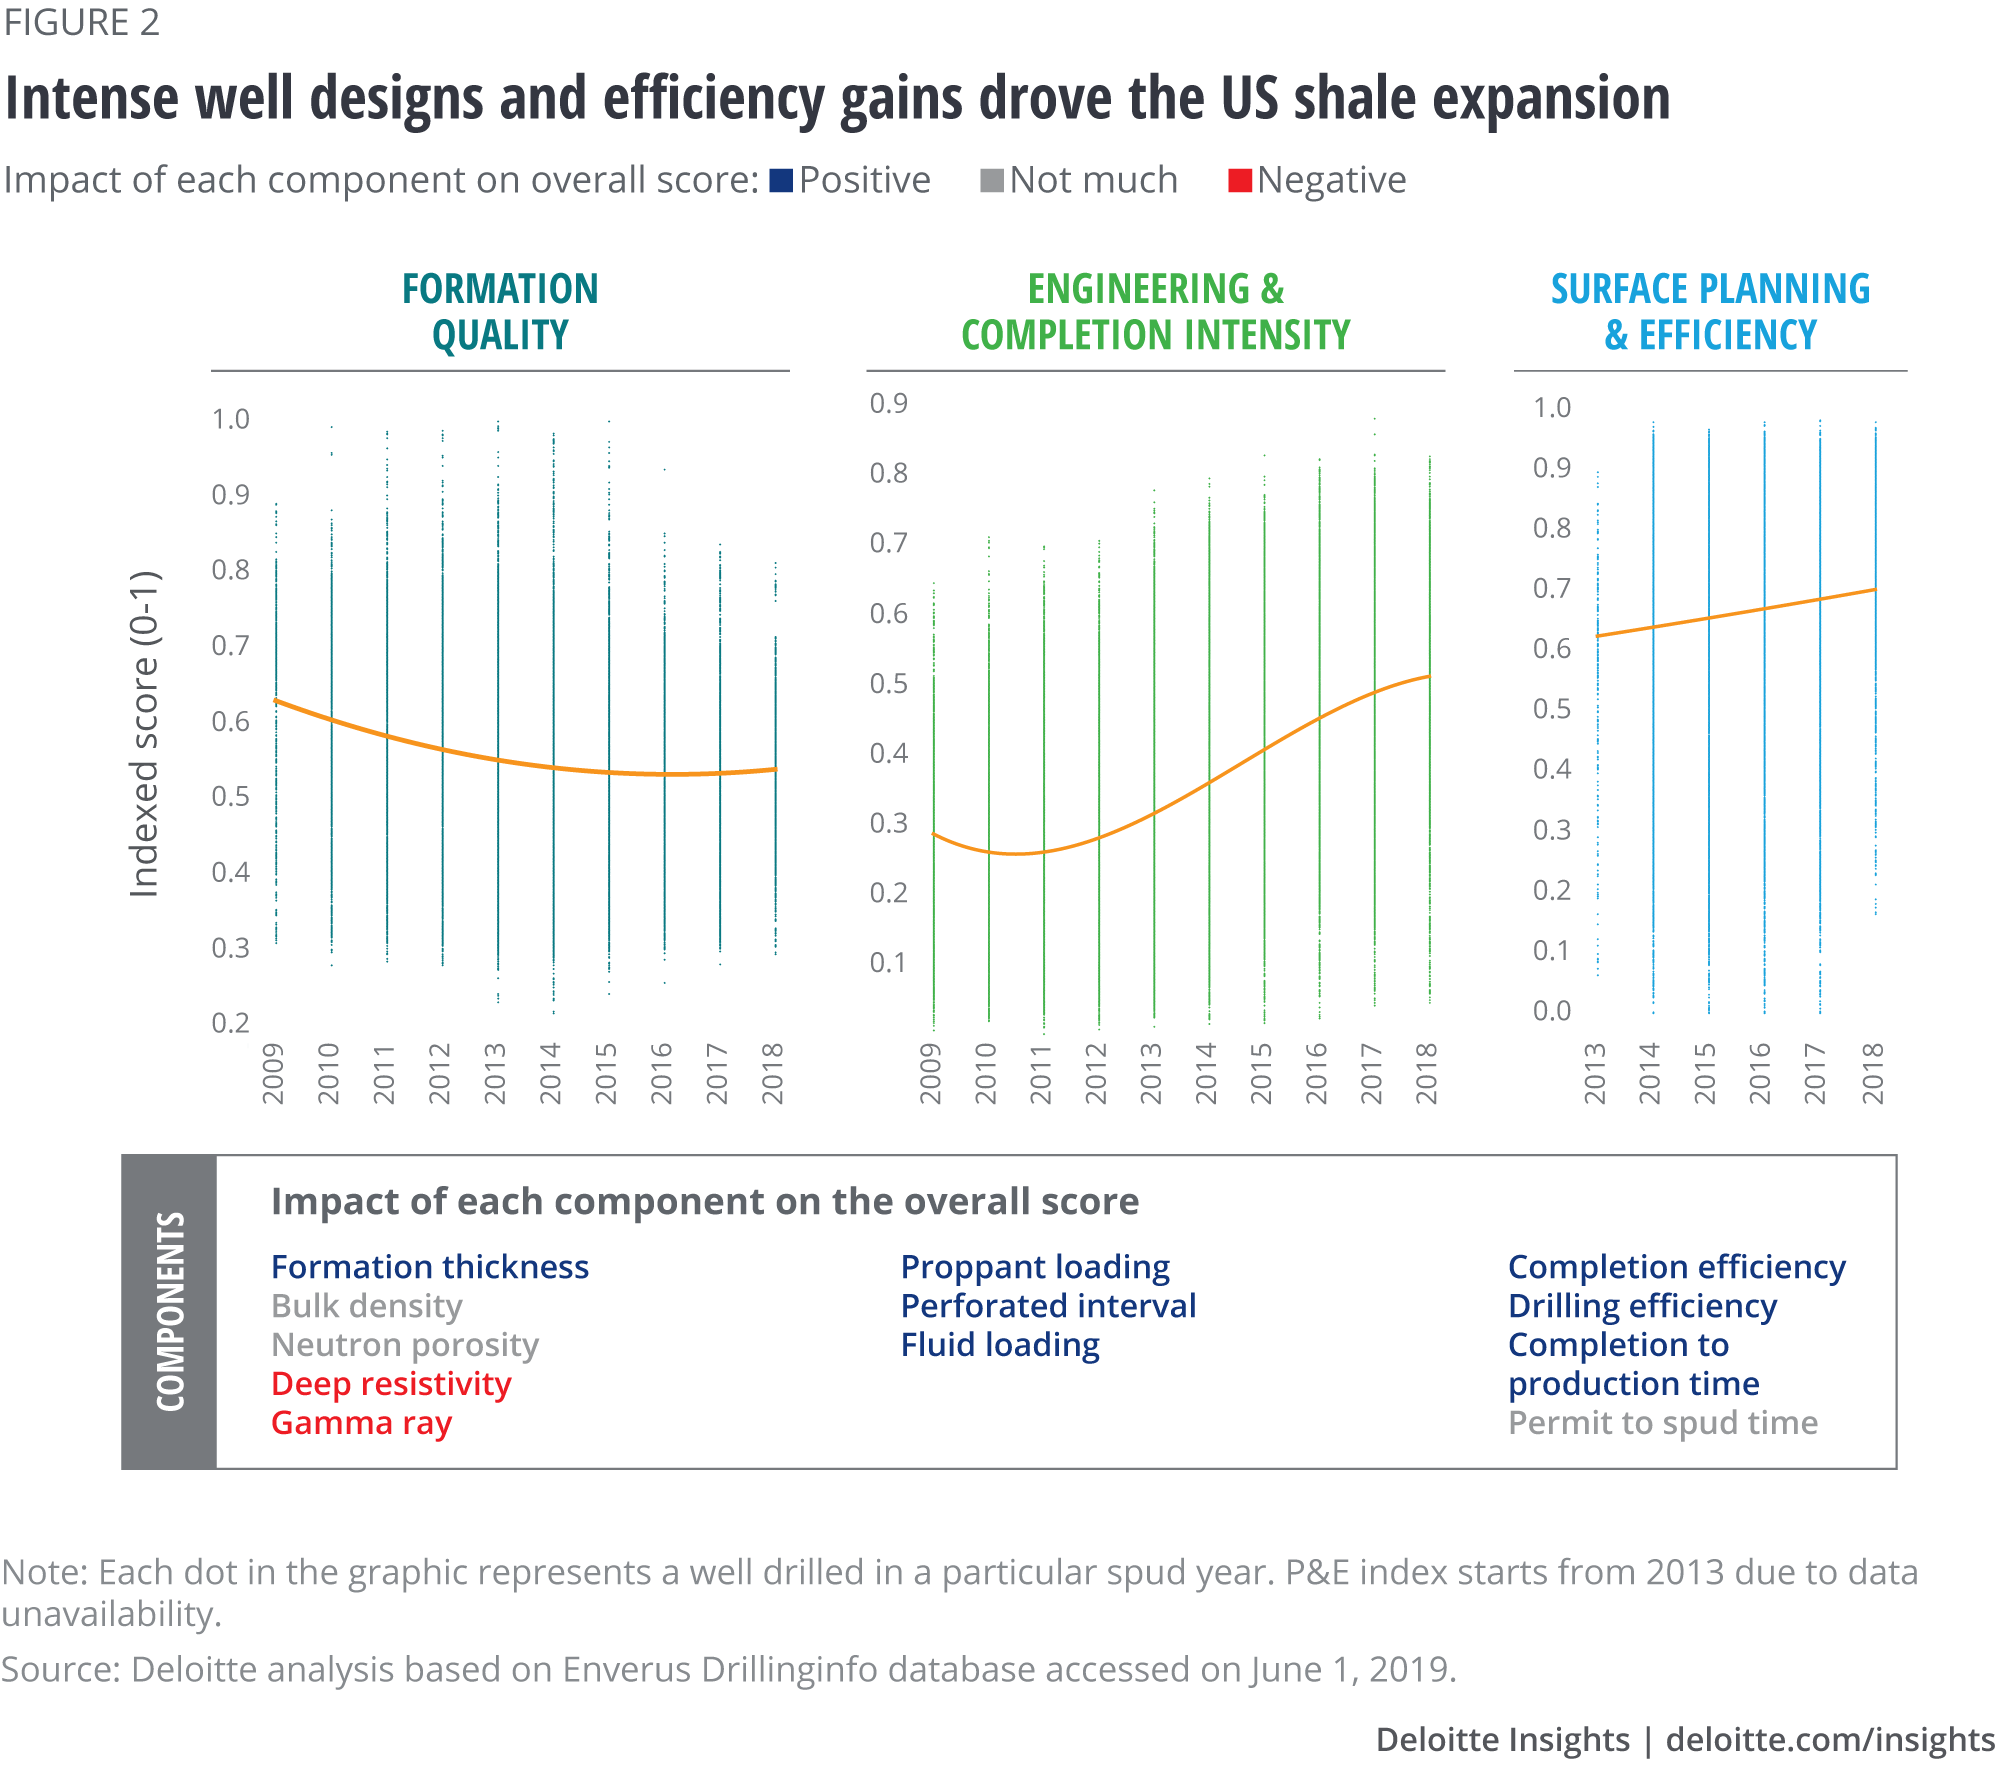
On the other hand, unique engineering designs and intense completions, which have been the hallmark of the shale boom, have compensated for lower-quality formations available or targeted by operators. Over the past 10 years, the industry’s completion intensity has increased by 65 percent due to the increased quantities of proppant and fluids and longer perforated interval (refer to the E&C index in figure 2).10 Whether we call them “high-intensity completions” or “generation x frac,” these have helped operators to produce more from the same formation and sustain their production even in a period of downturn.
Although above-surface P&E doesn’t impact operators’ productivity directly, time and cost savings and better management of produced resources lower their breakeven. Operators, with the help of service companies, have made huge strides in reducing their days per foot or lowering the shale cycle time by an average of 100 days. The P&E index, as a result, has improved by 12 percent over the past 5 years, in a lower commodity price environment when there was significant pressure to maintain production growth without increasing capital intensity.11 And this efficiency hasn’t been limited to a select few; in fact, most operators have gained over the years.
While these three factors have played a role in driving US shale growth, the combination and balance of factors that have made this growth possible remains subject to vigorous debate. The debate is, however, reasonable considering that the development of shales is relatively immature, shale operators are learning by experimenting, and hydrocarbon recovery differs by each basin and even within a basin.
Different basins, different stories
Every shale play is different. For instance, among the oil-heavy basins, the Permian’s formation quality seems to be the finest. Not only does the basin have one of the thickest formations (crossing 800 feet) and many productive layers (nearly a dozen), it also has one of the highest net hydrocarbon potential, reflected in its high resistivity log measurements.12 Similarly, the gas-heavy Appalachian basin has a strong natural gas crossover of bulk density and neutron porosity logs and the highest gamma ray readings (above 135 API), both of which are indicative of abundant total organic carbon (the right-skewed Appalachian formation in figure 3).13 The large potential of these basins, most probably, explain their high attractiveness and thus the shift of industry’s drilling activity toward these basins in recent years.
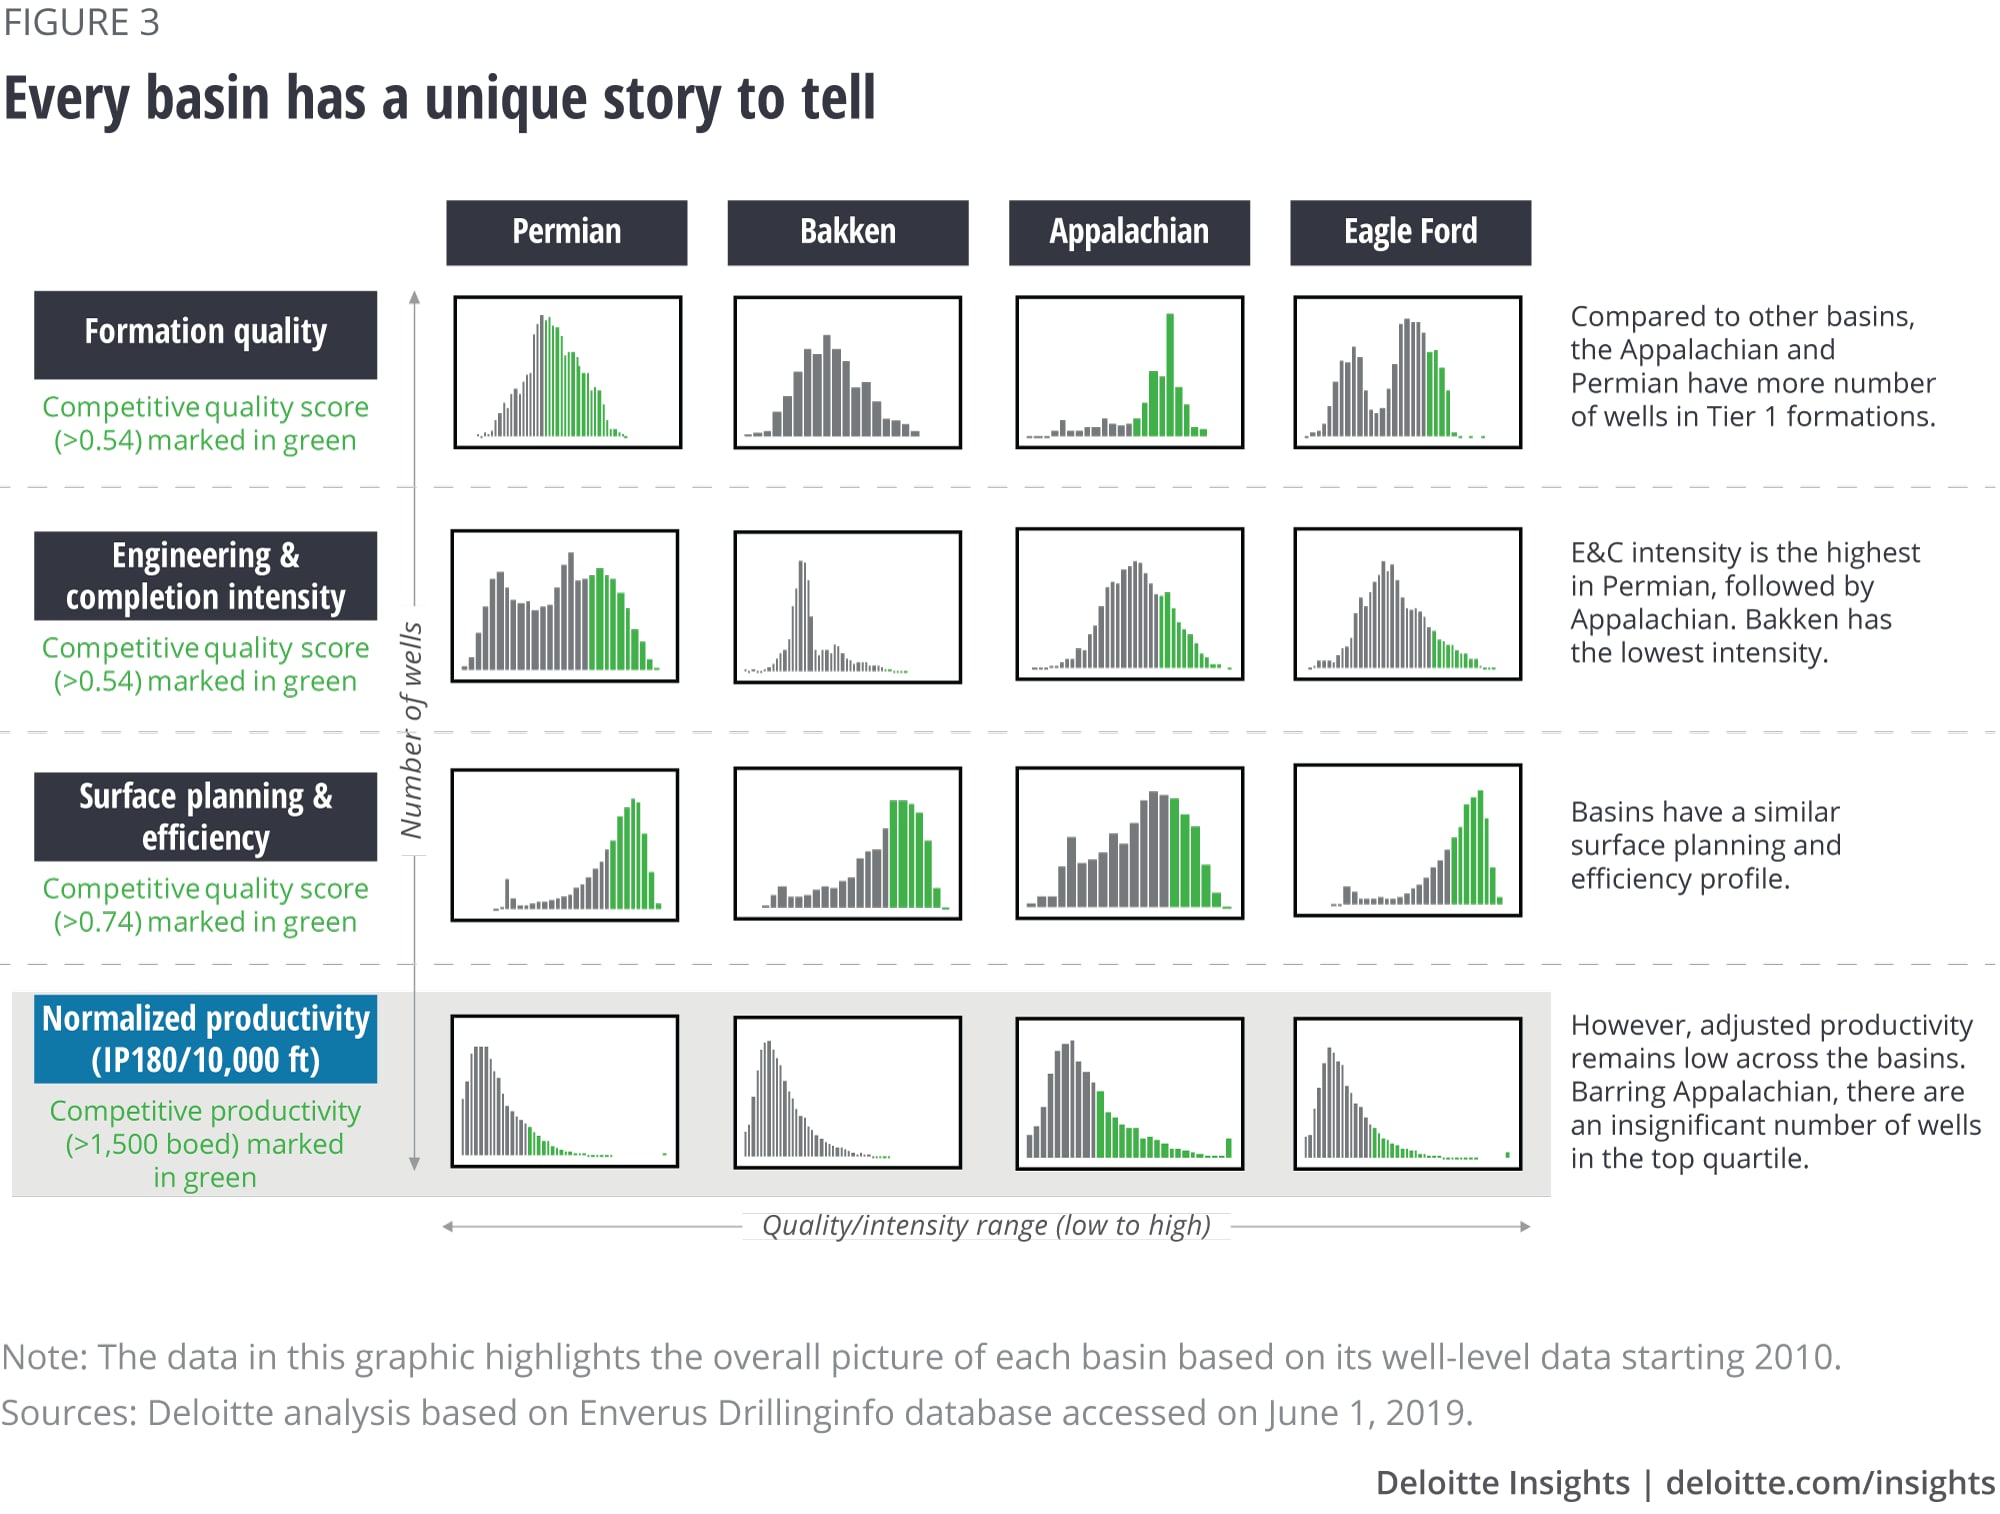
Like formations, engineering designs and completion intensity vary significantly by basins. Operators have been experimenting with completion design changes by varying quantities of proppants, fluids, and lateral length, especially in the Permian basin. The basin, despite its high formation quality, has among the least established E&C maturity (evident in the wider shape of its E&C distribution curve in figure 3). Proppant quantity, for example, ranges from few hundred to 2,500 lbs/feet in the basin. The E&C curve of the Eagle Ford basin (on the Gulf Coast), on the contrary, is normally distributed. Operators in the basin have a maximum number of wells where proppant quantity averages about 1,800 lbs/feet.14
Irrespective of the curves, operators have generally been raising the proppant and fluid intensities of their completions. And it has commonly been argued that there is a relationship between completion intensity and well productivity. Certainly, in the initial days of the shale boom, high completion intensity has influenced well productivity.15 But has it stayed linear since then? We looked at detailed well data to understand this relationship and decipher which specific completion factors tend to influence productivity the most.
Inversing relationship between completion intensity and higher productivity
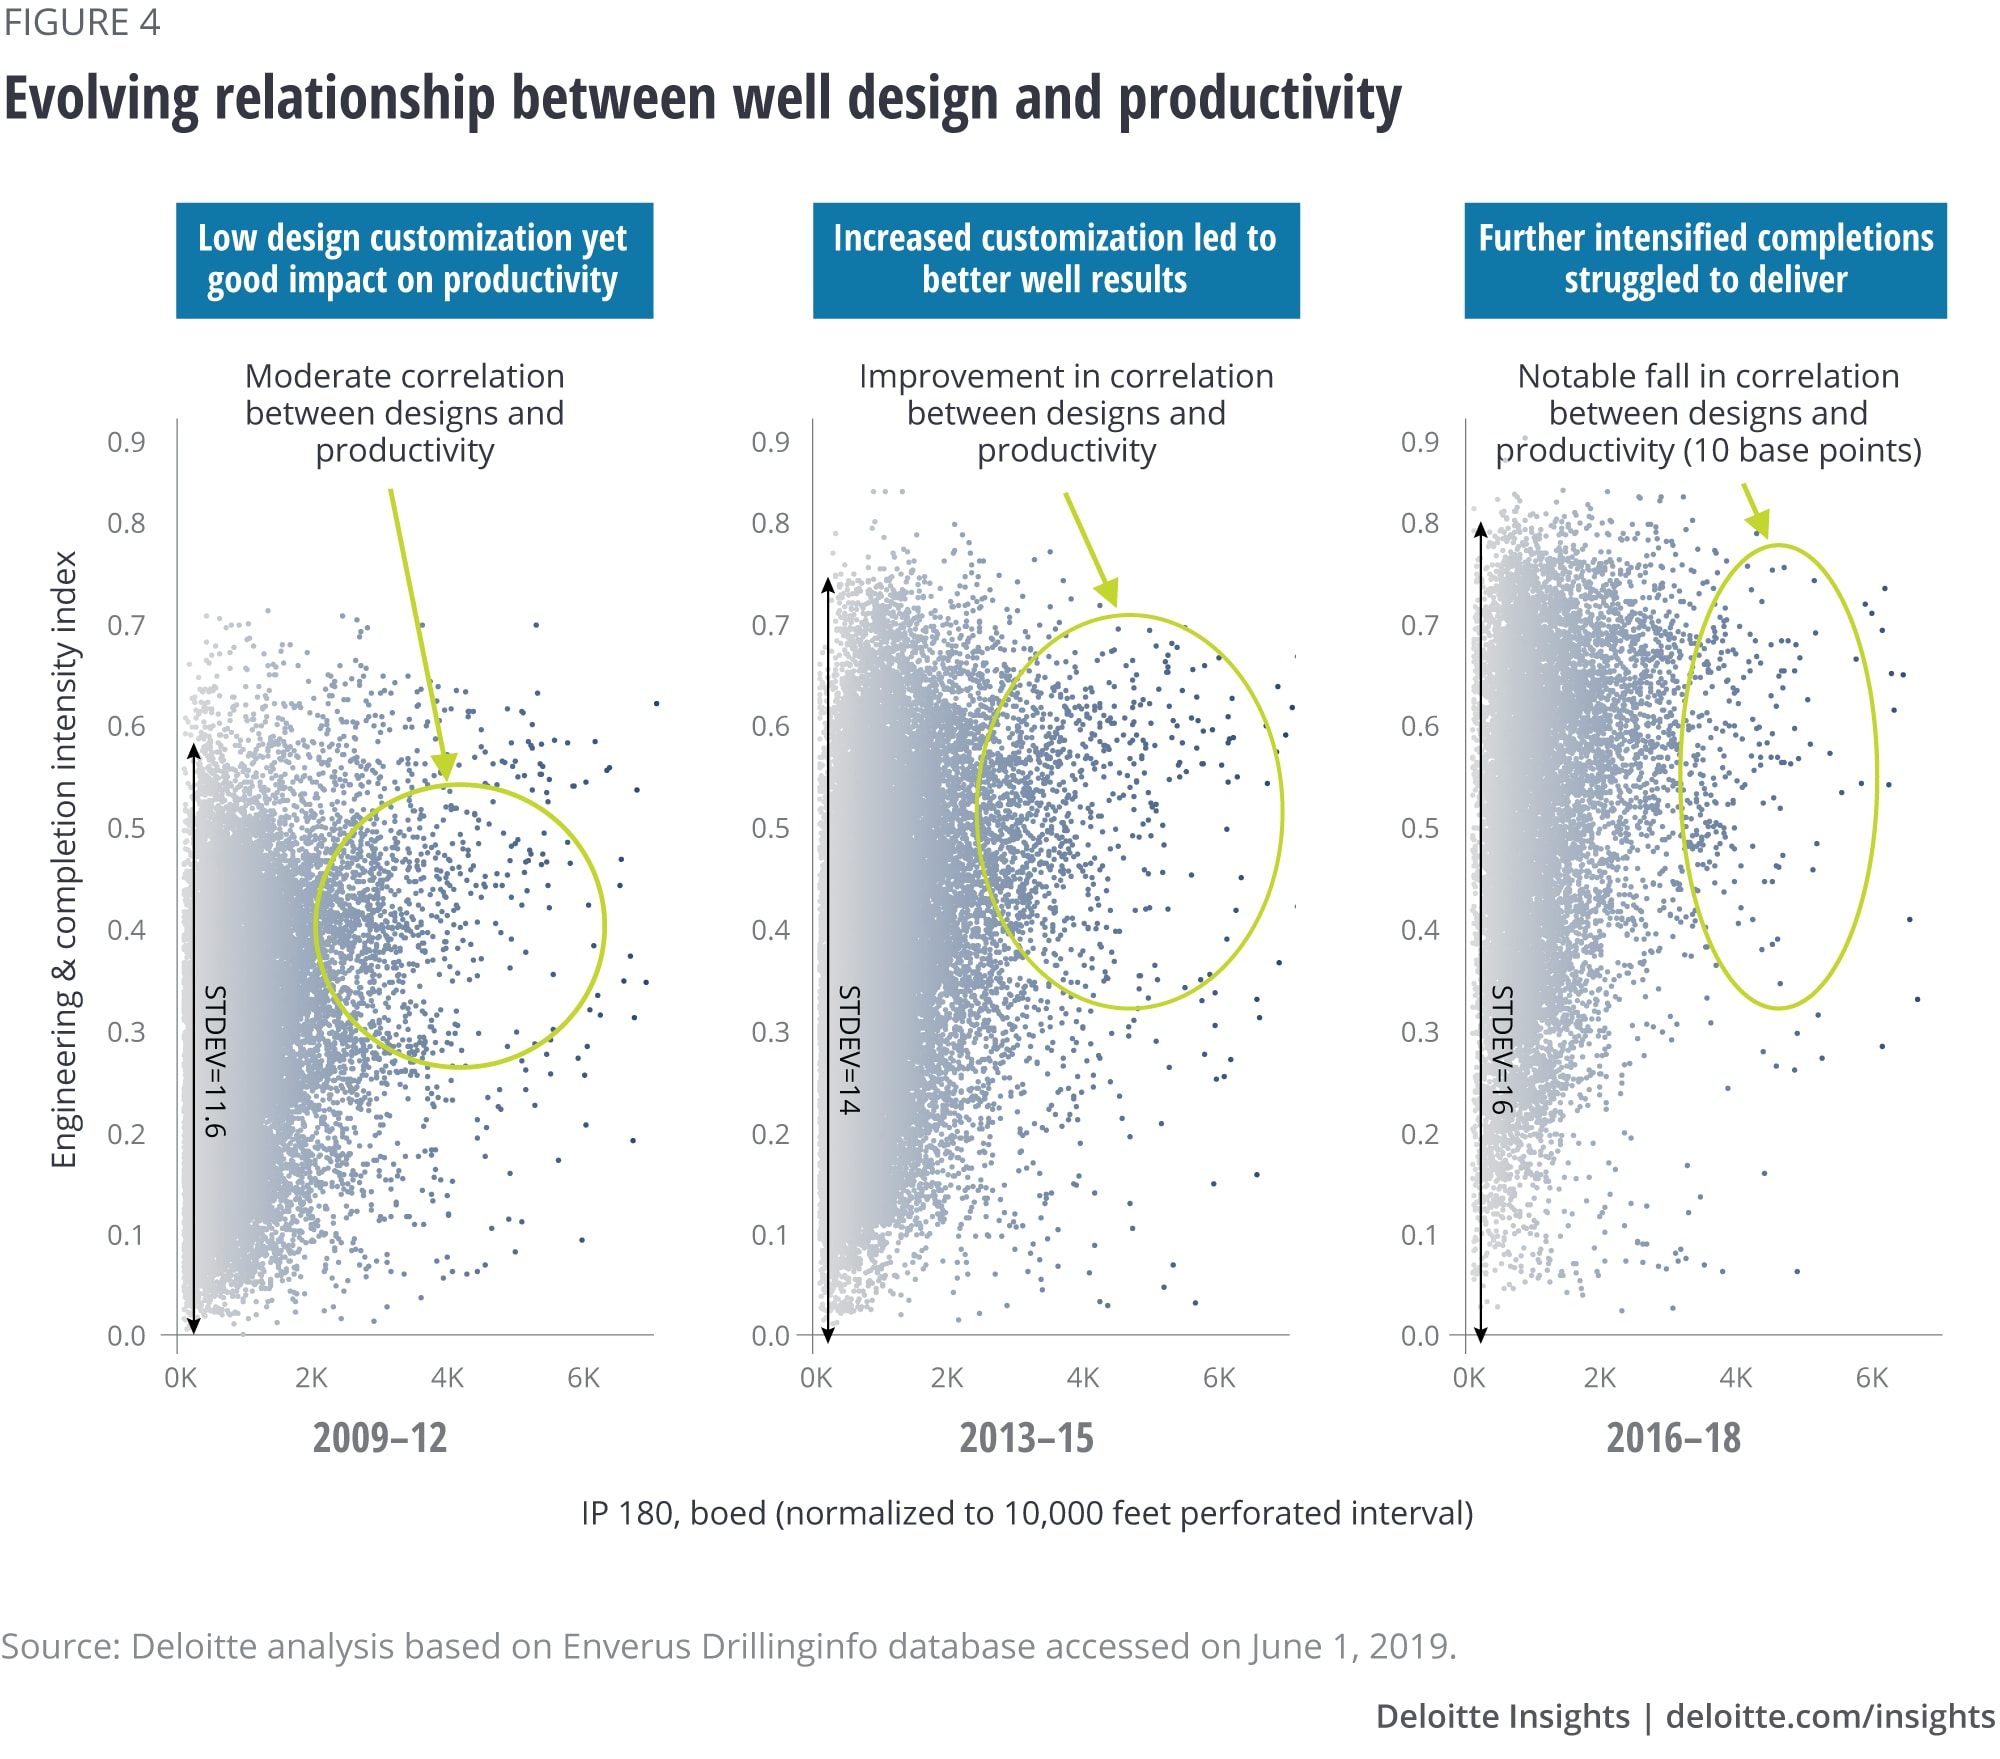
The relationship between higher completion intensity and additional productivity is generally portrayed as linear—which at least played out as asserted in earlier years of shale development (2013–2015; figure 4). During this period, about 23 percent of wells had both high productivity and high completion intensity as against 4 percent during 2009–2012.16 And probably that’s why most operators highlight their record loading of proppants or fluids while presenting quarterly results.
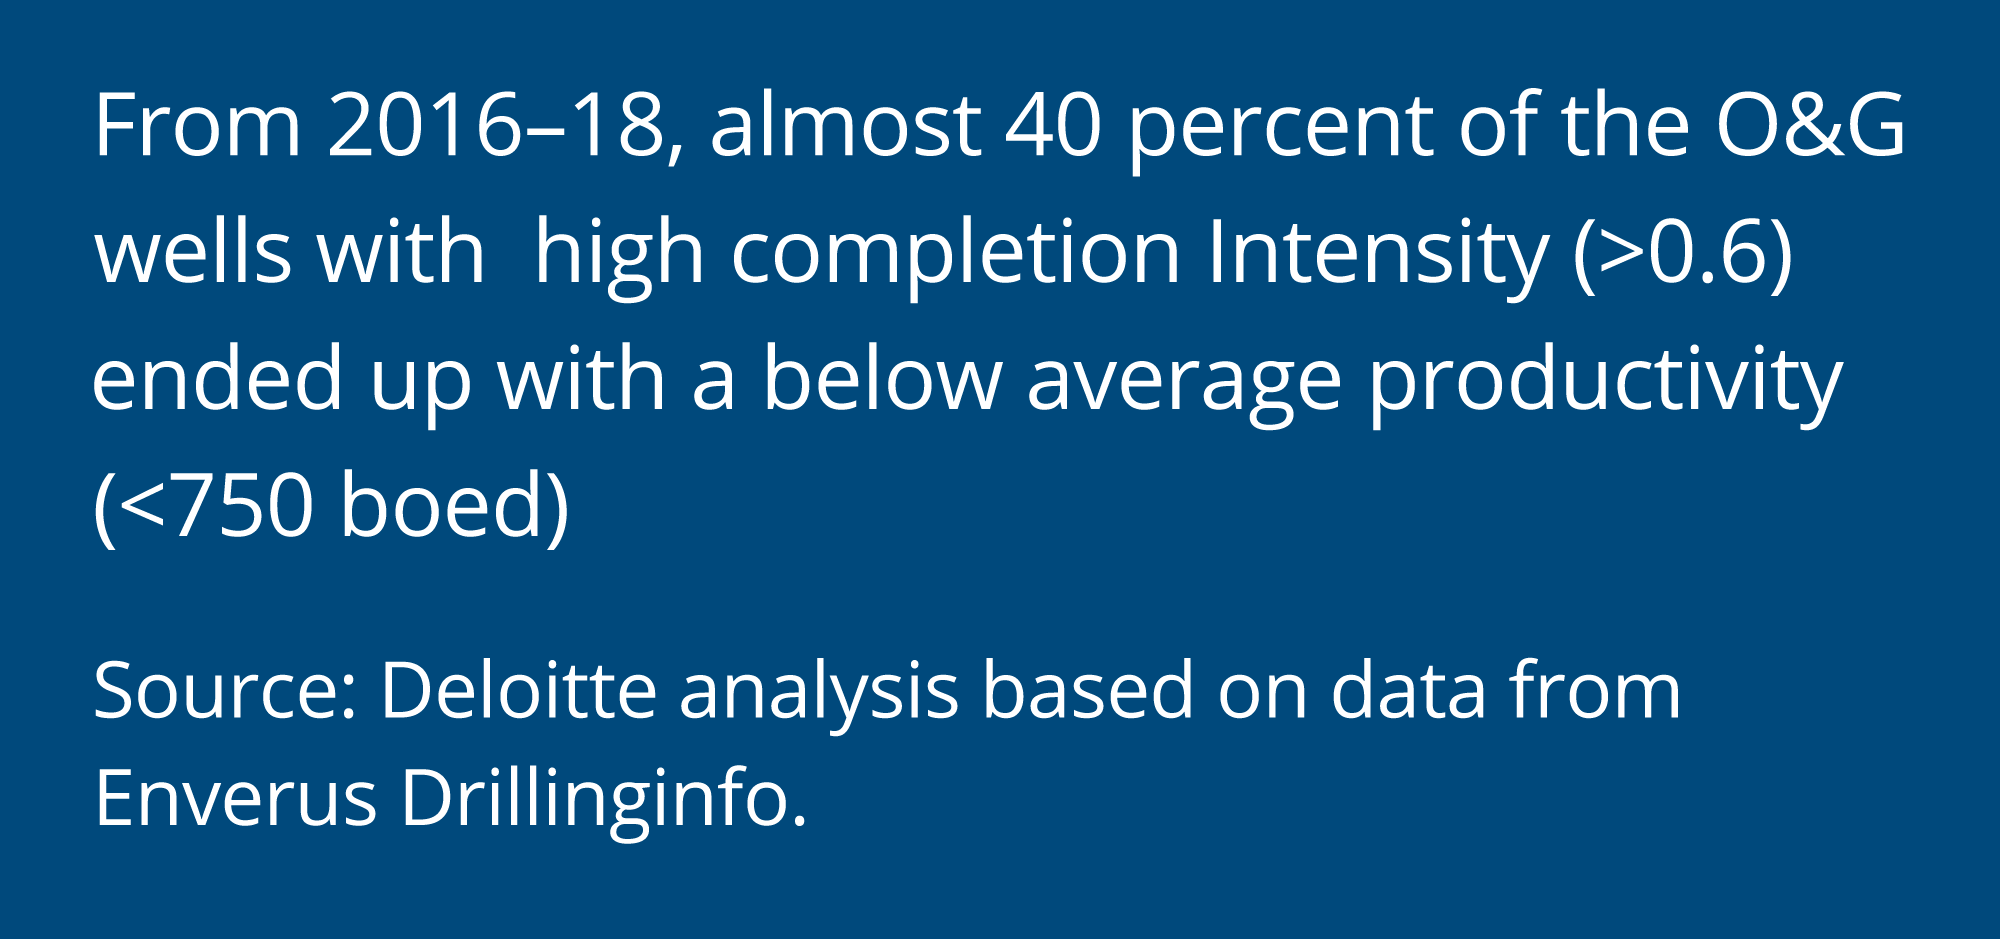
However, that relationship has peaked and started weakening since 2015. In fact, over the past 3 years (2016–2018), the industry’s productivity was flat despite a 25 percent increase in proppant and fluid loading.17 In other words, although operators have experimented with higher intensity designs and stimulations, those led to diminishing or negative results (apparent in the higher standard deviation of the E&C score and wider vertical spread of productivity in figure 4). During this period, for example, there were more than 3,000 wells (or 23 percent of the sample set during the period) where proppant quantity was in excess of 1,800 lbs/feet but productivity was below 750 boed per 10,000 feet perforated interval.18
The result: lower relative productivity and higher cost of completion—not the desired outcome for any operator. This probably explains why many operators underperformed, in terms of their market valuations, even in this period of oil price recovery, and why investors showed far less appreciation for shale companies (for more details on upstream companies in the downturn, read Exploration & production: Overcoming barriers to success). Which operator group has attained the best balance of intensity and productivity? What has been their learning trajectory?
The learning curve and opportunity
In earlier phases of shale resource development, up to 2014, integrated oil companies had the slowest learning curve and they displayed a significant share of inferior well results due to their late entry into shales. In fact, in this phase, their experimentation with completions didn’t work out as expected, reflected in their falling productivity per well (refer to the blue line in figure 5).
On the other hand, pure-play independents, which also kick-started the shale boom, seemed to have got the most out of their high-intensity completions, especially those in gas-heavy plays, such as Appalachian. Companies such as Cabot O&G were pumping more than 1,500lbs/feet of proppants with average IP-180 productivity of 1,800 boed per 10,000 feet perforated interval as early as 2010.19
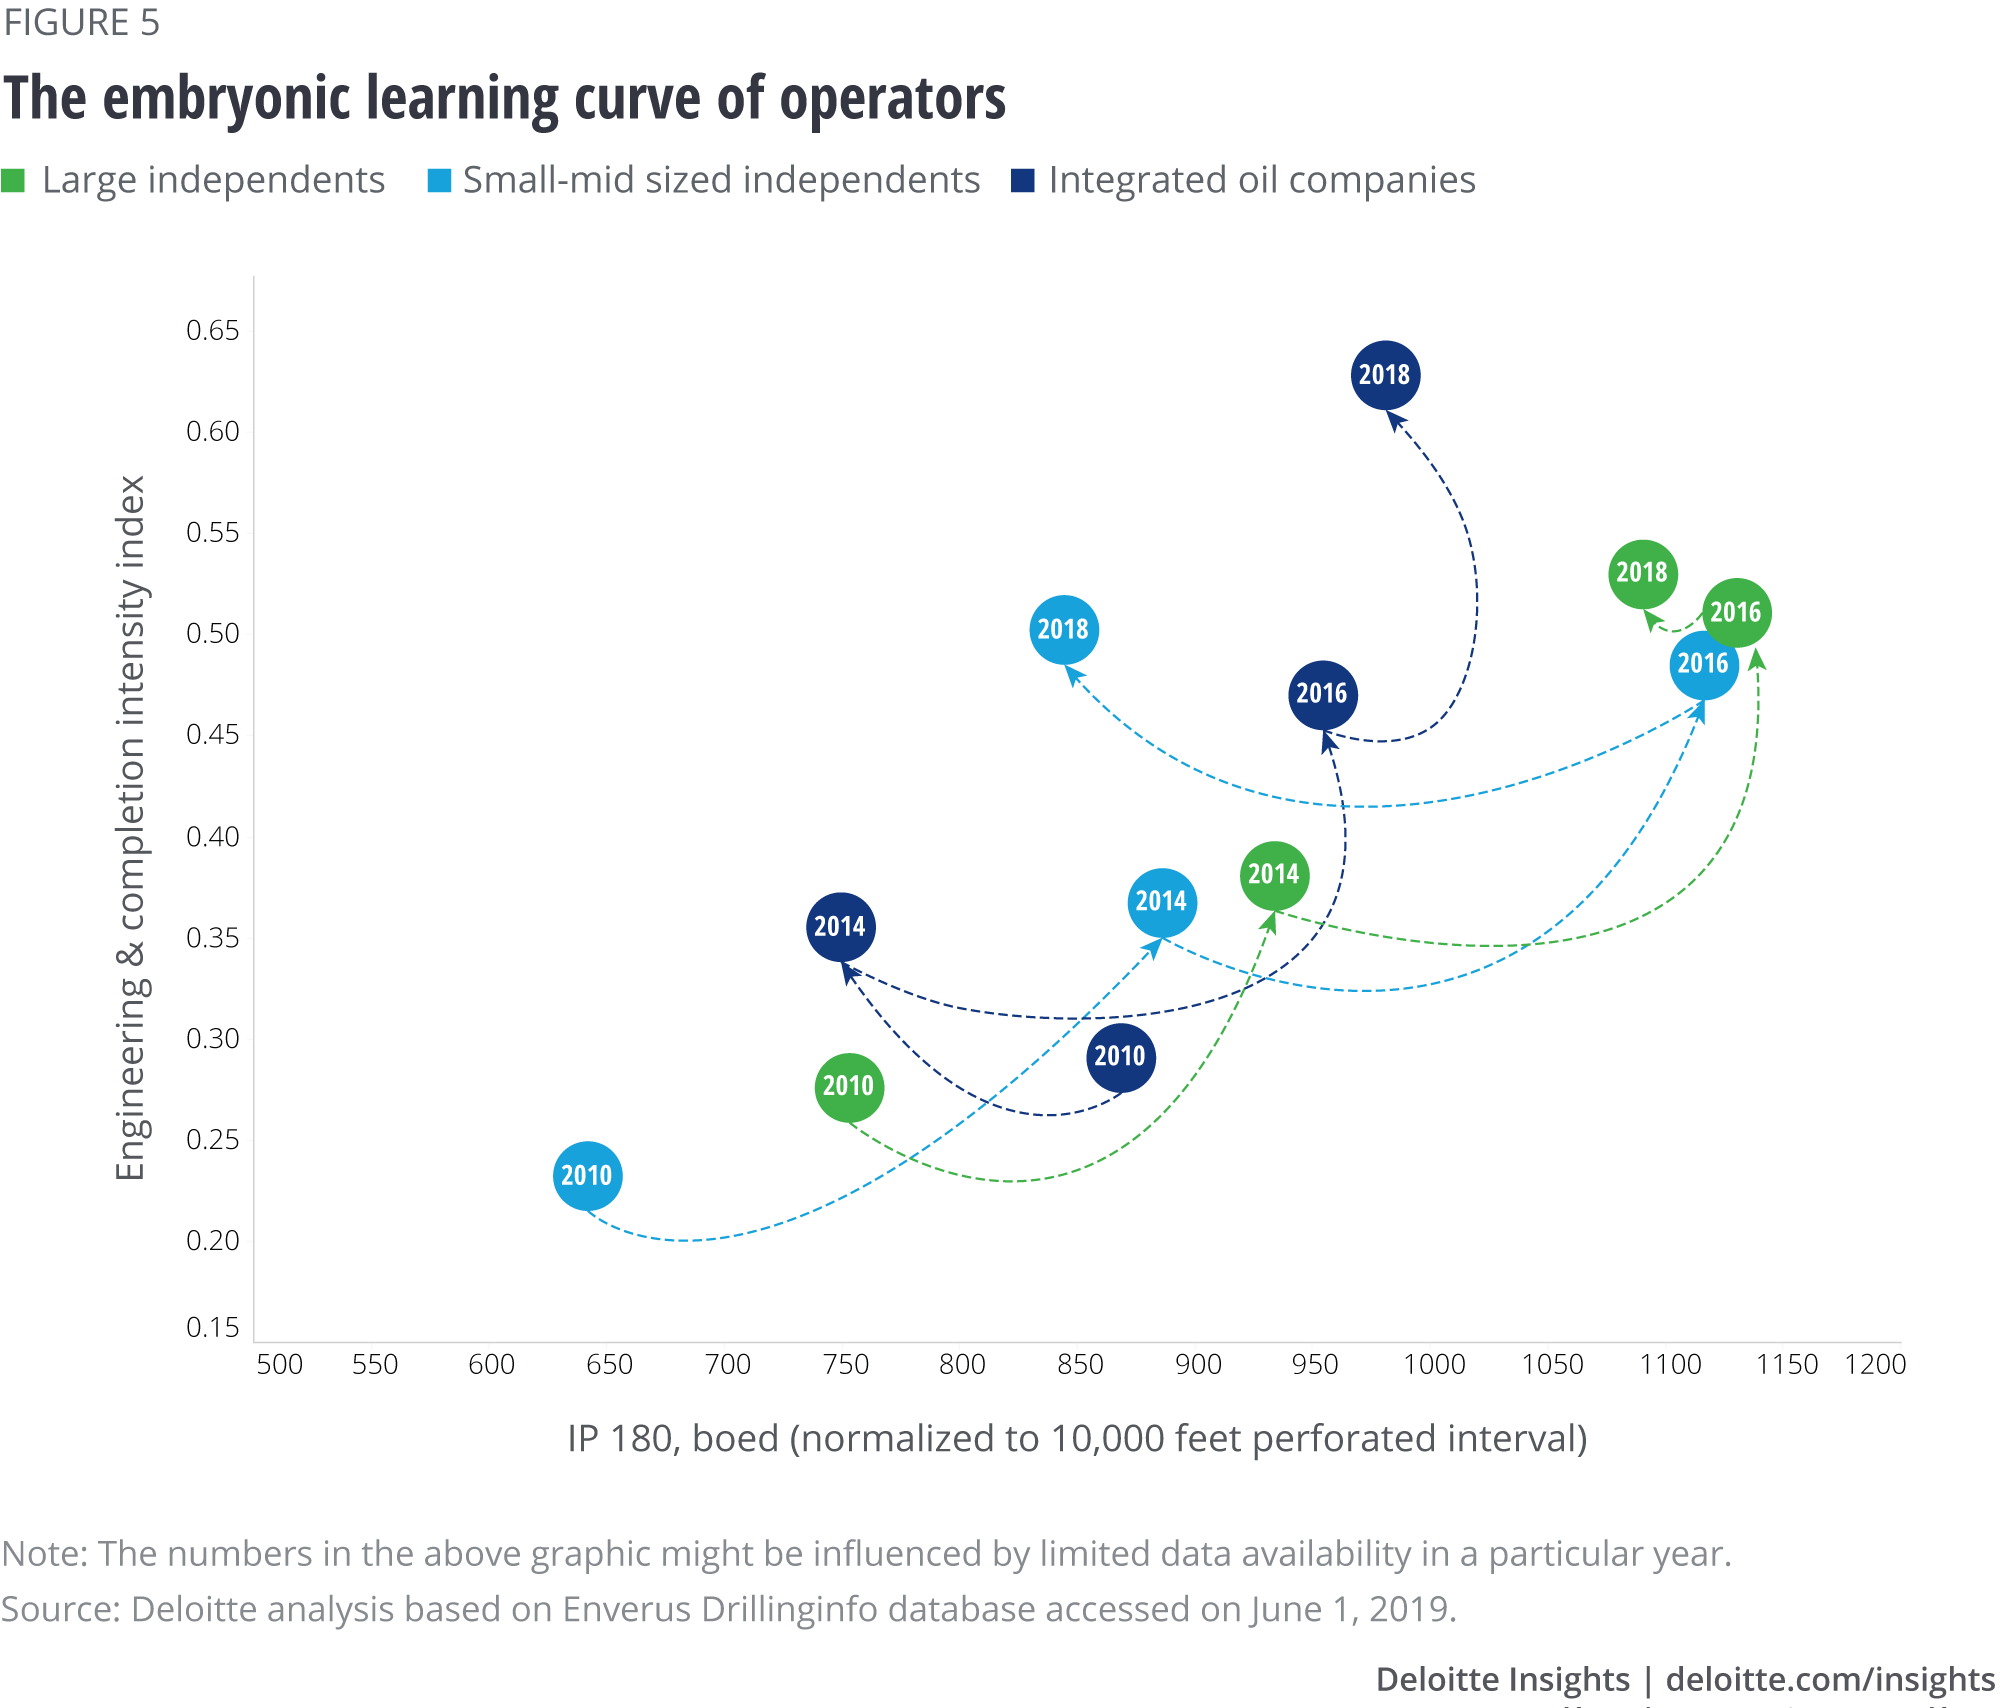
Inferior well results and the start of the oil price downturn, from mid-2014, forced many integrated oil companies to either shift from production at any cost to productivity with right intensity, or scale back their activity in shales. Both happened, but those who got their learning curve right made a strong comeback by 2016. One of the leading integrated oil company, for example, increased its productivity by 20 percent with the same completion intensity level during this period. Pure-play independents, on the other hand, extended their learning curve and protected the linear relationship between intensity and productivity of their wells.
The story, as well as the results, however, changes after 2016. Integrated oil companies registered only a marginal increase in their average well productivity, despite record-high completions in 2018. On the other hand, the relationship reversed for pure-play independents, especially for small- and mid-sized ones. What is leading to this inversing of the relationship, for independents now and probably for integrated oil companies later? Although each company has its own reason and not every well is equal, incomplete understanding of the consequences of higher infill drilling and suboptimal completions are among the most probable reasons.
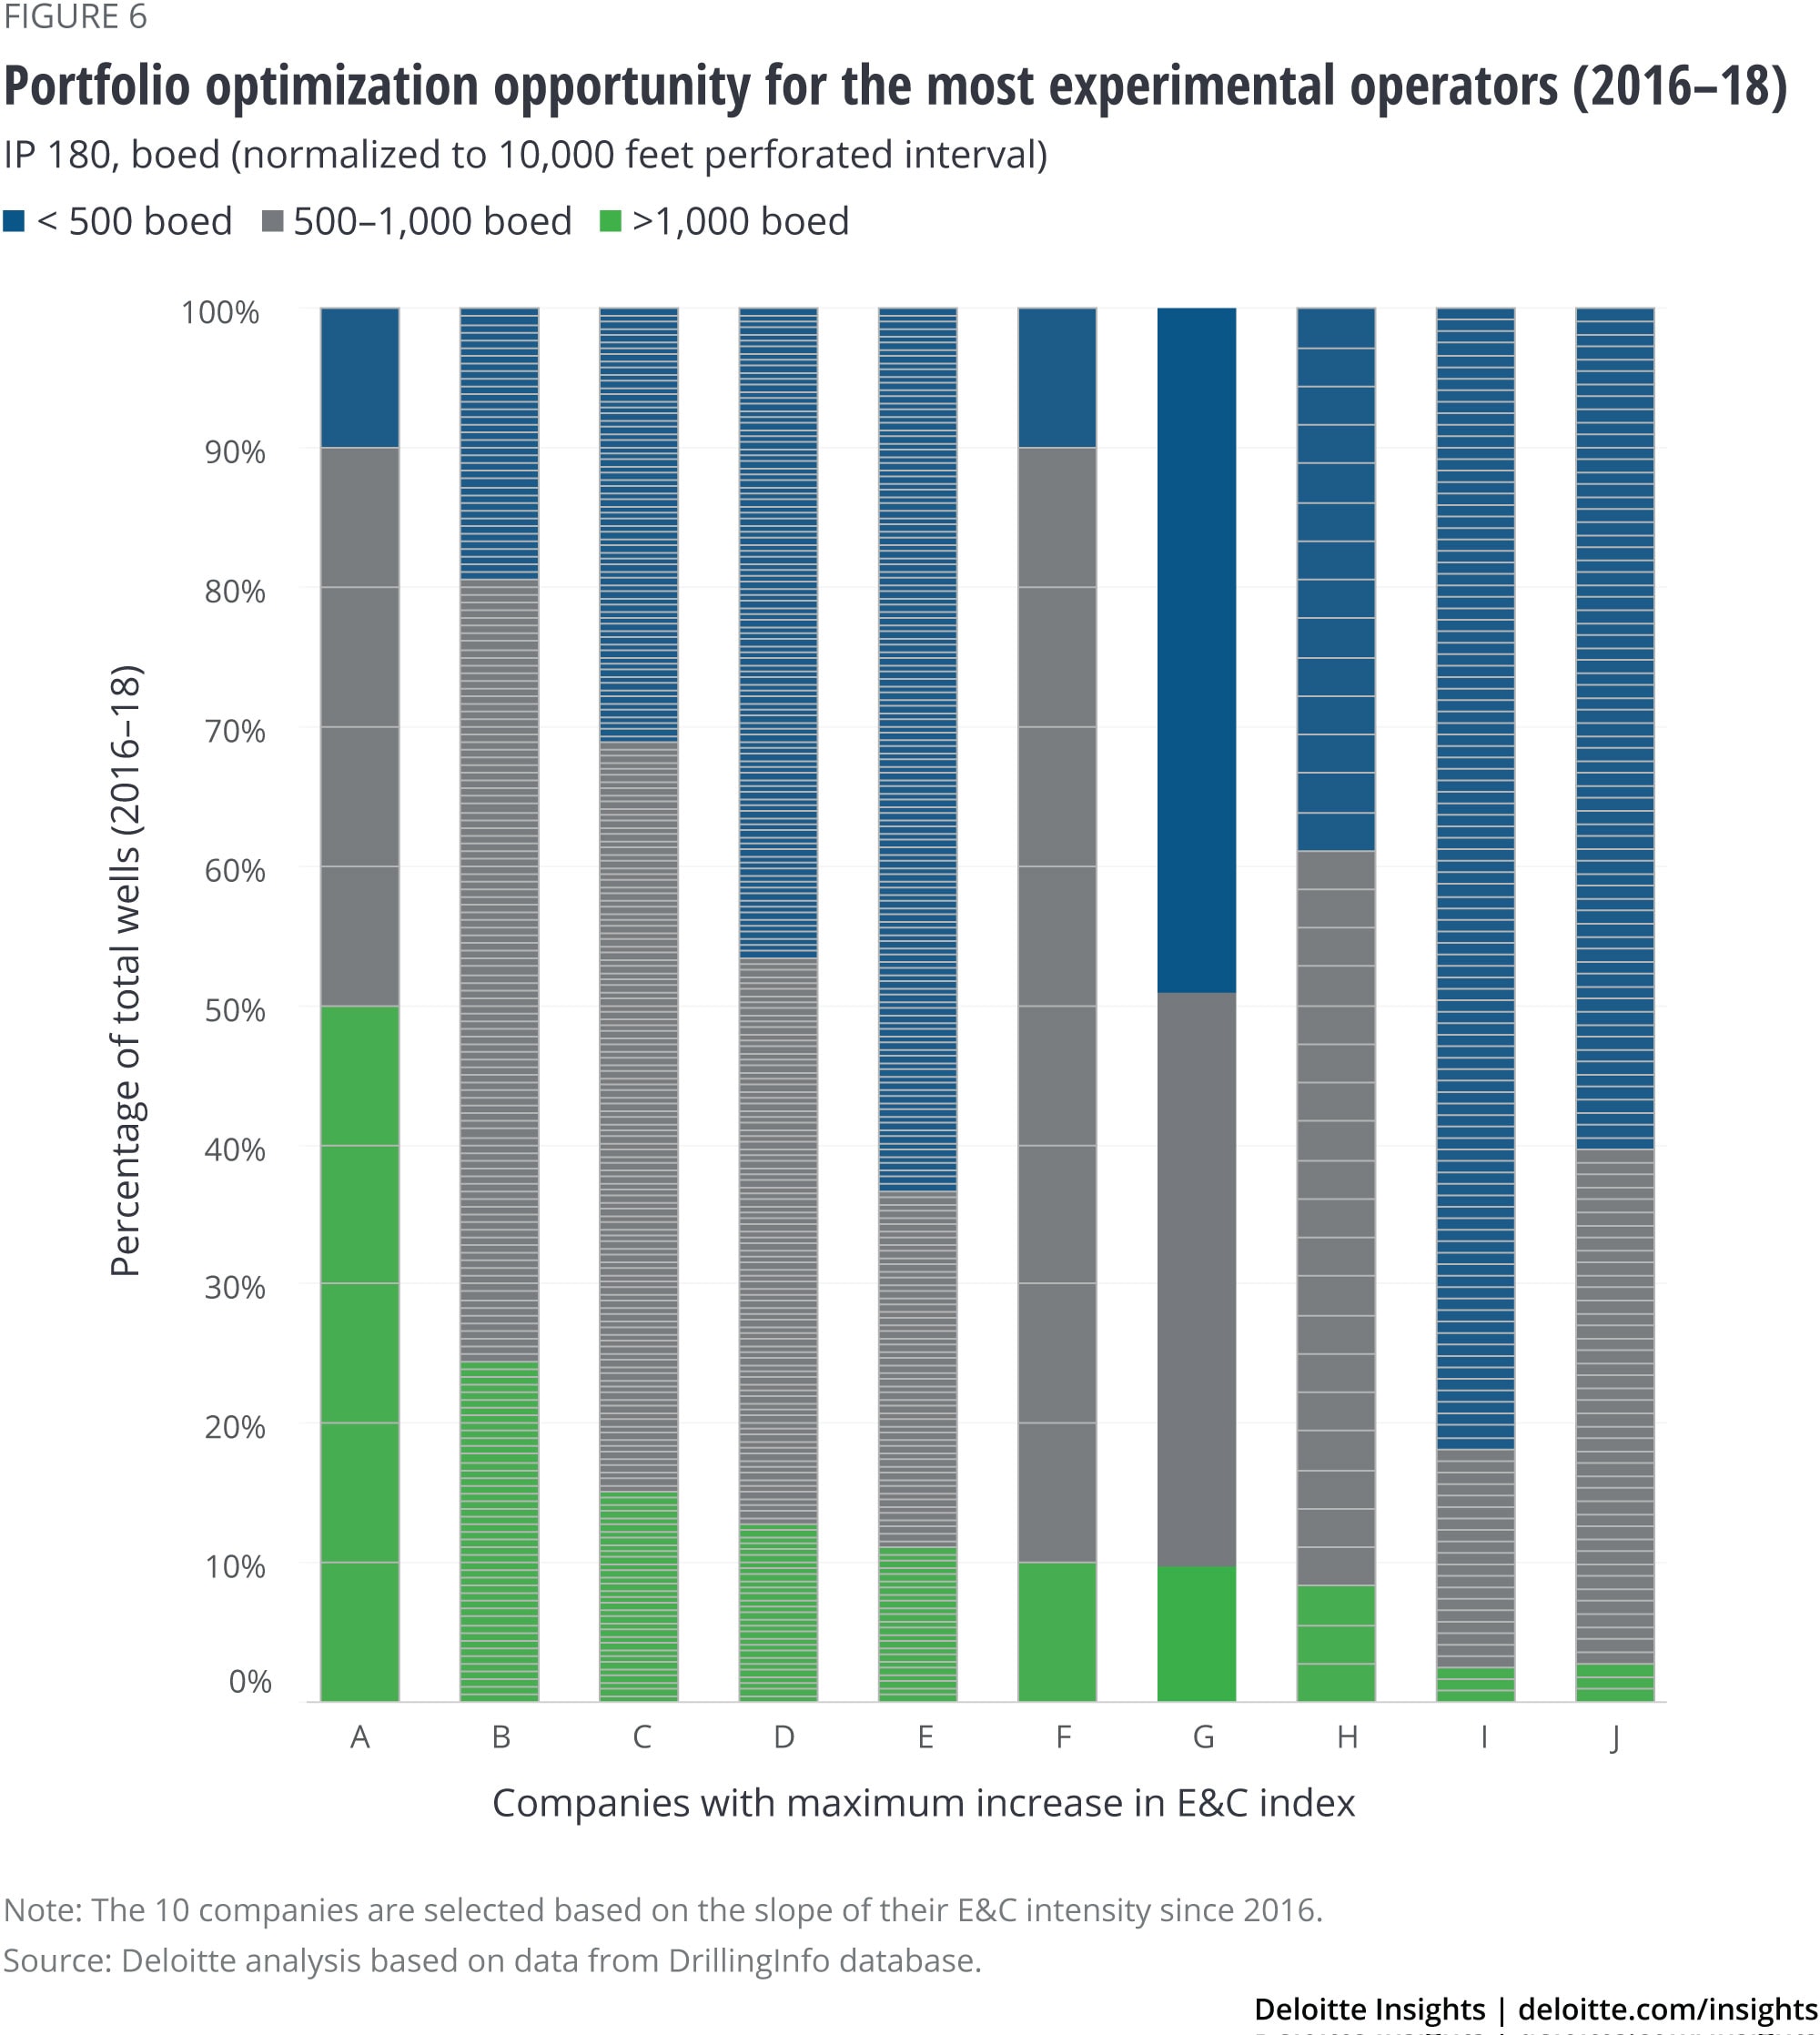
The net result: There exists both a challenge and an opportunity to increase well productivity across the board for this relatively immature resource play—a challenge for every operator to have a portfolio that consists primarily of top-quality wells and a sizeable opportunity for the industry/nation to extend the shale boom further by realizing its full potential. Our analysis of 10 operators that have pushed technology and engineering limits and registered the highest increase in their completion intensity highlights the prospects of optimizing their portfolio of wells by 10–80 percent (see figure 6).
Moving ahead: Improvements can drive new impetus into shale play performance
In a short span of time, the shale revolution has transformed the US oil and gas landscape and led the industry’s global transition to more competitive pricing and efficient production. But to keep its promise intact, and overcome recent concerns about returns and productivity, shale operators could benefit from:
- Bringing specificity through analytics: A statistical integration of geological, engineering, and productivity data can provide clarity to the ongoing debate on which specific factors typically influence productivity and cost most strongly in shales.
- Balancing experimentation and standardization: Move beyond “highly custom” designs and bring a balance between repeatability of manufacturing with benefits of experimentation—that is, realize greater efficiency in some elements while driving meaningful performance improvements in the rest.
- Staying ahead of emerging problems: An orderly and prompt study of its own and competitors’ learning curves, and an early course correction, could keep an operator ahead of emerging questions on well productivity and capital efficiency in shales.
- Breaking the syndrome: As against reporting progress of a few best wells only, a comprehensive portfolio assessment and narrative could help operators bridge the gap between their actual performance and the verdict of investors.
Despite shale plays undergoing their early phases of experimentation amid one of the deepest oil downturns in history, what US shale operators have achieved until now is remarkable. After learning from their and peers’ experiences, shale operators now should embrace a future that is driven by systematic application of science, better analytics, and a deeper proliferation of successful completion design strategies. In this new world of systemic science and digital innovation, the shale revolution may have all the right elements to continue surprising the industry.
Appendix
Standardized benchmarking of shale wells
The sheer variety and variability of metrics available to analyze shale wells and operators have made it challenging to get a comprehensive picture of their performance. And selective reporting by companies of subjective high-performing metrics has made benchmarking performances for a standardized comparison difficult.
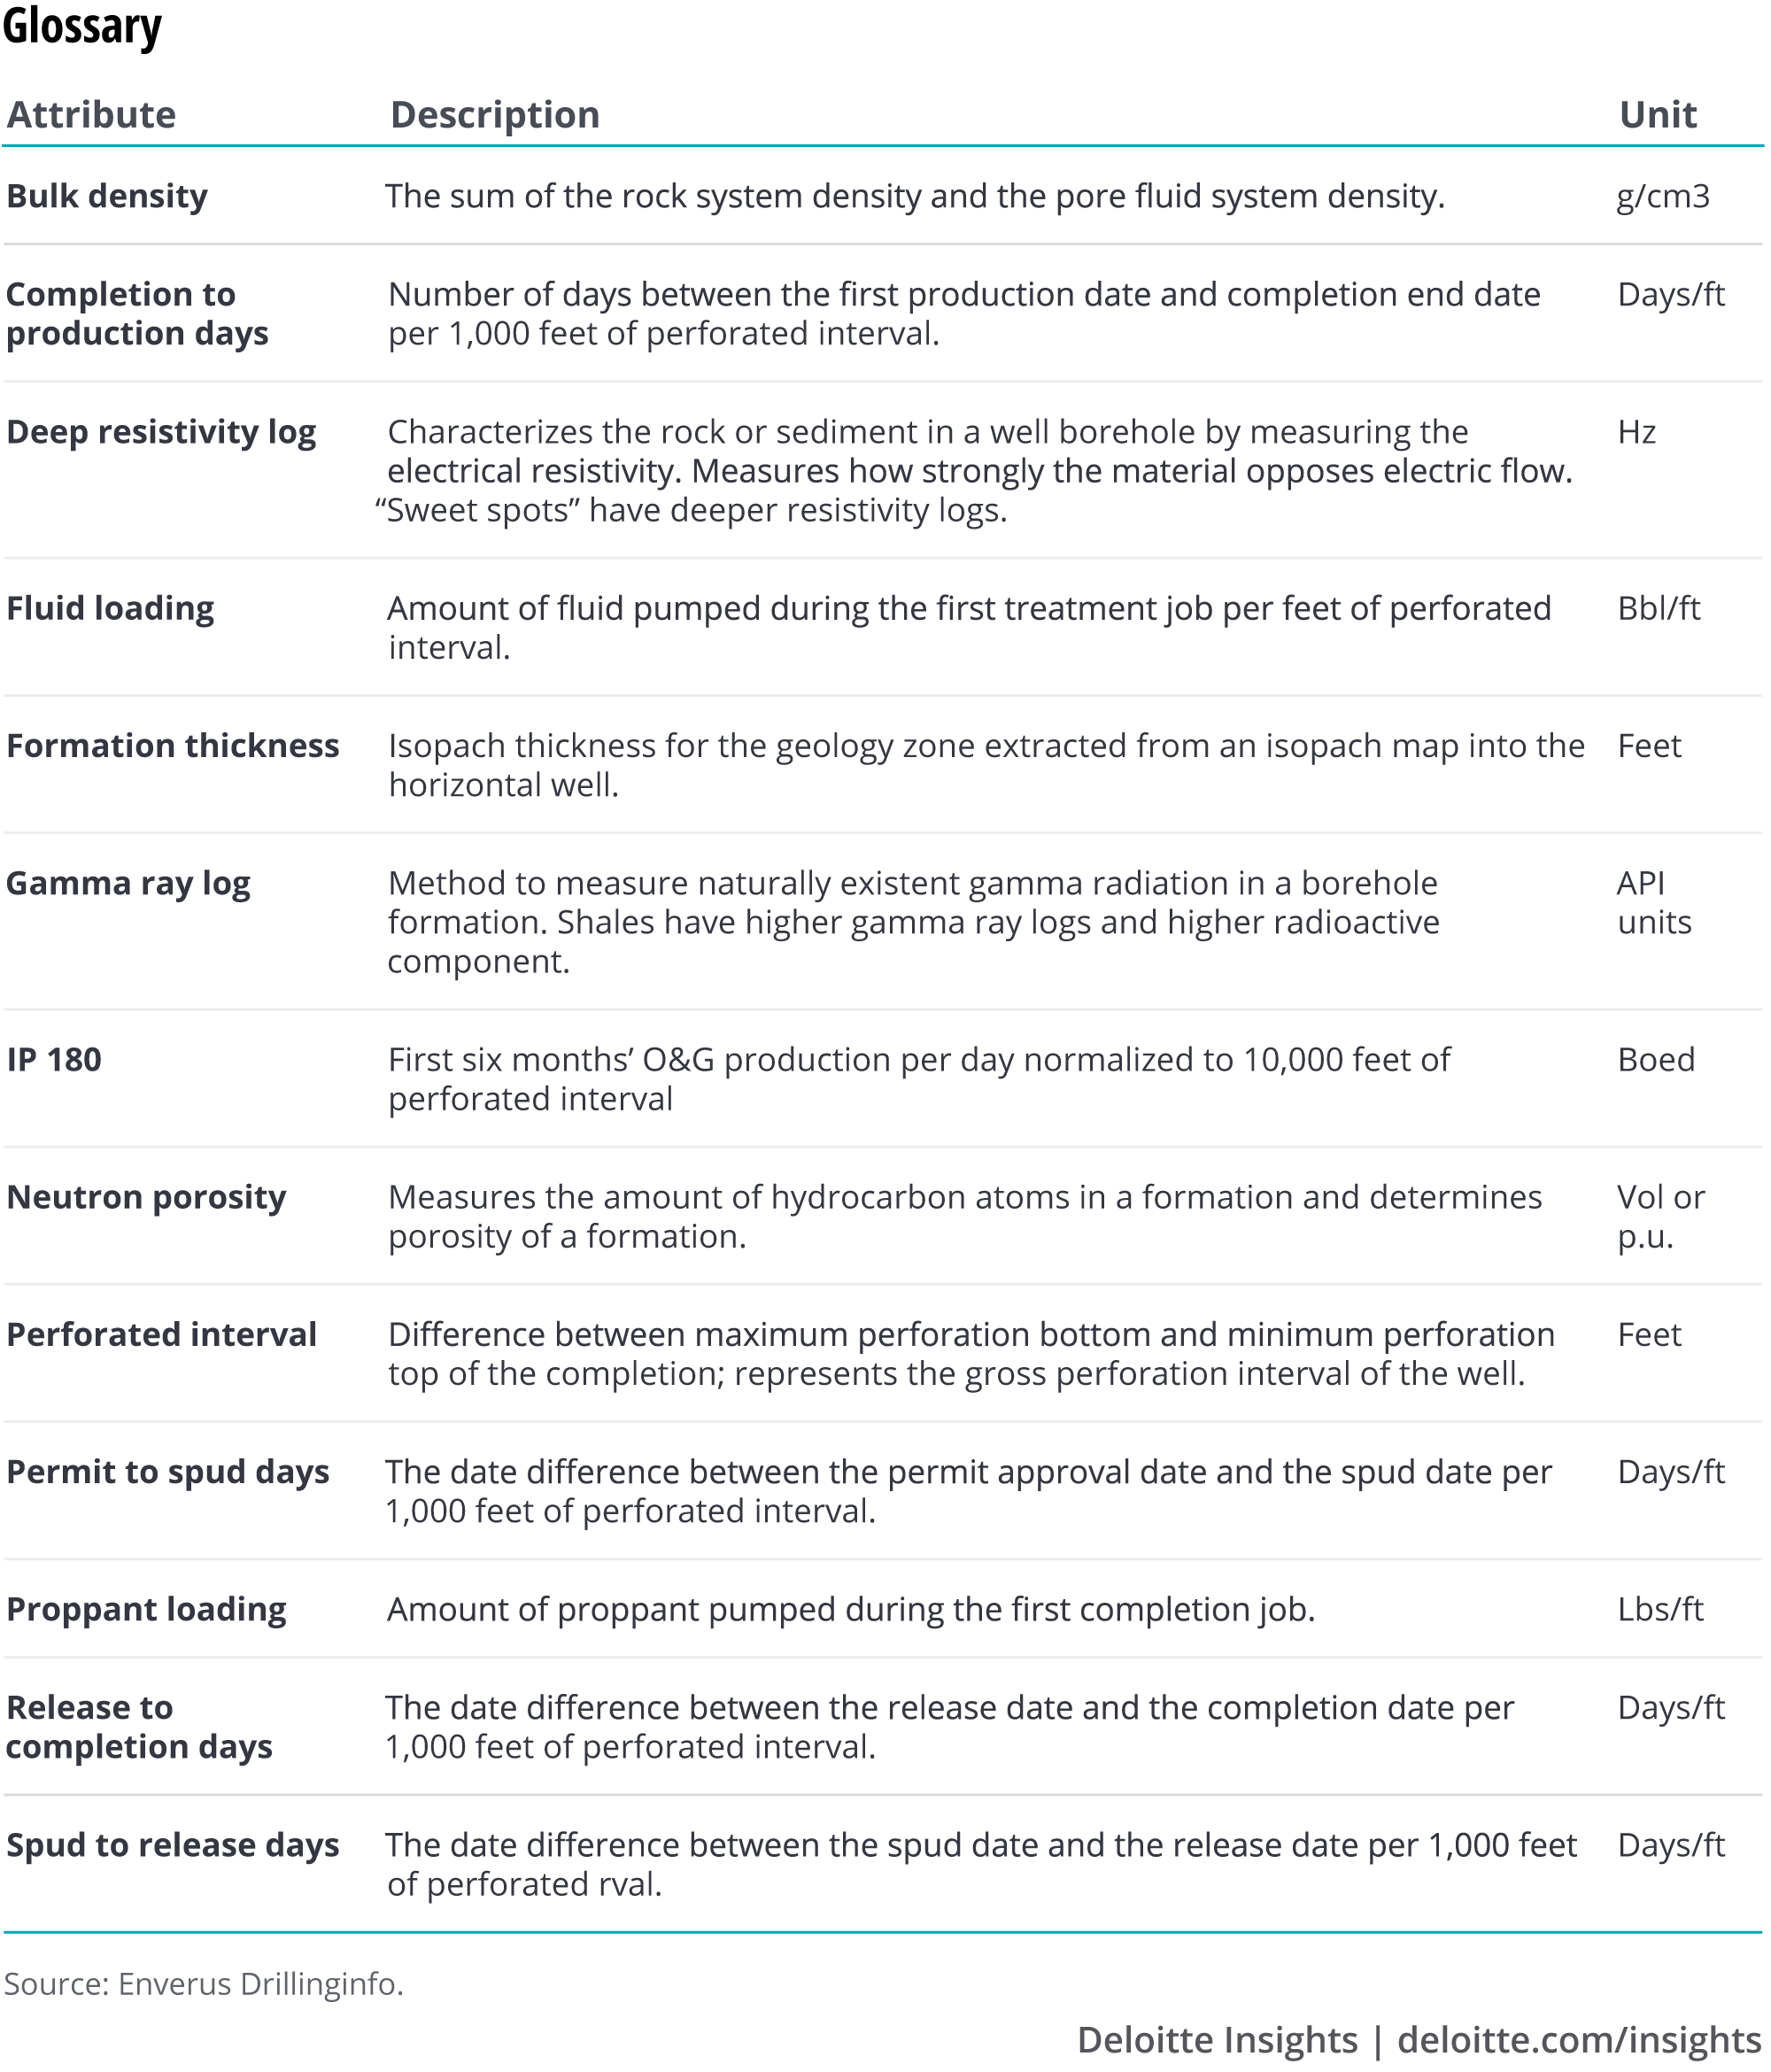
To overcome this hurdle, a vast pool of metrics used to analyze shales were identified and classified under three broad categories (see figure 7):
- Formation quality—represents aggregated petrophysical properties of the oil-bearing shale formations that could indicate its hydrocarbon potential and the complexity to recover those
- Engineering & completion intensity—represents cumulative design properties of a horizontal shale well, which indicate the complexity of a well design
- Surface planning & efficiency—represents the project planning and execution capabilities of shale operators
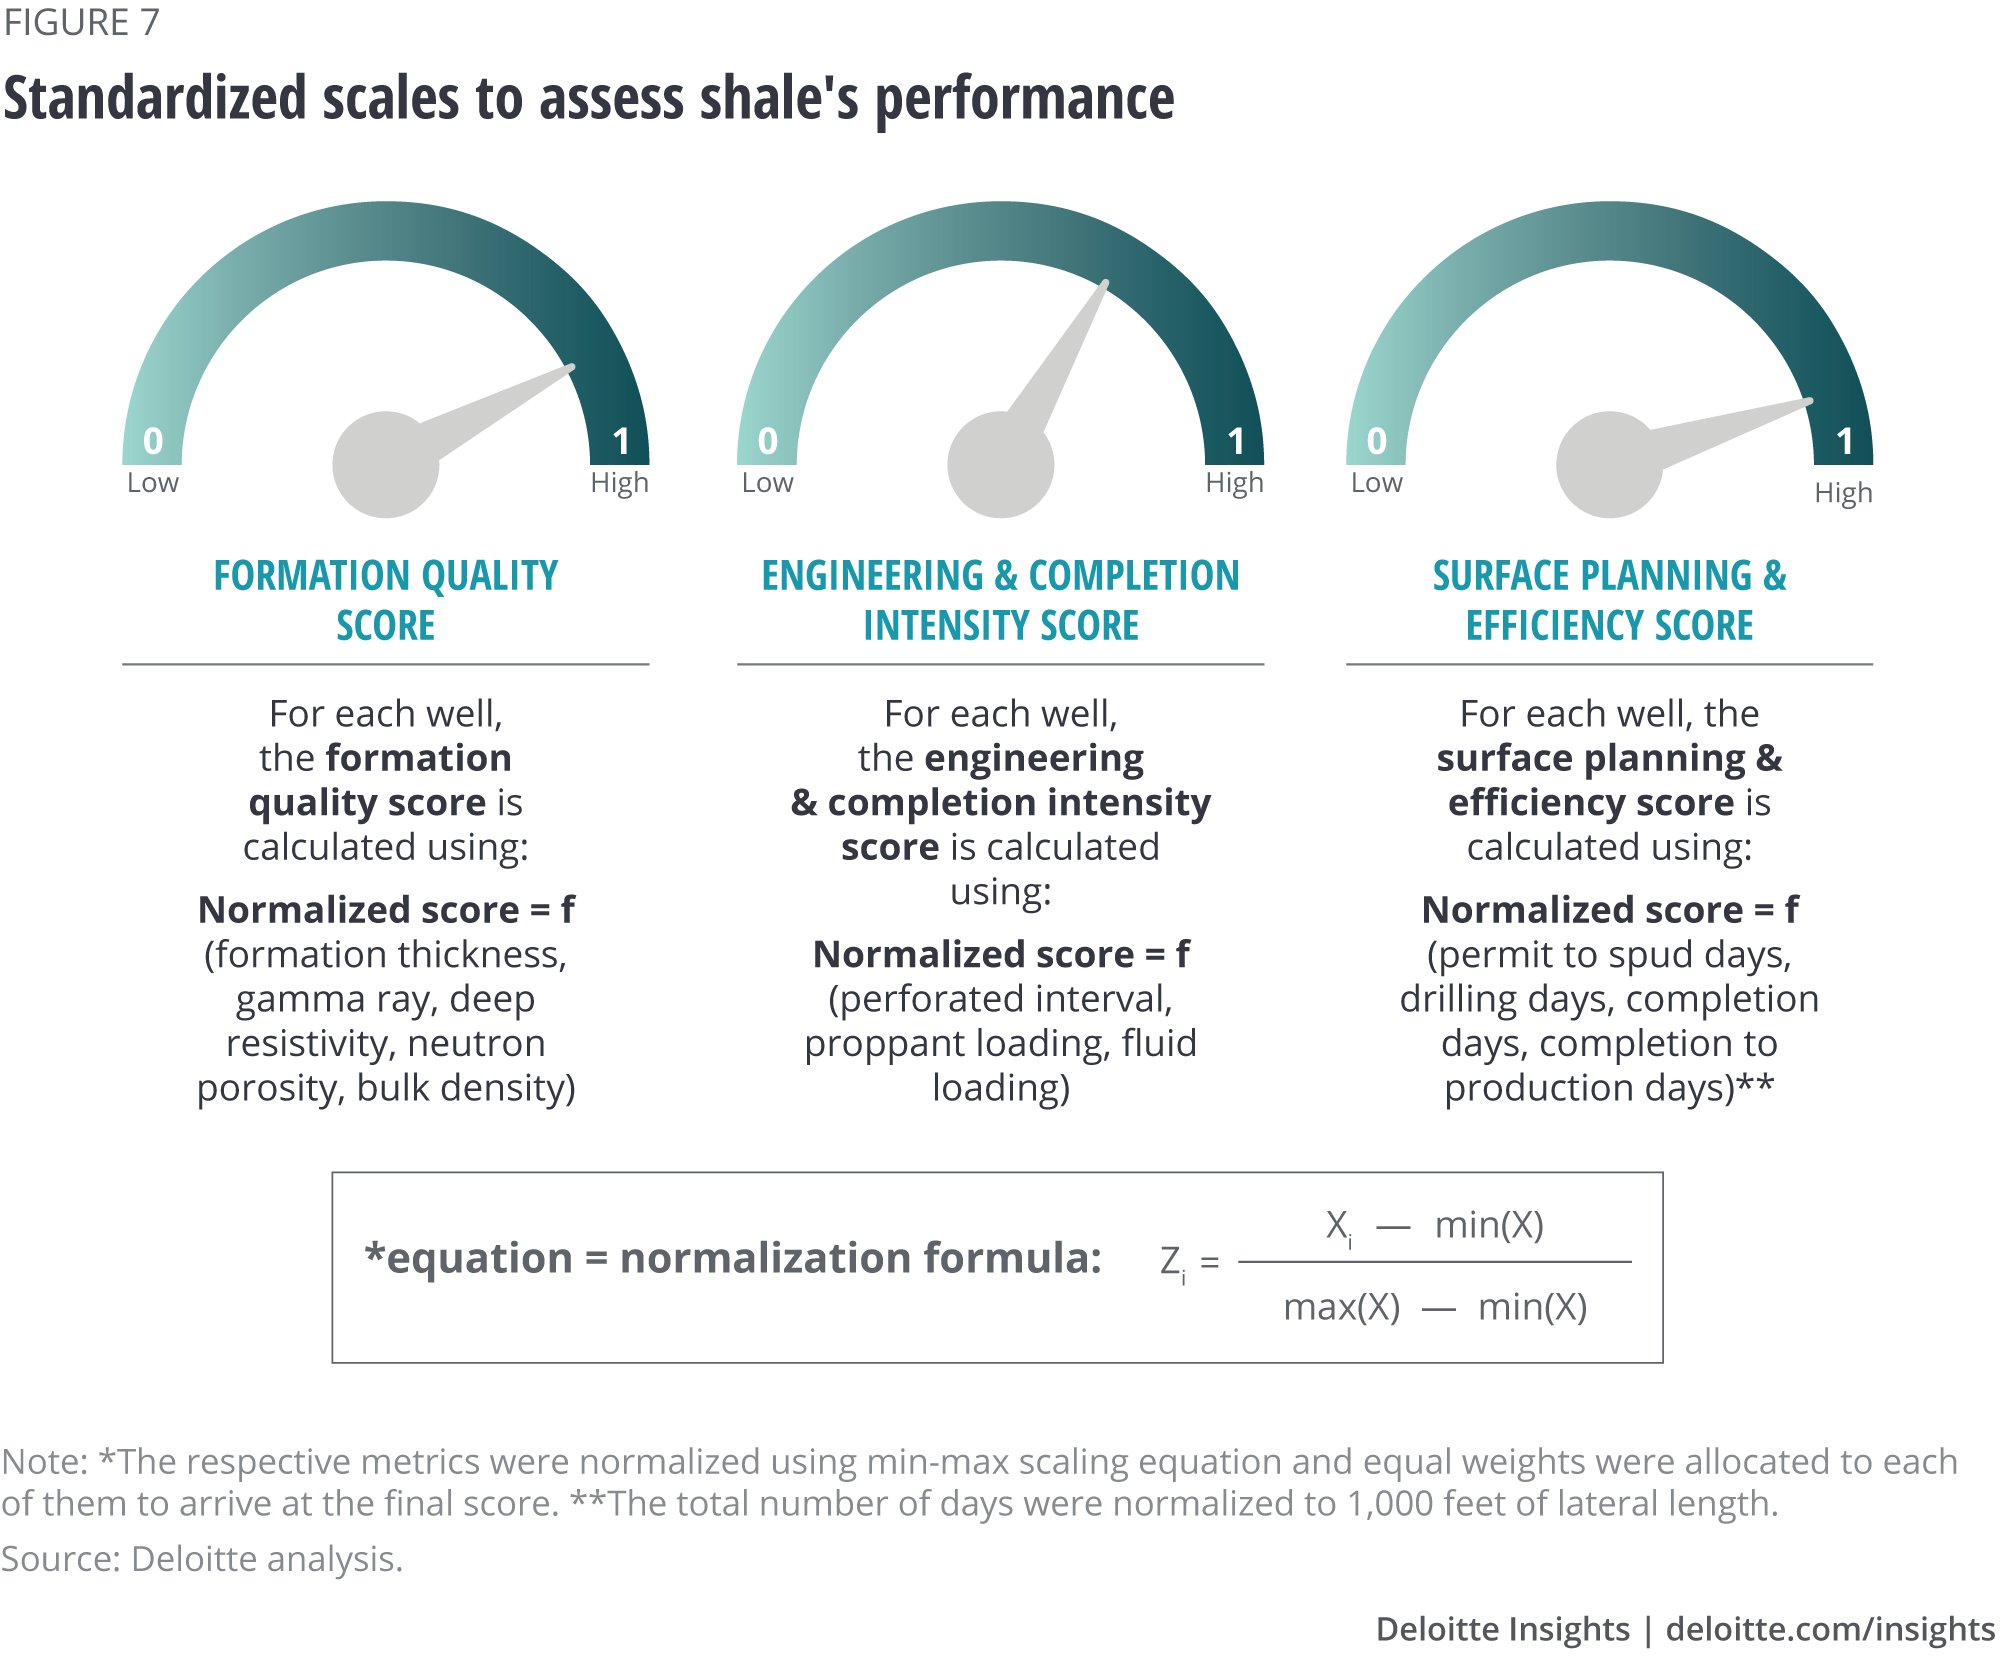
Using 10-year shale well level data for the identified metrics (>200K wells), a rigorous screening process identified the most relevant metrics for our study. The outliers for the broad range of values were further eliminated using statistical techniques such as regression testing and correlation matrix, and the resulting dataset was then standardized using min-max normalization. This exercise resulted in well-level statistical scores for each of the three categories. Individual shale wells, and in turn their operators, were graded based on their performance on all three categories to get distinctive scores. These benchmarked grades helped to compare companies and set a standard against which they could be measured.
While our analysis includes relevant metrics as per industry knowledge and data analysis, it has been developed to assess trends and relativity and is not intended to challenge existing sophisticated technical physics-based models. The scores in the study are well- or basin-level calculations, which are statistical representations of the data and not an absolute or ultimate assessment of the particular discipline. Our study aims to provide a reasonable and broad understanding of the dataset and should not be taken as the sole measurement for evaluations of shales.
Oil, Gas & Chemicals
Deloitte Oil & Gas professionals offer you the integrity, innovation, and insight to help you meet the most complex challenges. We support you in developing and executing initiatives that achieve your strategic objectives to deliver value to your stakeholders. Through audit & assurance, tax, consulting, and risk and financial advisory, our Deloitte Oil & Gas team provides comprehensive services and solutions to help move your business forward.
Get in touch

- Duane Dickson
- Vice chairman, principal
- US Oil, Gas & Chemicals national sector leader
- rdickson@deloitte.com
- +1 203 979 2300
© 2021. See Terms of Use for more information.


More in Oil, Gas & Chemicals
-
 How the shale revolution is reshaping the US oil and gas labor landscape Article6 years ago
 -
 Oil’s well?: Divergence and imbalance in the oil and gas ecosystem Article5 years ago
 -
 One Downstream Article5 years ago
 -
 Energy management: Paused by pandemic, but poised to prevail Article4 years ago
 -
 Refining & marketing: Eyeing new horizons Article5 years ago