Article
9 minute read 07 July 2022

The more you have, the more you gain: How homeownership and stocks contribute to the wealth gap in America

Homes and stocks make up a large proportion of US household wealth—great news for those who have them. But many minority households and younger households don’t.

Patricia Buckley

Patricia Buckley

United States

Monali Samaddar

Monali Samaddar

India

US wealth inequality is becoming more entrenched after the COVID-19 recession as the divide between asset “haves and have-nots” becomes greater—with home and stock ownership being the largest contributors to the growing gap. Between February 2020 and April 2022, median home prices rose by 45% and stock portfolio values grew by 40%,1 boosting the wealth of those who owned homes and stock holdings but leaving those who did not further behind. Government support programs were important contributors in reducing income and wealth inequality in the aftermath of the pandemic: The share of wealth accruing to the bottom 50% of households reached its highest level since 2003, even though that share was only 2.6% of total wealth by Q4 2021.2 However, these programs made little structural change, so these temporary government-induced gains are not expected to lessen the divide going forward.

This article has inspired a series of articles, published by five Black-owned publications around the United States, that explore the key factors that contribute to racial and generational gaps in acquiring wealth on a regional level.

Given that home and stock ownership are the largest assets driving wealth creation, a look at the racial/ethnic and age disparities in the ownership of these assets offers policymakers much food for thought. How does one craft policies that equitably support people of all races/ethnicities and generations in the face of growing wealth inequality? Never an easy task, the issue is even more challenging to address in the current environment of rising interest rates and high inflation.

Analyzing anything by race and ethnicity is complicated, but especially money

When discussing differences between races/ethnicities, it is important to understand how these groups are defined. For this analysis, we used the definitions and data from the Federal Reserve Board’s most recent 2019 Survey of Consumer Finances (SCF), a triennial survey providing detailed financial data on households by race/ethnicity and age. The SCF designates a “reference person”—defined as the economically dominant person—for each household as the primary unit of measurement,3 and the entire household is categorized as belonging to the race/ethnicity of the reference person.4 In this report, we consider households as they are categorized by the SCF: “White, non-Hispanic”; “Black, non-Hispanic”; and “Hispanic” (where a Hispanic individual can be of any race). We excluded a sizable portion (11.3%) of SCF respondents because the heterogeneity of this group, which includes Asians, Native Americans, and those claiming a multiracial background, makes it too diverse to be meaningful.

However, the SCF’s classifications are becoming more and more of an oversimplification as America becomes more diverse. This can be seen in the data from the decennial US Census, which has allowed respondents, since 2000, to choose different racial and ethnic backgrounds for different household members. This provides for a very rich and nuanced portrait of American diversity,5 and a comparison of the 2010 and 2020 reports shows that this diversity is growing. The white population remained the United States’ largest racial/ethnic group in 2020, with 235.4 million people identifying as either white alone (that is, not multiracial) or white in combination with another race—but the number of people identifying as white alone, 204.3 million, decreased by 8.6% since 2010.6 Further, the multiracial population, which was measured at 9 million people in 2010, jumped to 33.8 million in 2020, a 276% increase.7 The “in combination” multiracial populations for all race groups accounted for most of the overall changes in each racial category.

The increase in the multiracial population creates a major limitation to our understanding of income and wealth trends among racial and ethnic groups. Classifying a household as a particular race/ethnicity based only on that of its economically dominant member obscures potentially more complex relationships between race/ethnicity, income, and wealth. In essence, we are drawing conclusions based on the designation of the reference person without knowing how “white,” “Black,” or “Hispanic” the households really are.

Home and stock ownership are primary drivers of wealth

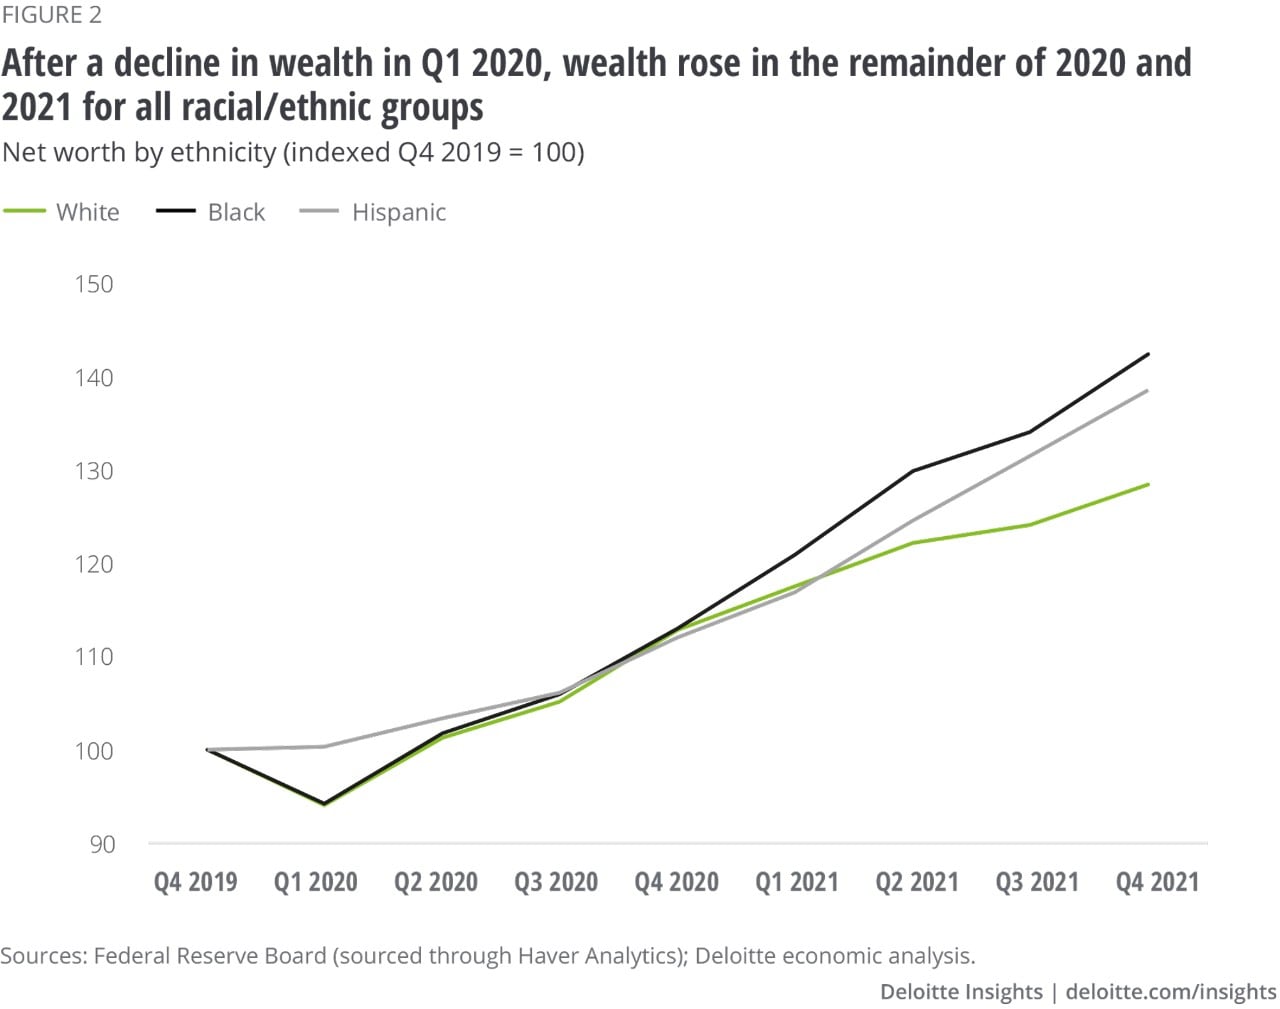
Let’s first examine the evidence that homes and stocks are major contributors to growth in US household wealth. Between Q4 2019 and Q4 2021, total US household wealth rose by US$32 trillion after dipping during the COVID-19 recession in Q1 2020. Furthermore, the pace of growth in net worth was much faster during the bounceback after Q1 2020 than it was in the pre–COVID-19 expansion.8

According to a US Federal Reserve analysis, 80% of the post–COVID-19-recession growth in wealth between Q4 2019 and Q1 2021 (the most recent data at the time of the study) can be attributed to an increase in asset prices, particularly to increases in real estate, stock, and bond value.9 Though equity prices fell sharply between February and March 2020, they rebounded quickly after the Fed, US Treasury, and Congress took steps to stabilize financial markets.10

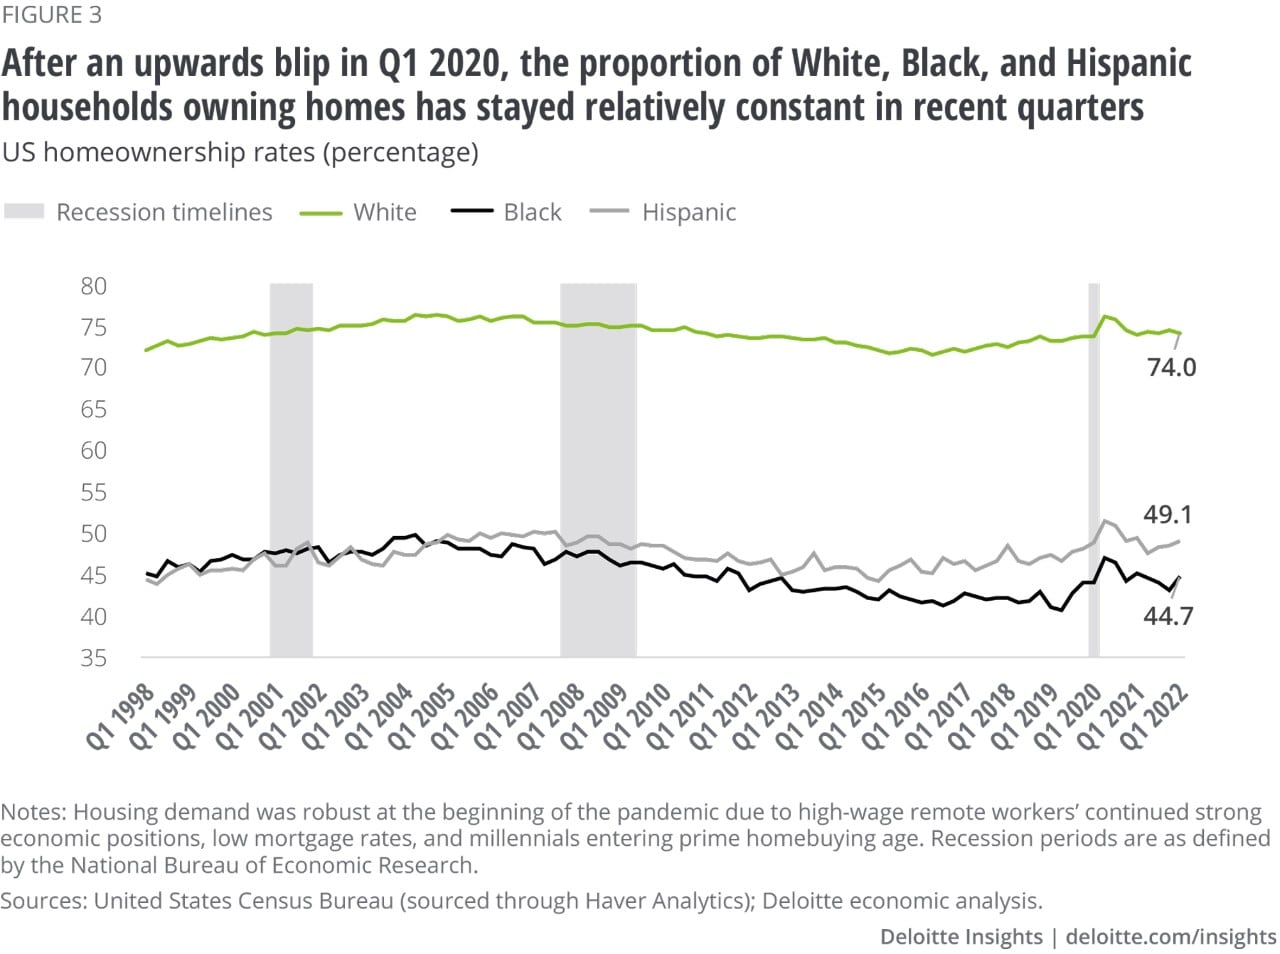
The value of real estate holdings increased 12.6 percentage points between Q4 2019 and Q1 2021.11 This rise, according to the Fed study cited above, was almost entirely due to a 13% increase in median home prices during 2020 and 2021, not to an increase in homeownership rates.12 Recovering stock markets provided even more of a boost.

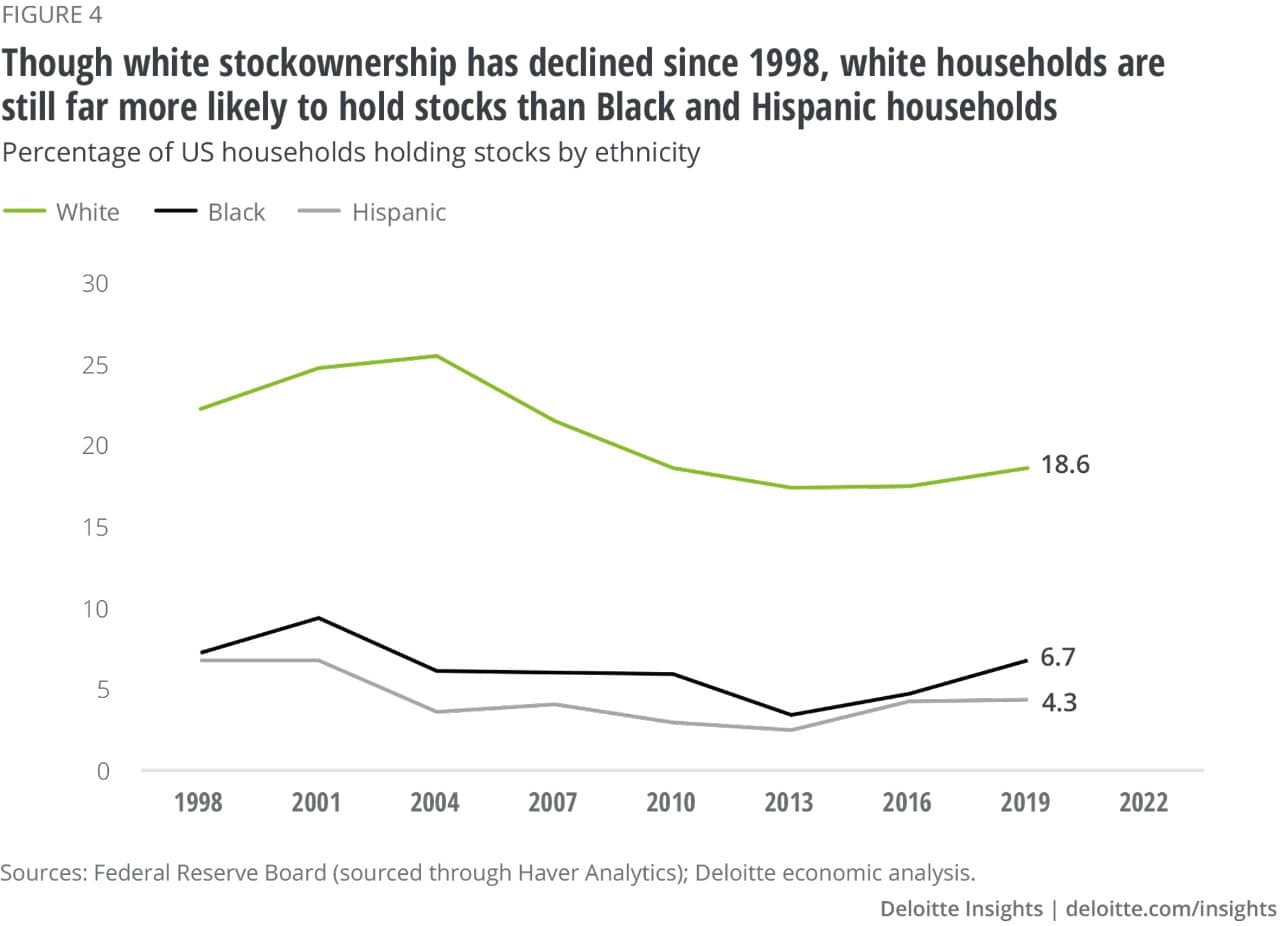
These trends tell us that owning a home and/or stocks gives households a distinct advantage in growing wealth. It’s not that a higher percentage of people own homes or stocks today than they did in early 2020—as shown below, ownership rates have been mostly flat—but that those who did enjoy a dramatic rise in the value of those assets since then.

Despite a narrowing of the wealth gap postrecession, home and stock ownership among racial/ethnic minorities still lag those of white households

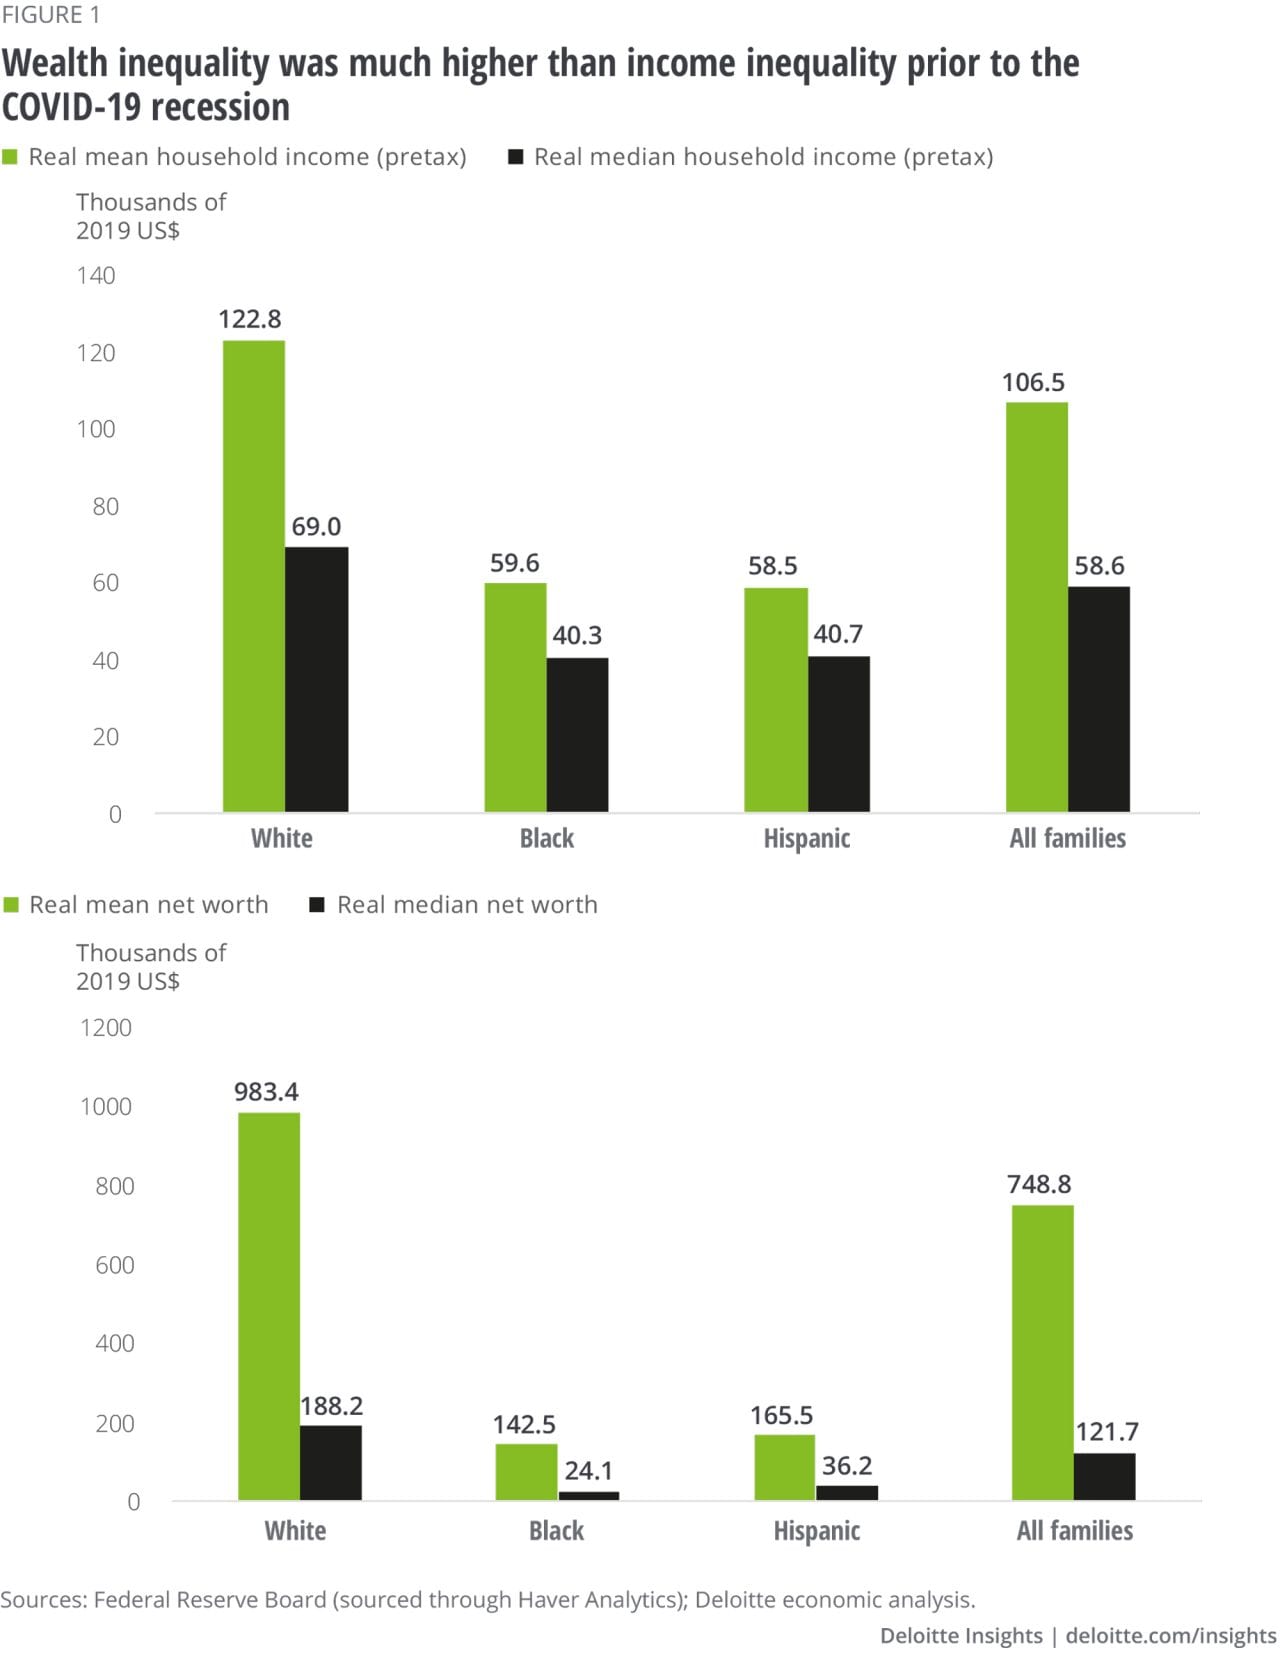
To understand whether the postrecession growth in US household wealth affected racial/ethnic wealth disparities, we examined data from the Federal Reserve Board’s most recent 2019 Survey of Consumer Finances (SCF), a triennial survey providing detailed financial data on households by race/ethnicity and age. Unsurprisingly, the numbers show clear differences in wealth between households that the SCF classifies as white, Black, and Hispanic (a fourth “other” category was not included in our analysis, as it is too heterogenous to allow for meaningful comparisons. See the sidebar for a full explanation). These gaps, however, are not constant over the years but widen and narrow in different time periods.

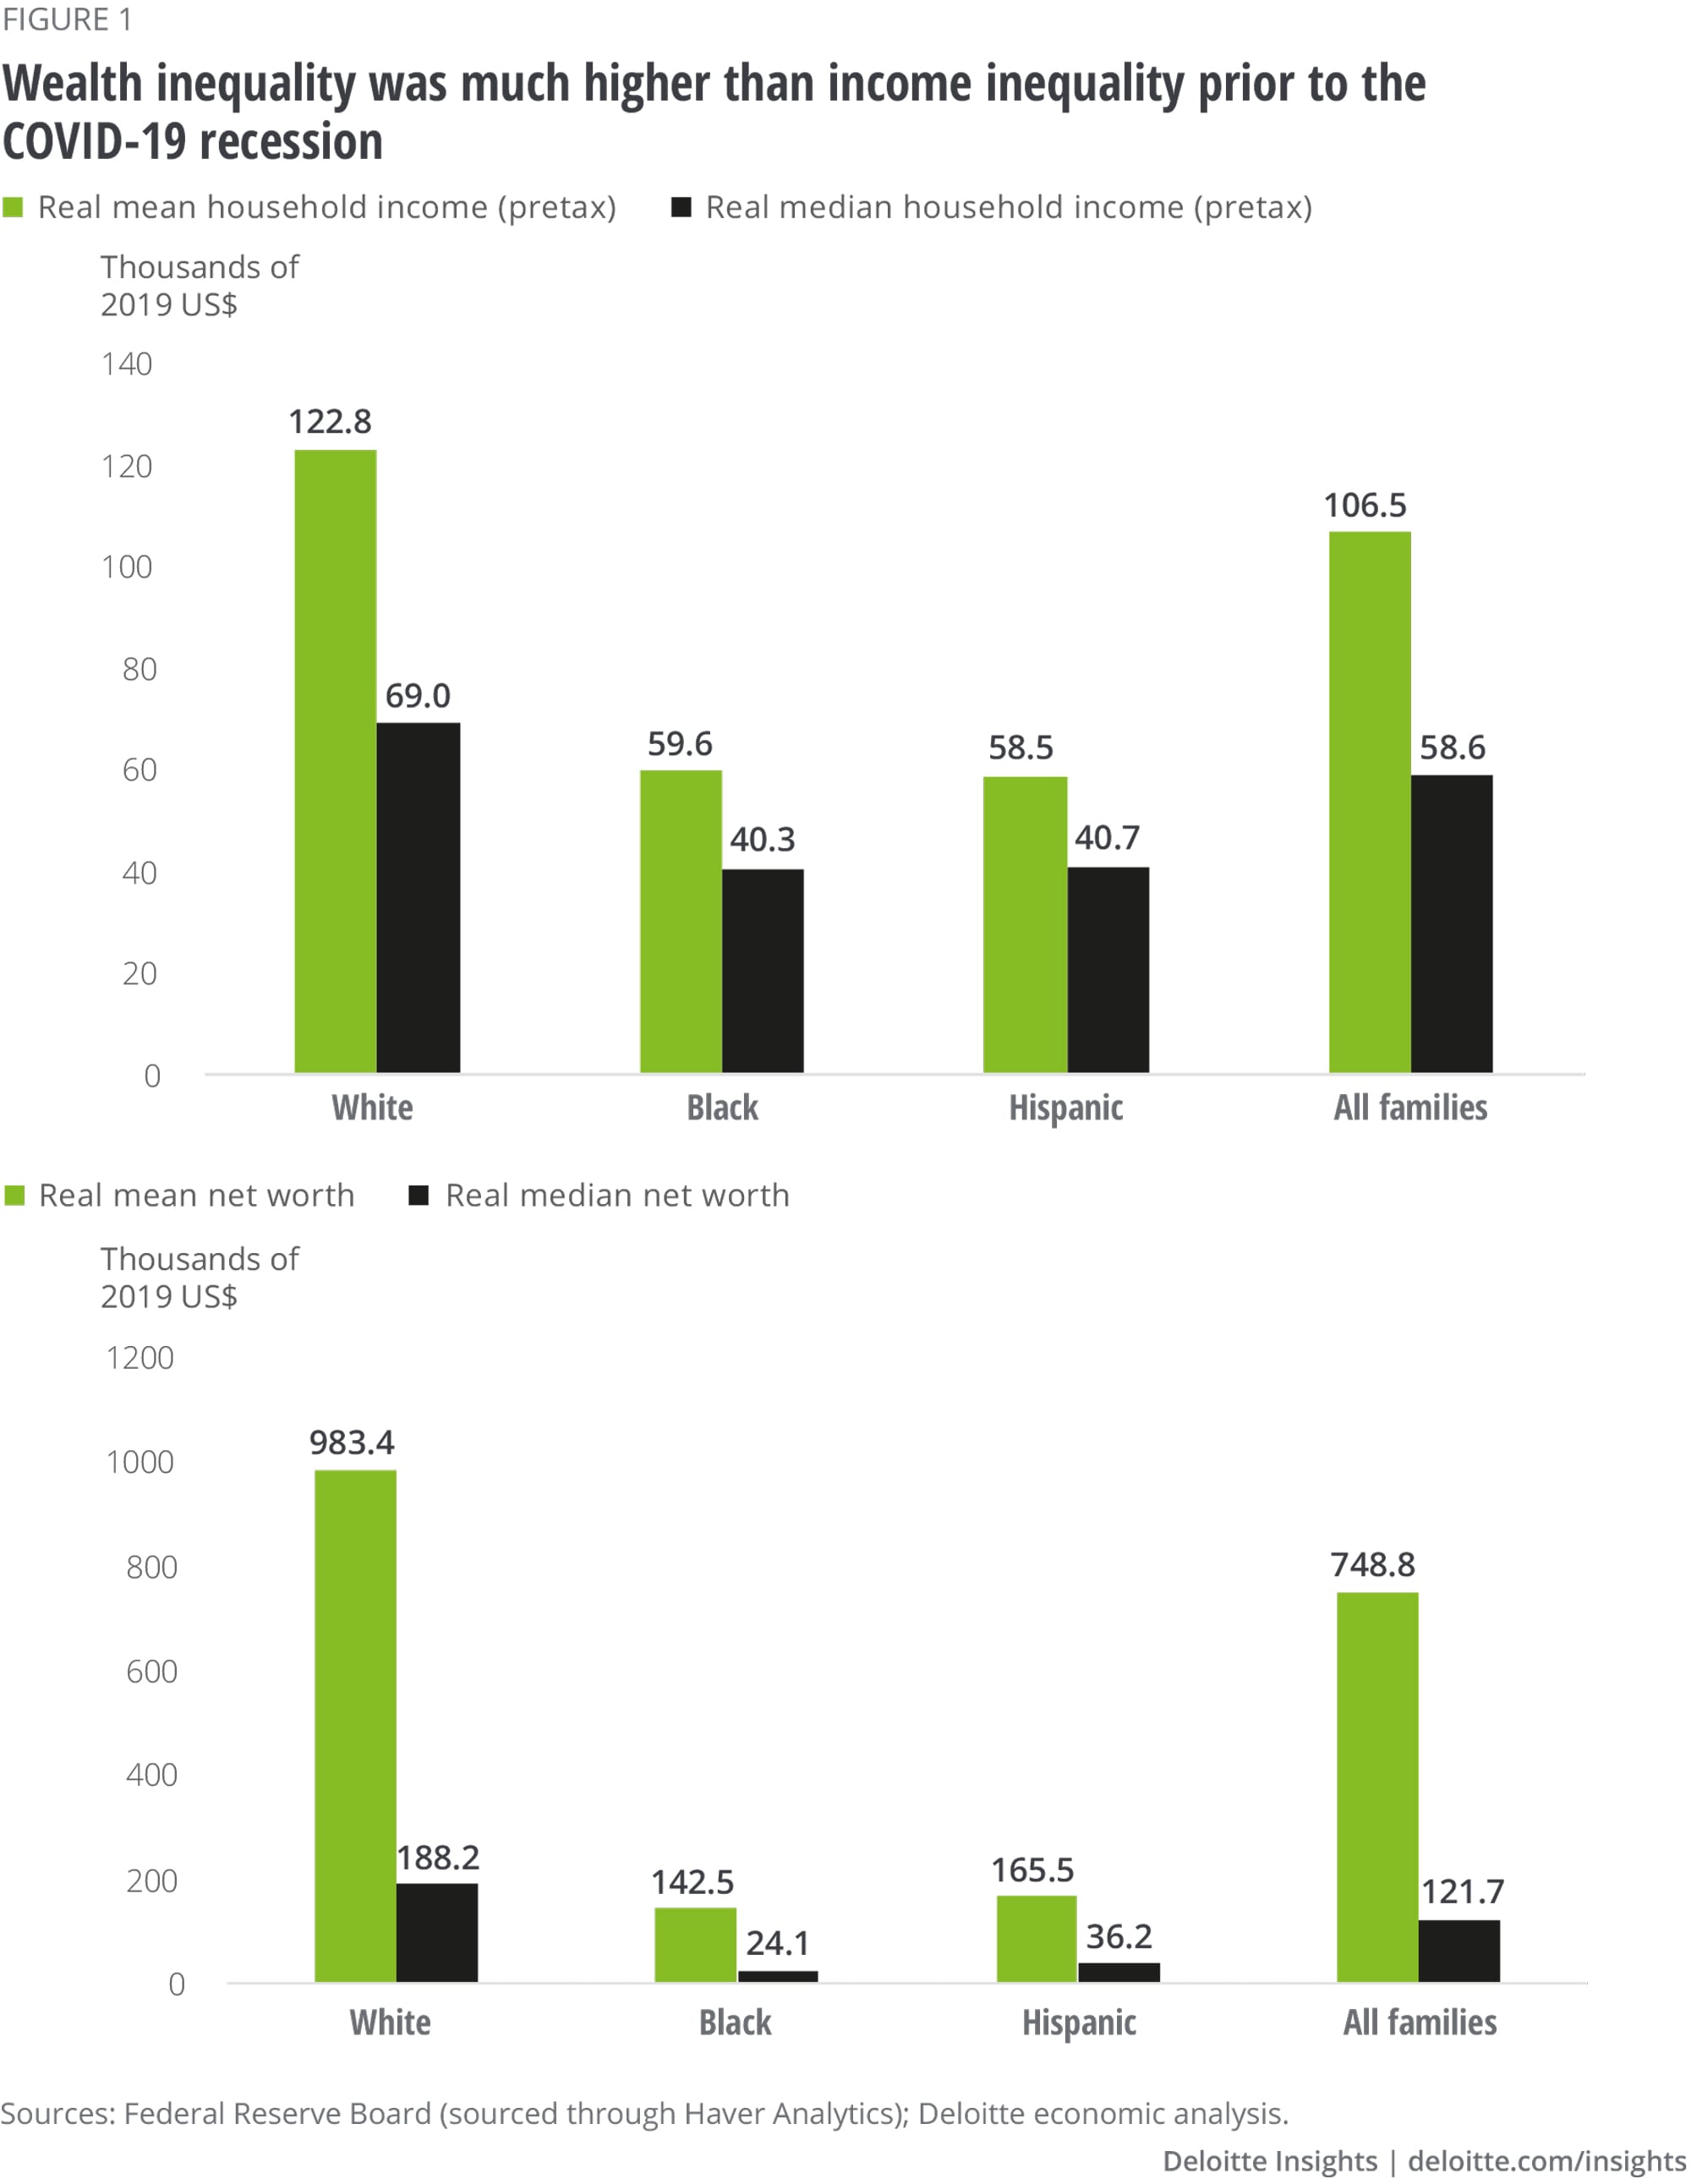
In the economic expansion before the COVID-19 recession, wealth disparities among races/ethnicities were on the rise. On average, white households added US$34,400 to their median real wealth between 2010 and 2019, while Hispanic households added US$17,100 and Black households only US$5,300. The standard economic measure of inequality—the difference between the median and the mean of each group’s income or wealth13—shows that wealth inequality just before the recession was much greater than income inequality, both between races/ethnicities and within each race/ethnicity (figure 1), although income inequality also rose during this time.14

Interestingly, the wealth gap among racial/ethnic groups narrowed slightly after the COVID-19 recession. While we do know that government COVID-19 support programs were the cause of declining income inequality in 2020,15 the causality to lower wealth inequality is not clear. The Fed’s Distributional Financial Accounts (DFA),16 which reports aggregate wealth and income levels by race/ethnicity, shows that the fall in wealth for white and Black households in Q1 2020 was followed by rapid growth: Real median net worth levels for both groups were again higher than Q4 2019 levels by Q2 2020, and continued to grow through Q4 2021 (figure 2). Applying the DFA wealth growth rates between Q4 2019 and Q4 2021 to the SCF data on different races’/ethnicities’ 2019 wealth levels, we find that Black households’ net worth as a share of white families’ net worth rose from 12.8% in 2019 to 14.2% in 2021. For Hispanic households, this share rose from 19.2% to 20.7%.

Does this mean that racial/ethnic wealth disparities will continue to decline? Here, the evidence is not clear. Homeownership rates for Blacks and Hispanics, in particular, were on an upswing starting in early 2019 before peaking in Q2 2020 (figure 3). Post–Q2 2020, however, the gains reversed to back to near their Q4 2019 levels.17 With regard to stock holdings, unfortunately the SCF’s data by race/ethnicity only goes through 2019. As figure 4 shows, stock ownership rates for all groups have improved from their 2013 lows, with Black households having the highest percentage point increase.18 But considering the still-large gap between white ownership rates and those among the other two races/ethnicities, Black and Hispanic households as a group are still at a disadvantage when it comes to increasing their wealth through these critical assets.

Millennials have less wealth than did older generations at a comparable age … though not by much

Race is not the only way to look at wealth disparities; age is also a dimension of interest. Here, the DFA data shows that millennial households, although they have higher incomes than older generations did at the same age, have less wealth (figure 5). The real median before-tax family income for millennials in 2019 was US$48,600 compared with US$44,600 for Gen-Xers in 2004 and US$41,500 for baby boomers in 1989.19 Yet millennials’ real median net worth was only US$13,900 in 2019 compared to US$19,200 for similarly aged Gen-Xers in 2004 and US$15,600 for baby boomers in 1989. (The comparison years were chosen because these were the years when the majority of members of each generation were younger than 35.)

Differing homeownership rates may help explain part of this seeming paradox, although the dollar values invested in each asset type likely also differ by generation. While a greater percentage of millennials hold stocks and have retirement accounts than did earlier generations at the same age, only 36.2% of those under age 35 (mostly millennials) owned a residence in 2019, compared to 41.6% of those under 35 in 2004 (most Gen-Xers) and 39.4% of those under 35 in 1989 (the boomers).20

Higher interest rates and inflation are set to make a bad situation worse

The current economic environment does not bode well for households of any race/ethnicity or age seeking to buy a home or invest in the stock market. Rising interest rates, for instance, create barriers to homeownership: The 30-year fixed mortgage rate increased from 3.86% in early March 2022 to 5.09% as of June 2, 2022.21 This will lead to likely delays in home purchases, as those looking to buy will face the double whammy of higher home prices and higher mortgage rates.

High inflation, running at 8.3% annually in April 2022,22 also reduces purchasing power for all households. However, because, on average, many Black, Hispanic, and younger households have lower average incomes than older white households, a larger proportion of their total expenditures typically goes toward necessities such as food, housing, utilities, and transportation (figure 7). This creates two problems for those trying to set money aside to invest in homes and stocks. First, necessities are the very categories that inflation has hit hardest. For example, food inflation has risen at an annual rate of 9.4% in April 2022, up from 7.0% in January 2022 and considerably faster than the 3.8% rate in January 2021 (figure 8). This is in contrast to prices of nonessentials such as recreation items or apparel, which have recorded slower and less volatile price increases (between 3–6%).23 And second, after paying for necessities, lower-income households have less left over in dollar terms to use for home or stock purchases.

All of this suggests a lesson for policymakers. With assets such as homes and stock portfolios now as the primary tools of wealth accumulation, those seeking to reduce wealth inequality should consider ways to make these assets more accessible to diverse racial/ethnic and younger populations. If they can do this and do it equitably, the United States could take a large step toward mitigating the wealth disparities that have characterized the American economy since detailed records on wealth by race and age began to be kept in 1989.

  1. For median home prices, change is calculated on National Association of Realtors’ median home prices, sourced through Haver Analytics; for stock prices, change is calculated on S&P 500 index returns. Unless otherwise stated, all data is sourced through Haver Analytics.View in Article
  2. Federal Reserve Board, “Distributional Financial Accounts ,” June 2022.View in Article
  3. Survey of Consumer Finances, Summary listing of questions asked in the 2019 SCF, accessed June 7, 2022.

    View in Article
  4. In the SCF survey , there are four classifications of racial groups: White non-Hispanic, Black or African American non-Hispanic, Hispanic or Latino, and other or multiple race (we will henceforth refer to these groups as White, Black, Hispanic, and other, respectively). For this report the “other” category has been dropped because it is too diverse to be meaningful.View in Article
  5. US Census Bureau, “Improved race and ethnicity measures reveal U.S. population is much more multiracial ,” August 12, 2021.View in Article
  6. Ibid.View in Article
  7. Ibid.View in Article
  8. Federal Reserve Board, “Distributional Financial Accounts: Distribution of household wealth in the U.S. since 1989,” accessed June 3, 2022.

    View in Article
  9. Federal Reserve Board, “Wealth inequality and COVID-19: Evidence from the Distributional Financial Accounts,” August 30, 2021.

    View in Article
  10. Ibid.View in Article
  11. Ibid., Federal Reserve Board’s calculation from valuation model based on sales data from Zillow. For more details, see Hannah Hall, Eric Nielsen, and Kamila Sommer, “A new measure of housing wealth in the financial accounts of the United States ,” Federal Reserve Board, September 28, 2018.View in Article
  12. Federal Reserve Board, “Wealth inequality and COVID-19.”

    View in Article
  13. Because a group’s median income or wealth is defined as the midpoint amount, where 50% of the population has more and 50% has less, the median is much more representative of most people’s situation than the mean, since mean income is highly influenced by the highest earners and mean wealth is highly influenced by the richest. Hence, the greater the gap between the mean and median, the greater the inequality.View in Article
  14. As an aside, the trend of rising income inequality reversed following the COVID-19 recession. The contraction’s severity led Congress to swiftly pass major support legislation to provide households with additional income in the form of stimulus payments and tax credits. When these supports are added to the Census Bureau’s standard measures of pretax income, the figures show that income inequality in 2020 lessened over 2019 as more of the payments from these pieces of legislation flowed to lower-income households. Further, US Census Bureau data shows that median income rose the most in both dollar and percentage terms for Black, Hispanic, and younger households. However, the government supports were only temporary, and we do not yet have 2021 data to know whether the narrowing of the income gap held beyond the one year.View in Article
  15. Ibid.View in Article
  16. Federal Reserve Board, “Distributional Financial Accounts,” June 2022.

    View in Article
  17. Census Bureau, “Quarterly residential vacancies and homeownership, first quarter 2022,” April 27, 2022.

    View in Article
  18. Ibid.View in Article
  19. Ibid.View in Article
  20. Ibid.View in Article
  21. Freddie Mac, “Primary Mortgage Market Survey,” accessed June 2, 2022.

    View in Article
  22. Bureau of Labor Statistics, “Consumer Price Index,” accessed May 2022.

    View in Article
  23. Ibid.
    View in Article

The authors would like to express a special thanks to Junko Kaji, editor extraordinaire, for her help in shaping this piece.

Cover image by: Jaime Austin


Deloitte Global Economist Network

The Deloitte Global Economist Network is a diverse group of economists that produce relevant, interesting and thought-provoking content for external and internal audiences. The Network's industry and economics expertise allows us to bring sophisticated analysis to complex industry-based questions. Publications range from in-depth reports and thought leadership examining critical issues to executive briefs aimed at keeping Deloitte's top management and partners abreast of topical issues.

Patricia Buckley

Patricia Buckley

Chief US economist

Subscribe

to receive more business insights, analysis, and perspectives from Deloitte Insights