Article
19 minute read 17 May 2021

Portfolio transformation in oil and gas

Capture hydrocarbon value or embrace green energy?

Amy Chronis

Amy Chronis

United States

Noemie Tilghman

Noemie Tilghman

United States

Kate Hardin

Kate Hardin

United States

Anshu Mittal

Anshu Mittal

India

Should O&G companies optimize and capture the remaining hydrocarbon value or embrace the broader energy scope? There is no easy answer to this conundrum.

A decade of crude dynamics

The 2010s will go down in history as unforgettable for almost every crude oil and natural gas (O&G) player. From peak to subzero oil prices, inelastic to highly elastic demand, prime blue chips to “speculative stock” tags, shale boom to shale pain, and the world’s biggest initial public offering (Saudi Aramco) to mass bankruptcies, the O&G industry saw a complete reversal of its fortunes in the past decade (figure 1).

With over $230 billion in impairments and asset write-offs in 2020 alone, the financial (and even environmental) argument for fossil fuel divestment appears strong.1 A decade of unusual crude dynamics and accelerating energy transition is, in fact, prompting stakeholders and money managers of many O&G companies to wonder if there is long-term value in the fossil fuel business.

Inarguably, the high-growth phase of the oil market has come to an end. But the compelling reality is that oil demand will likely not evaporate anytime soon. In fact, some accelerated energy transition scenarios still project oil demand of at least 87 MMbbl/d by 2030.2 This immense gap between the extent of reliance on hydrocarbons now and a potential “green economy” has created an investment, portfolio, and strategy conundrum for O&G companies—whether they should stay and capture the remaining, albeit uncertain, value in hydrocarbons or embrace the broader energy scope.

Breaking the myths surrounding portfolio optimization

The exercise of navigating change is not new to O&G companies, with many having transformed their portfolios from integrated to pure play, gas to oil, offshore to shales, and global to regional in the past. What seems different this time around is the complexity (low and volatile oil prices), necessity (market push for better margins and living within cash flow means), and pressure to transform (rising expectations of stakeholders around clean energy solutions).

Although the longstanding hydrocarbon investment handbook isn’t fully applicable now, it can still offer a valuable lesson or two to prepare for a low-carbon future. Deloitte’s analysis of 286 global O&G companies’ portfolios over the past 10 years (see the sidebar “Assessing the change: Methodology”) disproved five myths (figure 2) about portfolio building in the O&G industry.

Assessing the change: Methodology

Deloitte conducted an in-depth statistical and financial analysis for 286 listed global O&G companies (exploration and production [E&P] pure plays, integrated, national oil companies [NOCs], and refining and marketing companies) for the 2010-2020 period. The analysis had two parts:

A. Portfolio analysis (statistical analysis)

• Analyzed the annual O&G production of upstream companies at a geography, basin, segment, and fuel-category level.

• Ascertained and graded the changes using several statistical techniques, including standard deviation (degree of change), slope function (direction of change), multivariate analysis (composite changes), among others.

B. Performance benchmarking (financial and statistical)

• Analyzed the historical performance of companies on 10 parameters:

1. Revenue growth to measure growth

2. Operating margins to measure profitability

3. Return on capital to measure real returns

4. Selling, general & administrative (SG&A) expense/total employees to measure admin costs

5. Research & development expense/total assets to measure innovation

6. Asset turnover ratio to measure productivity

7. Debt/capital ratio to measure solvency

8. Capex/operating cash flows to measure capex intensity

9. Price/book ratio to measure valuations

10. Total shareholder returns (TSR) to measure investor returns and their support

• For each parameter, higher and systematic weights were given to recent years.

• Values of all parameters were statistically normalized and relatively ranked.

• A composite score for each company was ascertained across the 10 parameters.

• Higher consideration was given to an all-round performance across the 10 parameters, as against letting one or two parameters (such as TSR or revenue growth) influence the results.

Analyzed the portfolio changes made by a company and its relative financial performance, supported by secondary research.

Sources: Rystad, Capital IQ, Deloitte analysis. 

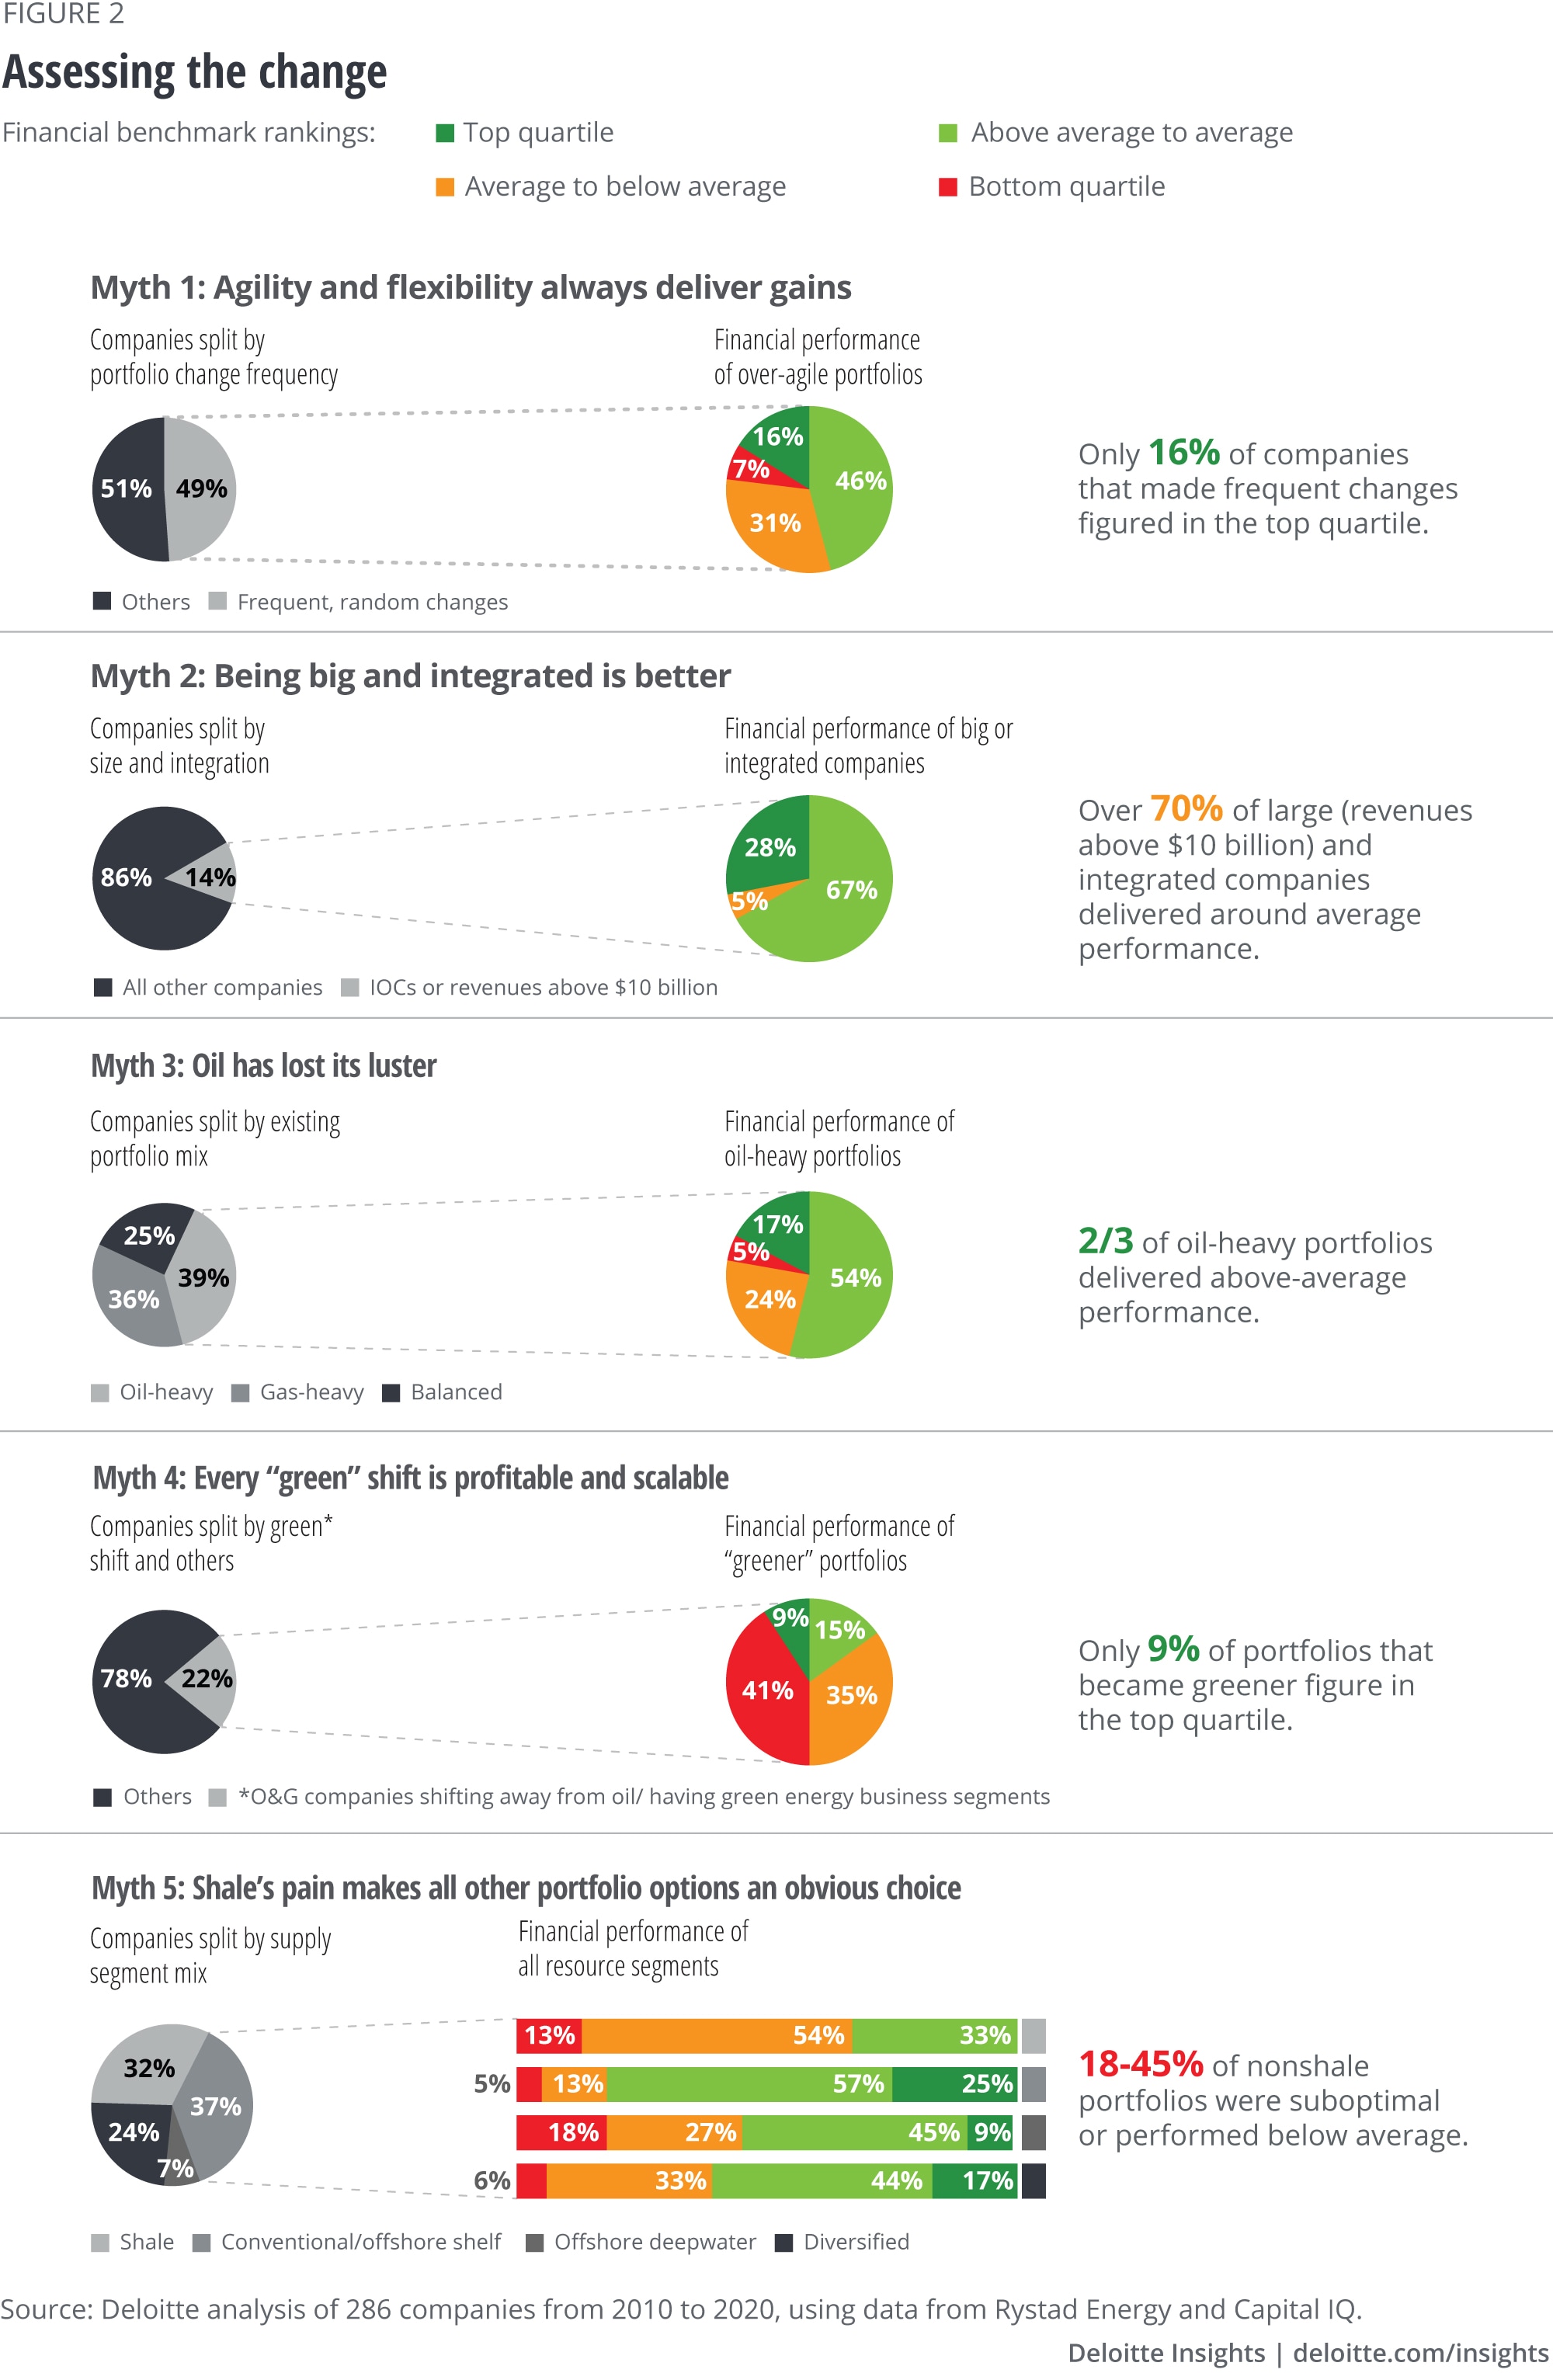
1. Myth 1: Agility and flexibility always deliver gains.
Reality: Only 16% of companies analyzed that made frequent changes figured in the top quartile.

Having an agile and flexible portfolio (especially one that includes short-cycled shales) is often hailed as a silver bullet for O&G companies to unlock new value. If done correctly and consistently, agility and flexibility can create tremendous impact.

But if portfolio optimization is “overdone” or done indiscriminately and follows oil price cycles, it can destroy the value and trust of stakeholders. An integrated company, for example, constantly changed its fuel and supply segment strategy over the past 10 years, moving between oil to gas, shale to conventionals and back, but failed to generate lasting value from these changes.

About 49% of companies in our sample set made frequent changes in their portfolios (i.e., they made many and frequent changes in their fuel mix, supply segment, or regional footprint over the past 10 years).3 Of these 49% of the companies we analyzed, not surprisingly, only 16% delivered top-quartile performance across the 10 parameters (figure 2).4 In contrast, companies that seemed more strategic and deliberate in their portfolio building, delivered much better results. Cimarex Energy, for example, has made consistent changes to its portfolio and stayed true to its strategy of building a low-cost position in the Permian basin by following a standardized proppant intensity and completion design strategy for its shale wells.5

2. Myth 2: Being bigger and integrated is better.
Reality: Over 70% of large and integrated companies delivered subpar performance.

Size and integration make strong strategic sense when used to exploit market access and supply chain efficiencies, or to offer a stable investment avenue. But in today’s lackluster hydrocarbon scenario, the cons of this strategy are beginning to outweigh its pros. In fact, in some cases strong balance sheets and integrated reporting structures could be hiding inefficiencies in portfolios of large companies.6

Of the publicly listed non-NOC companies that are either big (revenues >$10 billion) or integrated, a majority underperformed over the past 10 years. Only 28% of them delivered top-quartile performance with only three companies figuring in the top 10 performers, despite having some of the strongest balance sheets.7 Interestingly, many NOCs have outperformed their publicly traded counterparts due to their low-cost resource base, high-pressure fields, and access to markets.

3. Myth 3: Oil has lost its luster.
Reality: Two-thirds of oil-heavy portfolios delivered above-average performance.

Even as oil reaches peak demand, demand is expected to slowly plateau over the coming decades, and is projected to remain above 87 MMbbl/d till the end of this decade.8 Just to replace the annual consumption and offset natural field declines, the industry would need to invest more than $525 billion annually in O&G projects.9

Even in a decade marred by disruption and acute price pressure, oil generated significant value for many low-cost oil operators and their stakeholders. In our analysis, for example, about 66% of oil-heavy portfolios sampled delivered above-average returns.10 In fact, a few oil companies have delivered average returns on capital of over 20% over the last 5 years, higher than many companies in nonservice industries including utilities and capital goods. For example, Lundin Energy AB has realized value from its oil-heavy portfolio and consistently delivered an all-round performance over the last 4-6 years.11

4. Myth 4: Every “green” shift is profitable and scalable.
Reality: Only 9% of portfolios that became greener figure in the top quartile.

If judged by the growing interest of investors, there is a perspective that green portfolios and sustainable business models are can’t-miss and must-own investments of the future. And while costs have fallen considerably, the relative economics of green energy businesses are yet to deliver consistent results. Of the portfolios we analyzed, 22% became greener (i.e., companies that increased the share of natural gas and/or renewables in their portfolio mix) over the past 10 years. But only 9% of them figured in the top quartile. The delivered returns of a business are important for O&G companies that are looking for a scalable and competitive revenue source that can generate similar, if not higher, returns of around 20%.12

For instance, a few electric-vehicle charging station companies have seen their stock price rising by up to 3000% in the last 12 months, although they’ve only made losses since incorporation.13 Examples like these strengthen the caution of conventional O&G companies that are scrutinizing the green wave from the sidelines. But in cases where O&G companies have made investments in renewables or clean tech that are complimentary to their core business, they have seen benefits. Although the green shift is inevitable in the medium-to-long term, striking a right balance between hydrocarbons and green energy can be essential in the near term.

5. Myth 5: Shale’s pain makes all other portfolio options an obvious choice.
Reality: 18-45% of nonshale portfolios analyzed delivered below-average performance.

Since 2012, the going has been tough for US shale companies—the domestic gas price fell to $1.8/MMBtu in 2012 and they had to absorb a price discount of $3-5/bbl in the WTI crude, make repeated capex cuts, and declare layoffs and bankruptcies in 2020,14 which is likely why no shale company figures in our top quartile. Even then, the pain in shale doesn’t make other resources an “obvious” investment choice—in our analysis, about 18% of conventional-heavy portfolios analyzed figure in the third and bottom quartiles, with most delivering average to slightly above-average returns in the overall analysis. The under-performance among offshore deep-water and diversified portfolios is high with 39-45% of them featuring in the bottom two quartiles. Put simply, it’s less about where one drills and more about how one drills—through operational excellence, companies can create a differentiated value irrespective of the resource including shales they are in.

The portfolio frontier

If building a winning portfolio from just two choices (oil and/or gas) was not easy, imagine the complexity when there are n number of resource options (figure 3). While companies understand the imperative to change, the choice between staying and competing for the remaining value in hydrocarbons (the traditional choices) and embracing energy transition (the new choices) is not an easy one.

As for hydrocarbons, the world is expected to need oil and gas for years. The average annual supply decline is 7-8%, and even if demand rolls back 1-3 percentage points every year, that still leaves an annual gap of 4-7% globally.15 Given current capital constraints, only self-funded specialists or innovative marketers with low-cost operations—irrespective of having a pure-play oil or an integrated portfolio—will likely be able to effectively fulfill the existing demand. For example, Vestigo Petroleum, a subsidiary of Petronas, was incorporated as a marginal field specialist in 2013 to develop small and stranded O&G reservoirs with a cost-effective, manufacturing approach.16 Similarly, Occidental delivered first-of-its-kind 2 million barrels “carbon-neutral oil” (GHG emissions associated with the entire crude life cycle offset by the retirement of carbon credits) to Reliance Industries in early 2021.17

Many new scalable and high-growth choices are available in the green energy space, from those adjacent to hydrocarbons (carbon plays, such as foundational sustainability measures, biofuels, and carbon capture) to those in the new energy spectrum (renewable power, green hydrogen, and mobility). The biggest portfolio conundrum (or the divide) for O&G companies, in fact, is now between these two green energy choices, with notable differences in the strategies of European and US companies. European majors, for example, have been aggressively buying in the “new energy” space through their acquisitions of renewable electricity (e.g., TOTAL’s recent $2.5 billion deal with the Indian renewable firm Adani Green Energy).18 US majors, however, seem to be prioritizing “low-carbon” choices with an aim to reduce GHG emissions and natural gas flaring from their core hydrocarbon operations.

Oil and electricity—the two ends of the portfolio spectrum—are both commodities but with different margin and risk-return profiles. The industry has—and will likely continue to have—companies operating on both ends of the spectrum. Traditional upstream companies could choose to remain oil and gas specialists and be the leanest E&Ps, operating with a pervasive focus on cost and performance. Such oil specialists may find utility-type margins and fragmented competition in the greener business unattractive, and a few of these businesses may not even play to their core strengths. At the same time, pioneers of new energy are expected to increasingly build new capabilities and move away from a commodity mindset.

Regardless of the portfolio aspirations, O&G companies should think carefully about the decisions ahead of them. Given the myriad choices available, some level of uncertainty in decision making is likely as companies evaluate their choices. But even before that, it’s imperative that they understand clearly what each decision entails, dispelling the confusion surrounding each option. To start with, they should ask themselves two fundamental questions:

• How much hydrocarbon capital could be saved or redeployed to make the overall business more optimal and forward-looking?
Saving or redeployment, however, shouldn’t lead to stranded O&G assets and hurt the growth of competitive hydrocarbon projects

• Which green choices should we pick and prioritize?
To pick green choices adjacent to existing core operations or shift to new energy business models? In either case, the shift shouldn’t create an imbalance between short-term results and long-term strategy.

Where and how much capital to redeploy?

In addressing the two fundamental questions, a good place to start is ascertaining projects/basins where capital is not earning the desired return. Deloitte has elaborated a base case scenario which evaluates projects that are generating cash returns of atleast 20% on investment at an average oil price of $55/bbl.

Using Rystad Energy’s modeled project economics of 280+ public, private, and state-owned O&G companies, our analysis reveals that that the industry has an opportunity to optimize 6% of its future O&G production (equivalent to about 7.5 MMboed) at $55/bbl over the next 10 years (2020-2030). The industry can also redeploy 20% of its future capex amounting to $838 billion over the next 10 years toward more economical hydrocarbon projects and/or promising new ventures.19

Is this amount sizeable enough to further optimize the hydrocarbon business and/or open new growth avenues? Yes. Just for comparison, the industry’s hydrocarbon investments were close to $285 billion in 2020 whereas its clean energy investments were only $60 billion during 2015-2020.

The industry has an opportunity to optimize about 7.5 MMboed of its annual O&G production and redeploy $838 billion of cumulative capex over the next 10 years.  Deloitte analysis

About 90 companies lie in the top right troubled quadrant (“strained business model”), which together have 6.1 MMboed in production and over $557 billion in capex to optimize.20 In comparison, companies lying in the bottom left quadrant (“opportunity cost to switch”), which have the most competitive and optimal hydrocarbon portfolio, have a big opportunity cost to switch from their economical hydrocarbons business to lower carbon businesses (figure 4).


Among the company groups we analyzed, the resource-rich NOCs are most comfortably placed with low-cost operations and highly productive fields—only 2% of their production and 13% of their capital allocation need to be optimized at $55/bbl.21 Supermajors and publicly traded companies have a bigger opportunity, and supermajors on average have the potential to redeploy future capital expenditure of approximately 36%—a proportion high enough to continue to position them well in the changing energy landscape.22

While many O&G companies have already taken big strides in reducing their costs and optimizing their operations, further optimization is achievable through better capital efficiency, application of new technologies, and digital innovation. As the industry deprioritizes the growth of its less economical-but-cash-generating assets, a new set of buyers either looking for stable cash returns (i.e., income investors) or those with lower overheads (e.g., private companies) may start emerging for these assets.

Will the opportunity to redeploy decrease if oil makes a big comeback (for example, current prices are around $65/bbl, much higher than many anticipated)? Probably not. While high oil prices help cash flows, high-cost projects start attracting more capital and make a company less disciplined in its capital allocation—which was seen during 2010-2014–and capital cost inflation tends to creep in as oil prices rise. In fact, our analysis at higher price levels reveals that redeployment capex increases in absolute terms with no major change at a company/group level.

Unfortunately, some companies get caught in this vicious and uncertain price and investment cycle, leaving their portfolio suboptimal and highly dependent on commodity prices for returns. How to overcome this uncertainty? Consider a rigorous operational diagnosis of hydrocarbon business, capitalizing on broader advantages of green business models (diversification and stability), and building a portfolio that is scalable, agile, optimal, and resilient (see the sidebar “Components of a forward-looking portfolio”).

Components of a forward-looking portfolio

O&G companies that decide not to stay pure plays should consider a balanced and optimal portfolio that minimizes downside risks, supports growth without straining balance sheets, and capitalizes on any potential upside. For instance, portfolios that were more resilient to oil prices crashing in 2020 should also be equipped to maximize gains from rebounding prices in 2021. Each company will have to address a set of specific questions while building an agile portfolio, balancing the following four constituents:

  • Cash generators (projects that generate cash with least risk and capital intensity)
  • Future growth engines (projects that replace lost fossil fuel-related growth)
  • Profit maximizers (projects that are fast scalable for any price upside)
  • Value strains (projects that can be targeted for capital reallocation)

Which green choices to pick and prioritize?

After ascertaining how much to invest in greener businesses, companies need to select the opportunities they want to invest in, as capabilities and management bandwidth are finite. Making this choice is not easy given a growing number of options and a rapidly changing leaderboard of new businesses. Natural gas, for instance, which started with a big promise in early 2000s is now competing with renewables for electricity generation. Blue hydrogen is becoming a more realistic option for some applications, and even green hydrogen is moving from a distant horizon to a possible future. The cost of electrolysis is declining, and new pilot projects are demonstrating the value of using hydrogen in more and more applications—and this is reflected in the project pipeline for green hydrogen ballooning five times year-over-year (YoY) in 2020.23

This unpredictability in the clean energy space resembles the dynamism typically seen in the technology industry. Deloitte’s text analytics on thousands of articles and points-of-view gives a directional sense of trending new energy business models and the market sentiment towards each. As is typical with modeling text analytics, more attention is often given to the newer technologies and fewer references made to established business models and investment areas.

So, which technology was most frequently mentioned within our sample over the last 2-3 years? Renewable power, which primarily includes solar and wind energy, had the highest share (47% among all green energy models) due to increasing economies of scale, competitive supply chains, and technological improvements (figure 6).24 However, a higher share of renewables might not directly translate into profitable growth due to fragmented and fierce competition in this space, which may not excite large O&G companies aiming to build a differentiated portfolio. The tide seems to also be turning for green hydrogen (share of 8%) whose costs are expected to drop by ~64% by 2040, supported by strong regulation and improving cost efficiencies.25 However, interest in more established gas-based opportunities, including gas-powered generation, LNG processing/retailing, and natural gas conversion, received fewer mentions in the analysis.26

Market sentiment appears most bullish on biofuels/renewable fuels, given their strong regulatory mandate and an accelerating shift toward biofuels/renewable fuels. Boeing, for example, has already announced delivery of airplanes capable of flying on 100% biofuel by the end of this decade.27 Carbon capture, utilization and storage (CCUS) had the second-most positive sentiment backed by stronger climate targets, investment incentives, and increasing investments—investments in projects has doubled to $27 billion since 2010.28 While stronger policy making and cost efficiencies likely supported the sentiment for electric vehicles, the massive drop in battery storage costs seem to be supporting the sentiment for energy storage. (Battery storage costs have dropped by a whopping 75% to $150/MWh since 2015).29

While one capability may emerge slightly ahead of the other, organizations would likely benefit from spreading the risk and choosing a combination of clean energy capabilities. On the basis of our text analytics over the past 2-3 years, renewables,mobility and storage,and green hydrogen emerged as the most frequently mentioned combination out of the new energies. Integrated O&G companies are strongly placed to maximize the value from such combined projects. An example is Shell’s effort to develop one of the largest offshore wind-to-green-hydrogen value chains to create a hydrogen hub while providing the demand pool from its own refinery with an aim to build a circular dependency model.30

Whether a company becomes an O&G specialist, a diversified international player, an integrated energy provider, or even a green company, it will have to establish its competitive position in the portfolio frontier grid (figure 3). After all, portfolio choices, along with the company’s operating style, will determine the company’s position in the new energy order.

Getting the transformation right

Getting the transformation right is not just about what business to be in but also how to effectively run it. Irrespective of the type of portfolio mix, there is an acute need to constantly scrutinize and upgrade the operating model—or be left behind. In finalizing a forward-looking portfolio strategy, companies will naturally face early onset of uncertainty. However, this might not be harmful as long as it is not followed by a confused strategy.

Traditionally, the O&G industry has relied on corporate (re)financing and restructuring to navigate changes, but these measures have limited scope in the energy transition. A new, robust portfolio would require new value drivers (i.e., metrics of success). So far, metrics such as reserves base and reserve replacement rate have driven the short-term and long-term valuations of companies with growing TSR being the singular focus of many. But organizations of the future will likely have to base their final investment decision on different value metrics, such as emissions abatement, as against only returns or resource size (figure 7). With sustainability-linked loan volumes rising by 30 times to $143 billion in last three years and the U.S. Securities and Exchange Commission creating a Climate and ESG Task Force to monitor ESG funds and investments, it is imperative that companies update value drivers.31

New value drivers could push for a revamp in the ways of working for companies. In line with the new portfolio and evolving value drivers, companies could have to develop a new set of capabilities, business models, and an agile operating model that can help them become nimble, innovate, and adapt to changing macro conditions.

Competencies

Although existing mega project management and R&D capabilities continue to remain core and may even provide a big leap to O&G companies in greener businesses, such as CCUS and hydrogen, leading in the new energy landscape could require new business and technological capabilities. Companies would have to develop dynamic portfolio optimization capabilities and display a startup mindset to compete with a growing number of mobile and modular business models. Dynamic planning, integrated workflows, and AI-based optimization for determining the financial impact of portfolio changes in real time without hindering agility will likely be the bare minimum competencies of the new future. Additionally, companies should not let go of core competencies including performance improvement, while adding new ones like renewables engineering, etc.

Business models

To succeed in the energy markets of the future, companies will likely have to embrace new business models according to their position in the portfolio frontiers grid (figure 3)Pure-play E&Ps, for instance, may need to build differentiating in-house capabilities for leaner operating models. While traditional business models still have a lot of value, succeeding in a digitally driven new energy businesses could require investing in and partnering with a range of companies across the value chain. These strategic alliances and joint business models would have to go beyond today’s capital and risk-sharing models. Collaborating to execute a shared vision (as against separation of roles between operator and non-operator) and creating a connected ecosystem would differentiate pioneers from fast followers. Occidental, for example, has invested in a technology-based environmental commodities platform and has created a new market for climate-differentiated crude oil.32 Additionally, Occidental is working with Carbon Finance Labs to develop a distributed ledger-based carbon accounting platform for tracking end-to-end carbon emissions through commodity supply chains.33

Contrary to conventional wisdom, the COVID-19 pandemic and the energy transition haven’t hindered transformation in the industry. In fact, by pushing companies to adopt low-carbon, highly efficient, and agile ways of working, they have unlocked the transformation. These trends are urging O&G organizations to examine their purpose and value drivers, and face the simple fundamental question of what business they should—and should not—be in. The coming decade may well bring a sea change for the industry and it will be interesting to see players surprising the market with their moves and even proving the market wrong by playing to their core strengths. In this complex and fast-paced environment, uncertainty in decision-making is acceptable, but confusion isn’t.

  1. Deloitte analysis based on data accessed from S&P Capital IQ.View in Article
  2. BP Energy Outlook, BP Energy Outlook 2020 , 2020 edition; Rystad Energy, “Covid-19 and energy transition will expedite peak oil demand to 2028 and cut level to 102 million bpd ,” press release, November 2, 2020; Shell, Shell Energy Transition Report 2020 , 2020.View in Article
  3. Deloitte analysis.View in Article
  4. Ibid.View in Article
  5. Deloitte analysis, Cimarex Energy Research from Bloomberg Intelligence.View in Article
  6. Andrew Slaughter et al., The portfolio predicament: How can upstream oil and gas companies build a fit-for-the-future portfolio? , Deloitte Insights, April 10, 2018.View in Article
  7. Deloitte analysis.View in Article
  8. BP Energy Outlook, BP Energy Outlook 2020 ; Rystad Energy, “Covid-19 and energy transition will expedite peak oil demand to 2028 and cut level to 102 million bpd ”; Shell, Shell Energy Transition Report 2020 .View in Article
  9. Rystad Energy; used average F&D costs of $8.5/boe in 2019.View in Article
  10. Deloitte analysis based on data accessed from Rystad Energy and S&P Capital IQ.View in Article
  11. MarketScreener, “Lundin Energy : Report for the six months ended 30 June 2020 (regulatory) ,” Lundin Energy AB (publ), accessed on dates.  View in Article
  12. Deloitte analysis, average ROCE of past 10 years of top O&G companies by revenue between 2010-2015.View in Article
  13. Deloitte analysis based on data accessed from S&P Capital IQ; Yahoo! Finance, “Blink Charging Co. (BLNK) ,” accessed on dates.View in Article
  14. US Energy Information Administration.View in Article
  15. Deloitte analysis.View in Article
  16. Vestigo, “Investigate, seek, explore ,” accessed on dates.View in Article
  17. Bojan Lepic, “Occidental delivers world-first carbon-neutral crude shipment ,” Offshore Energy, January 29, 2021.View in Article
  18. Bloomberg, “Singapore’s grab to list in U.S. in record $40 billion SPAC deal,”View in Article
  19. Deloitte analysis based on data accessed from Rystad Energy.View in Article
  20. Deloitte analysis.View in Article
  21. Ibid.View in Article
  22. Ibid.View in Article
  23. Wood Mackenzie, “Hydrogen production costs to 2040: Is a tipping point on the horizon?,” accessed on August 11, 2020.View in Article
  24. Deloitte analysis.View in Article
  25. Deloitte analysis.View in Article
  26. Deloitte analysis.View in Article
  27. Reuters, “Boeing says its fleet will be able to fly on 100% biofuel by 2030,” accessed on dates. View in Article
  28. IEA, “Energy and climate leaders from around the world pledge clean energy action at the IEA-COP26 Net Zero Summit ,” press release, March 31, 2021.View in Article
  29. Susan Tierney and Lori Bird, “Setting the record straight about renewable energy ,” World Resources Institute, May 12, 2020.View in Article
  30. John Parnell, “Shell’s latest offshore wind bid would power a huge green hydrogen cluster ,” Greentech media, May 7, 2020.View in Article
  31. Jacqueline Poh, “ESG-linked loan boom hit by pandemic push for short-term funds,” Bloomberg, October 20, 2020; U.S. Securities and Exchange Commission, “SEC announces enforcement task force focused on climate and ESG issues,” press release, March 4, 2021.
    View in Article
  32. World Oil, “Oxy teams with Macquarie to deliver world’s first carbon-neutral oil from Permian basin to India ,” February 1, 2021.View in Article
  33. Erik Kobayashi-Solomon, “Climate tech updates for February 2021 ,” Forbes , February 12, 2021.View in Article

The authors would like to thank Duane Dickson, Peter Buettgen, Gary Adams, Raghu Yabaluri, Tom Bonny from Deloitte Consulting LLP for their expert comments and inputs; John England and Charlie Sanchez from Deloitte & Touche LLP for their subject matter inputs; Aijaz Hussain and Thomas Shattuck from Deloitte Services LP for their contributions towards the development of this study.

The authors would also like to thank Alok Ranjan, Sandeep Vellanki, and Rohan Amrute from Deloitte SVCS India Pvt Ltd. for their data and statistical analytics support; Shreya Shirgaokar and Abhinav Purohit from Deloitte SVCS India Pvt Ltd. for their extensive research and analysis support; Kavita Saini from the Deloitte Insights team who supported the report’s editing and publication; Krystal McMiller, Sharene Williams, and Jennifer McHugh from Deloitte Services LLP for their operational and marketing support.

Cover image by: Eva Vázquez

Oil, Gas & Chemicals

Deloitte’s oil, gas, and chemicals professionals offer you the integrity, innovation, and insight to help you meet the most complex challenges. We support you in developing and executing initiatives that achieve your strategic objectives to deliver value to your stakeholders. Through audit and assurance, tax, consulting, and risk and financial advisory, our Deloitte oil, gas, and chemicals team provides comprehensive services and solutions to help move your business forward.

Amy Chronis

Amy Chronis

Senior Partner | Immediate Past Vice Chair, US Energy & Chemicals Leader and Houston Managing Partner | Deloitte LLP

Subscribe

to receive more business insights, analysis, and perspectives from Deloitte Insights