Viewing offline content

Limited functionality available

Dismiss
United States
  • Services

    What's New

    • Register for Dbriefs webcasts

    • Unlimited Reality™

      Metaverse solutions that drive value

    • Sustainability, Climate & Equity

      Cultivating a sustainable and prosperous future

    • Tax

      • Tax Operate
      • Tax Legislation
      • Tax Technology Consulting
      • Global Employer Services
      • Legal Business Services
      • Tax Services
    • Consulting

      • Core Business Operations
      • Customer & Marketing
      • Enterprise Technology & Performance
      • Human Capital
      • Strategy & Analytics
    • Audit & Assurance

      • Audit Innovation
      • Accounting Standards
      • Accounting Events & Transactions
    • Deloitte Private

    • M&A and Restructuring

    • Risk & Financial Advisory

      • Accounting & Internal Controls
      • Cyber & Strategic Risk
      • Regulatory & Legal
      • Transactions and M&A
    • AI & Analytics

    • Cloud

    • Diversity, Equity & Inclusion

  • Industries

    What's New

    • The Ripple Effect

      Real-world client stories of purpose and impact

    • Register for Dbriefs webcasts

    • Industry Outlooks

      Key opportunities, trends, and challenges

    • Consumer

      • Automotive
      • Consumer Products
      • Retail, Wholesale & Distribution
      • Transportation, Hospitality & Services
    • Energy, Resources & Industrials

      • Industrial Products & Construction
      • Power, Utilities & Renewables
      • Energy & Chemicals
      • Mining & Metals
    • Financial Services

      • Banking & Capital Markets
      • Insurance
      • Investment Management
      • Real Estate
    • Government & Public Services

      • Defense, Security & Justice
      • Federal health
      • Civil
      • State & Local
      • Higher Education
    • Life Sciences & Health Care

      • Health Care
      • Life Sciences
    • Technology, Media & Telecommunications

      • Technology
      • Telecommunications, Media & Entertainment
  • Insights

    Deloitte Insights

    What's New

    • Deloitte Insights Magazine

      Explore the latest issue now

    • Deloitte Insights app

      Go straight to smart with daily updates on your mobile device

    • Weekly economic update

      See what's happening this week and the impact on your business

    • Strategy

      • Business Strategy & Growth
      • Digital Transformation
      • Governance & Board
      • Innovation
      • Marketing & Sales
      • Private Enterprise
    • Economy & Society

      • Economy
      • Environmental, Social, & Governance
      • Health Equity
      • Trust
      • Mobility
    • Organization

      • Operations
      • Finance & Tax
      • Risk & Regulation
      • Supply Chain
      • Smart Manufacturing
    • People

      • Leadership
      • Talent & Work
      • Diversity, Equity, & Inclusion
    • Technology

      • Data & Analytics
      • Emerging Technologies
      • Technology Management
    • Industries

      • Consumer
      • Energy, Resources, & Industrials
      • Financial Services
      • Government & Public Services
      • Life Sciences & Health Care
      • Technology, Media, & Telecommunications
    • Spotlight

      • Deloitte Insights Magazine
      • Press Room Podcasts
      • Weekly Economic Update
      • COVID-19
      • Resilience
      • Top 10 reading guide
  • Careers

    What's New

    • Our Purpose

      Exceptional organizations are led by a purpose. At Deloitte, our purpose is to make an impact that matters by creating trust and confidence in a more equitable society.

    • Day in the Life: Our hybrid workplace model

      See how we connect, collaborate, and drive impact across various locations.

    • The Deloitte University Experience

      Explore Deloitte University like never before through a cinematic movie trailer and films of popular locations throughout Deloitte University.

    • Careers

      • Audit & Assurance
      • Consulting
      • Risk & Financial Advisory
      • Tax
      • Internal Services
      • US Delivery Center
    • Students

      • Undergraduate
      • Advanced Degree
      • Internships
    • Experienced Professionals

      • Additional Opportunities
      • Veterans
      • Industries
      • Executives
    • Job Search

      • Entry Level Jobs
      • Experienced Professional Jobs
      • Recruiting Tips
      • Explore Your Fit
      • Labor Condition Applications
    • Life at Deloitte

      • Life at Deloitte Blog
      • Meet Our People
      • Diversity, Equity, & Inclusion
      • Corporate Citizenship
      • Leadership Development
      • Empowered Well-Being
      • Deloitte University
    • Alumni Relations

      • Update Your Information
      • Events
      • Career Development Support
      • Marketplace Jobs Dashboard
      • Alumni Resources
  • US-EN Location: United States-English  
  • Contact us
  • US-EN Location: United States-English  
  • Contact us
    • Dashboard
    • Saved items
    • Content feed
    • Subscriptions
    • Profile/Interests
    • Account settings

Welcome back

Still not a member? Join My Deloitte

All in a day’s work—and sleep and play: How Americans spend their 24 hours

by
  • Save for later
  • Download
  • Share
    • Share on Facebook
    • Share on Twitter
    • Share on Linkedin
    • Share by email
Deloitte Insights
  • Strategy
    Strategy
    Strategy
    • Business Strategy & Growth
    • Digital Transformation
    • Governance & Board
    • Innovation
    • Marketing & Sales
    • Private Enterprise
  • Economy & Society
    Economy & Society
    Economy & Society
    • Economy
    • Environmental, Social, & Governance
    • Health Equity
    • Trust
    • Mobility
  • Organization
    Organization
    Organization
    • Operations
    • Finance & Tax
    • Risk & Regulation
    • Supply Chain
    • Smart Manufacturing
  • People
    People
    People
    • Leadership
    • Talent & Work
    • Diversity, Equity, & Inclusion
  • Technology
    Technology
    Technology
    • Data & Analytics
    • Emerging Technologies
    • Technology Management
  • Industries
    Industries
    Industries
    • Consumer
    • Energy, Resources, & Industrials
    • Financial Services
    • Government & Public Services
    • Life Sciences & Health Care
    • Tech, Media, & Telecom
  • Spotlight
    Spotlight
    Spotlight
    • Deloitte Insights Magazine
    • Press Room Podcasts
    • Weekly Economic Update
    • COVID-19
    • Resilience
    • Top 10 reading guide
    • US-EN Location: United States-English  
    • Contact us
      • Dashboard
      • Saved items
      • Content feed
      • Subscriptions
      • Profile/Interests
      • Account settings
    20 November 2018

    All in a day’s work—and sleep and play: How Americans spend their 24 hours Issues by the Numbers, November 2018

    20 November 2018
    • Save for later
    • Download
    • Share
      • Share on Facebook
      • Share on Twitter
      • Share on Linkedin
      • Share by email
    • Americans with jobs are working more
    • A few more minutes of snooze time
    • More time in front of the TV
    • Less sports, exercise, and recreation
    • Caring for household members: Time up, participation down
    • Food, glorious food
    • What can we do with this data?

    ​How do Americans spend their 24 hours each day? Data from the American Time Use Survey illuminates what Americans tend to do with their time, offering valuable insights to policymakers, economists, and businesses.

    How much sleep does the average American get each day? How much time do Americans typically spend at work and at play—and when at play, what do they do? Intrusive as these questions might seem, it’s not just nosiness that makes people ask them. Knowing what people do with their time can offer valuable insights to policymakers seeking to improve public health, economists trying to understand labor market trends, and businesses working to better attract and serve customers. Consumer goods and services companies, in particular, may benefit from understanding how Americans tend to allocate their time each day, as this can inform their sales and advertising strategies and help them identify macro marketplace trends.1

    Fortunately for those of us eager to know, the American Time Use Survey (ATUS) by the Bureau of Labor Statistics (BLS) can give us a window into Americans’ typical daily activities.2 The survey, inaugurated in 2003, tracks various activities—including work, travel, leisure, and sleep—among a representative sample of Americans each year.

    Learn More

    View the related infographic

    Subscribe to receive economics content from Deloitte Insights

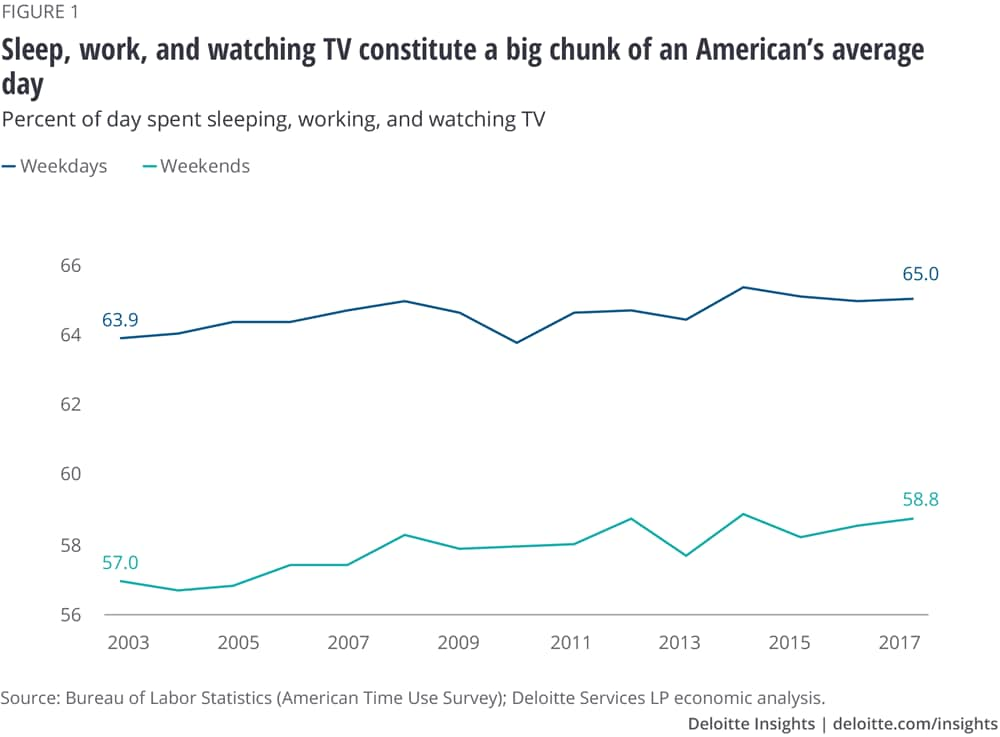
    So how do Americans spend their daily 24 hours? Broadly speaking, and unsurprisingly, they spend the bulk of each weekday doing one of three things: working, sleeping, or watching TV.3 In fact, taken together, the proportion of each weekday consumed by these three activities has gone up between 2003 and 2017 (figure 1).

    Of course, one doesn’t need a research study to figure out that Americans spend a lot of time sleeping, working, and watching TV. The beauty of the ATUS data, however, is in its details. When one drills down into the different components of each major activity, studying trends over time, and comparing the findings across age groups, the data reveals several interesting trends.

    Sleep, work, and watching TV make up a big chunk of an average American's day

    Americans with jobs are working more

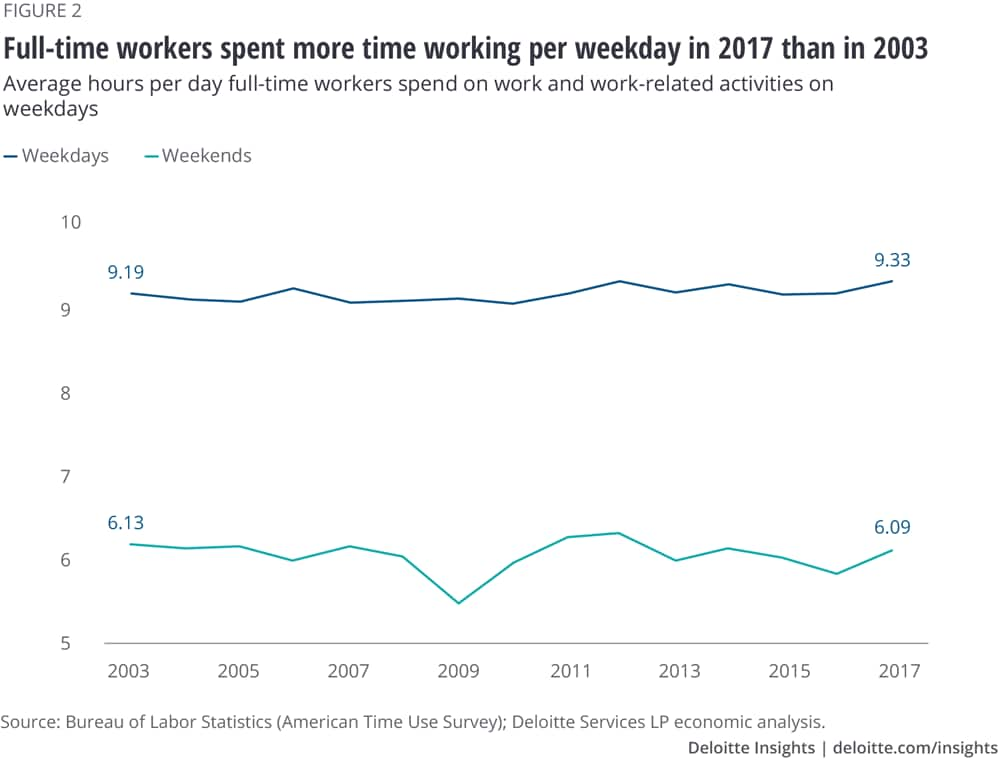
    Americans with jobs—both part-time and full-time—are spending more time at work and on work-related activities4 today than they did in 2003. In 2017, Americans who were engaged in full-time5 paid work put in a little more than 9.3 hours of work and work-related activities on an average weekday,6 about 8.4 minutes more per weekday than in 2003. Part-time workers, too, spent more time working on an average weekday in 2017 than in 2003, although this amount has fluctuated greatly from year to year.

    Interestingly, among full-time working Americans, the average time spent on work and work-related activities on weekends decreased sharply in 2009—by about 32 minutes per day (figure 2). Although this has trended up since then, full-time workers are still putting in less work per day on weekends than they did in 2003.

    Full-time workers spent more time working per weekday in 2017 than in 2003

    Full-time workers who commute or otherwise travel for work spent an average of 52.2 minutes each weekday doing so in 2017; this is 5.4 minutes per day more than in 2016, although this statistic did not change much between 2003 and 2016. Weekend work-related travel went up by just 36 seconds per day between 2003 and 2017. More interestingly, the percentage of full-time workers engaged in travel related to work on weekdays decreased from 80.9 percent in 2003 to 77.5 percent in 2017. This finding seems surprising, considering that the percentage of full-time workers who actually worked on an average weekday went up between 2003 and 2017 by a full percentage point. It is likely that technologies such as video conferencing and innovations in talent policies such as work-from-home arrangements (again enabled by technology) are reducing the need for travel related to work.7

    Not surprisingly, people who were classified as “not employed” spent a little less than an hour per week on paid work and work-related activities. On the other hand, they slept longer (+6.3 hours), watched more TV (+12.6 hours), and spent more time on educational activities (+5.6 hours) per week than Americans who were employed full-time. It is worth noting that most of the people who the ATUS classifies as “not employed” are probably either young people (such as those aged 15–24 years) or older people (aged 65 or more). Although the ATUS data does not support a split of this variable by age, other evidence exists that suggests that the younger people in this group likely engaged more in educational activities than the older ones,8 who may be spending more time in front of the TV.

    EXPLORE THE INFOGRAPHIC

    How do Americans spend their time? Highlights from the American Time Use Survey

    A few more minutes of snooze time

    The average American slept for 8.5 hours on a typical weekday in 2017. That’s up from 8.3 hours per typical weekday in 2003. On weekends, too, Americans are sleeping more than they did in 2003 (figure 3). As a result, average weekly sleep time has gone up by 100 minutes.

    Americans are sleeping more each day, on average, than in 2003

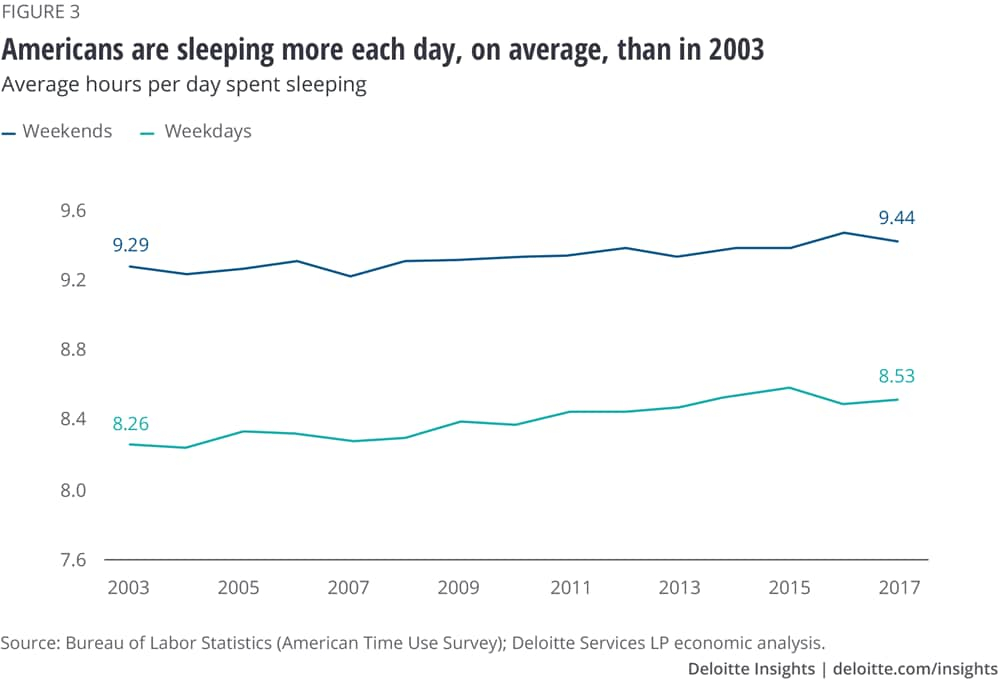
    Who’s getting all this extra sleep? On a minutes-per-day basis, it’s mostly younger people: 15–24-year-olds got 38 minutes more sleep per weekday in 2017 compared to 2003, and 25–54-year-olds got 16.8 minutes more sleep per weekday. Older people, on the other hand, barely increased their sleep time between 2003 and 2017. Fifty-five–64-year-olds slept 1.8 minutes more per weekday in 2017 than in 2003, and those aged 65 or more only increased their sleep time by just over half a minute. However, because the percentage of older people in the total US population has been increasing over the years,9 the two older cohorts actually contributed more than their younger counterparts to the overall national increase in weekday sleep time—even though they aren’t sleeping many minutes more than in 2003.

    With Americans sleeping more, is sleep deprivation, which the Centers for Disease Control and Prevention (CDC) described as a “public health epidemic” in 2014, still a concern?10 It’s hard to tell from the ATUS data, but it seems probable that a large share of Americans may still not be getting adequate sleep, thereby continuing to risk poorer health and decreased productivity at work.11 Three factors make this likely. First, the ATUS data on sleeping does not reflect the true extent of sleep time, as it also includes naps and spells of sleeplessness.12 Moreover, although the national average of 8.5 hours of sleep per weekday is higher than the lower limit of seven hours per night that the American Academy of Sleep Medicine (AASM) recommends for adults,13 it is unlikely that every American sleeps for 8.5 hours a night on a regular basis. Indeed, the CDC believes that more than a third of American adults are not getting enough sleep.14 For young adults and individuals recovering from sleeplessness or illness, even 8.5 hours per day may not be enough; experts recommend more than nine hours of sleep for such individuals.15 Finally, full-time workers may be worse off than the average of 8.5 hours per weekday suggests, as the ATUS data reveals that those who were employed full-time slept 34 minutes less than the national average on weekdays in 2017.

    More time in front of the TV

    The time Americans spend on leisure and sports16 on an average day has been on a gentle upward trend since 2003, with this trend more distinct for weekends than for weekdays. However, it’s unclear whether this is good news from a health perspective. Why? Because more than half of the time recorded in the “leisure and sports” category is spent watching TV—an activity that has consumed more and more time over the years (figure 4).17

    Americans, on average, are now watching more TV than in 2003

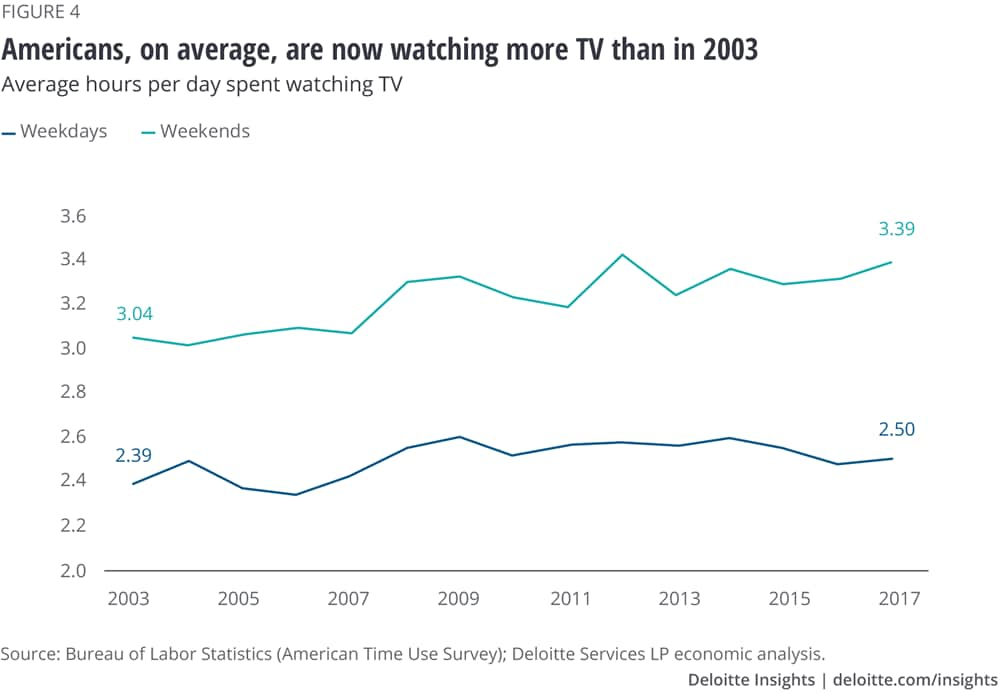
    That Americans, on average, are watching more TV doesn’t necessarily mean that more people are doing so now than in 2003. In fact, the percentage of people who watched any TV at all on an average weekday fell from 78.4 percent in 2003 to 76.2 percent in 2017. That said, the percentage of people who watched any TV on weekends went up from 79.7 percent to 81.2 percent during the same period. What really explains the rise in average daily TV-watching time is that those who watched TV are spending more time per day doing so, whether on a weekday or over the weekend.

    Older Americans are more likely to indulge in TV than younger ones; the proportion of younger individuals who watched TV declined on weekdays and was relatively flat over weekends from 2003 to 2017. This may not be good news for older Americans, especially 55–64-year-old workers: After spending longer hours at work on weekdays, getting some exercise would seem better for their health than more screen time.18

    Less sports, exercise, and recreation

    The time Americans spend on sports, exercise, and recreation—another component of ATUS’s “leisure and sports” category—has remained relatively flat between 2003 and 2017. Two opposing trends, one offsetting the other, are at work here. On the one hand, a greater proportion of people are participating in some form of sports, exercise, and recreation on both weekdays and weekends. To cut the data by age, the proportion of 15–24-year-olds, 25–54-year-olds, and those aged 65+ years engaging in these activities has increased—albeit to different degrees—from 2003 to 2017 (figure 5). However, across all age groups, those who participated in such activities spent less time on them in 2017 than in 2003—except for the 65+ group, who averaged a 7.2 minutes more of sports, exercise, and recreation on a typical weekday.

    15–24-year-olds are leading the way in participating in sports, exercise, and recreation

    One worrisome trend is that the proportion of 55–64-year-olds participating in sports, exercise, and recreation on a typical weekday dropped from 2003 to 2017. Besides, those in this age group who engage in such activities are spending 13.8 minutes less on them in 2017 than in 2003. Again, this is a trend that may not be conducive to this age group’s overall health and well-being.

    Caring for household members: Time up, participation down

    The proportion of Americans who care for and help household members is decreasing—down by about 2.9 percentage points per day for weekdays and 1.1 percentage points for weekends from 2003 to 2017, although the proportion of people caring for adults within the household has gone up slightly since 2011. The proportion of those who care for children is also on a broad decline. Among those who do care for and help household members, however, the time they spend on these activities has increased—both on weekdays and weekends (figure 6).

    Those who aid fellow household members are spending more time doing so

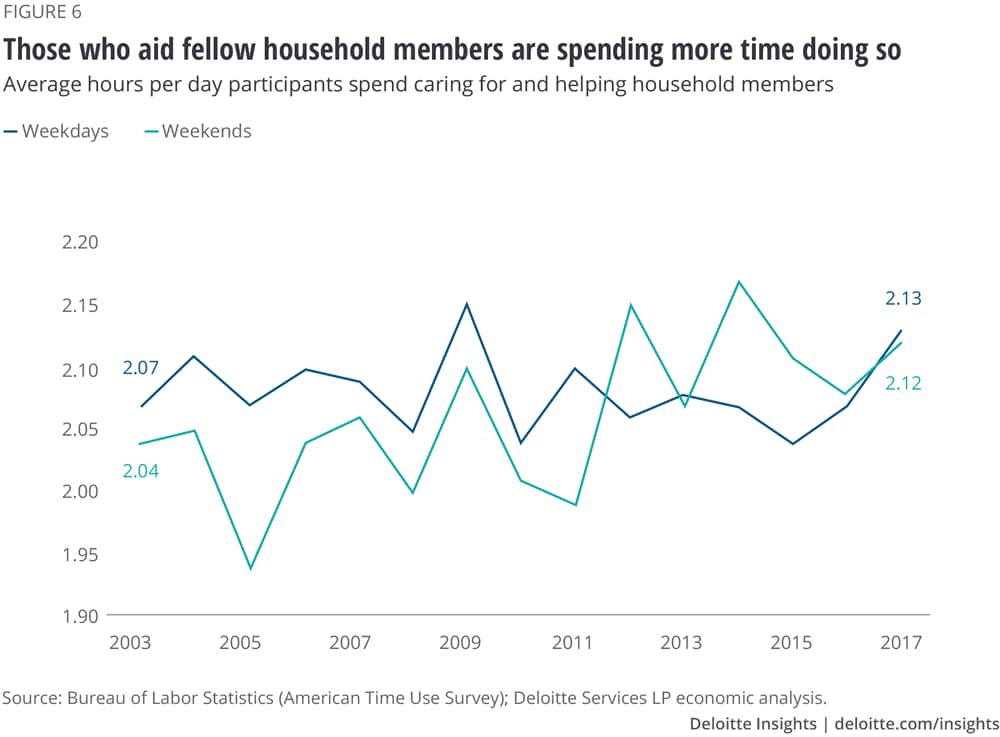
    Three factors may be contributing to these trends. First, the falling birthrate—12.2 births per 1,000 people in 2016 compared to 14.1 in 200319—means that fewer households are having children and, hence, participating in child care. Second, the concepts of working from home and work/life balance are increasing in vogue; this may be helping working people to spend more time with their family. Finally, as America ages, the need for elder care is going up.

    Food, glorious food

    In 2017, 75.6 percent of Americans performed some kind of household activity, such as housework, food preparation and cleanup, and lawn and garden care, on a typical weekday. This proportion is slightly higher than it was in 2003. Weekend participation in household activities has also increased since 2003. The amount of time these participants spend on household activities every day, however, has remained mostly constant.

    At a more granular level, the trend for food preparation and cleanup is notable. A greater proportion of Americans engaged in food preparation and cleanup in 2017 than in 2003 (figure 7). Although they spent roughly the same amount of time on this activity in 2017 than in 2013, the growth in the percentage of people who engage in food preparation and cleanup has pushed up the average time spent on this activity by about 27 minutes per week.

    A greater proportion of Americans are engaging in food preparation and cleanup

    Does the increase in the average time they spend preparing food and cleaning up afterward mean that more Americans are eating at home and spending less on food outside? Not really. According to the Survey of Consumer Expenditure (SCE), average consumer expenditures for food at home grew more slowly between 2003 and 2017 (2.4 percent per year, on average) than spending on food away from home (3.0 percent).20 That said, much of the steep rise in spending on food away from home happened after 2013—a period where the increase in time spent (on average) on food preparation and cleanup has been more muted. It is likely that, with the economy strengthening since 2013,21 people are now more willing to spend money to eat out than they were just after the Great Recession.

    Somewhat counterintuitively, the proportion of Americans traveling to eat and drink shows a slight downward trend, which likely reflects the rising use of food delivery services.22 A similar trend emerges for travel related to purchases of goods and services (figure 8). Technology is likely a key factor behind both of these trends: With food delivery services readily available through the internet, and with e-commerce’s share of total retail sales continuing to grow,23 many people may find it more convenient to have food and other purchases delivered to their doorstep than to venture out to buy them.24

    The percentage of Americans traveling to purchase goods and services has fallen

    What can we do with this data?

    The ATUS data offers insights that can be useful to businesses and policymakers. They may, for example, find it worth considering ways to increase well-being and work/life balance among American workers, given that they are putting in more time at work now than they used to. If technology-enabled concepts such as remote work are proving successful—for both workers’ well-being and their productivity—they could be more broadly adopted. Workers commuting long hours and those with a family to care for back home may relish such moves.

    The concept of well-being is closely related to sleep. While Americans are sleeping more on average, according to the ATUS data, it is unclear whether they are doing so regularly. More research may be needed in this area to inform efforts among businesses, policymakers, health professionals, and individuals themselves to promote more and better sleep.

    Another area of concern is the decline in time spent on sports, exercise, and recreation since 2003, despite the rise in the percentage of people engaging in such activities. Solutions such as shorter workout programs and healthier diets may be the answer for those Americans who struggle to make time for physical activity.25

    Knowing how people spend their time can help businesses understand their target customers and push appropriate products and services out through the right platforms. (Data on secondary activities such as using social media, watching live streaming, or talking on the phone while traveling—activities that the ATUS does not track—would help even more.)26 Businesses can also turn to time-use data to identify changes in consumer preferences. For example, with fewer people attending sports and recreation events than in the past, the sports industry is being forced to innovate to induce fans to come back to the stadium rather than watch the events on TV.27

    To understand the way people spend their time is an important part of any solution to improve lives or to create or widen markets. In the process, if Americans can save a few extra minutes in a day or an odd hour in a week for themselves, friends, or family, they will likely be happier. After all, who doesn’t value time?

    Authors

    Akrur Barua is an economist and executive manager with Deloitte Services LP. He is based in Mumbai.
    Lester Gunnion is an economist and senior analyst with Deloitte Services LP. He is based in Hyderabad.

    Acknowledgments

    Cover image by: Jose Luis Merino

    Endnotes
      1. Mary Joyce and Jay Stewart, “Why collect time-use data?,” Bureau of Labor Statistics, accessed October 31, 2018. View in article

      2. United States Bureau of Labor Statistics, “American Time Use Survey (ATUS),” accessed October 31, 2018. The data shows how an individual, on average, spends his or her time per day on weekdays and weekends. It also shows the share of people taking part in different activities and how much time they spend on each activity. The data is further sub-divided by age groups and sex. Unless stated otherwise, all data is taken from ATUS. View in article

      3. According to ATUS, “watching TV” refers to any time people said their main activity involved watching TV, videos, or movies. This includes the time they spent watching live programming, viewing DVDs, and streaming shows on their TV sets, computers, and portable devices. It does not include time spent viewing movies at a theater. Also see, Rachel Krantz-Kent, “Television, capturing America's attention at prime time and beyond,” Beyond the Numbers: Special Studies and Research 7, no. 14 (2018). View in article

      4. According to the American Time Use Survey user’s guide, work and work-related activities include “time spent working, doing activities as part of one’s job, engaging in income-generating activities not as part of one’s job, and job search activities.” “Working” includes time spent doing the specific tasks required for one’s main or other job, regardless of location or time of day. “Work-related activities” include activities that are not obviously work but are done as part of one’s job, such as having a business lunch or playing golf with clients. “Working” accounts for 90 percent of the time spent in this category. For more details, see US Bureau of Labor Statistics, American Time Use Survey user’s guide, June 2018. View in article

      5. ATUS defines full-time workers as those working 35 or more hours per week at all jobs combined; part-time workers are those putting in 35 hours or less per week at all jobs combined. View in article

      6. For workers, both full-time and part-time, the analysis in this paper focuses on weekdays and weekends separately. That is because not all the people who participated in paid full-time (or part-time) work and work-related activities on a weekday also participated over the weekend—for instance, according to the ATUS data, the percentage of full-time workers who participated in work and work-related activities on a weekday (89.2 percent of full-time workers in 2017) is different from the one for the weekend (33.8 percent of full-time workers in 2017). So, computing the average for the week as a whole is not possible. View in article

      7. Annamarie Mann and Amy Adkins, “America’s coming workplace: Home alone,” Gallup, March 15, 2017. View in article

      8. Bureau of Labor Statistics, “Employed workers leaving the labor force: An analysis of recent trends,” Monthly Labor Review, May 2017. View in article

      9. United States Census Bureau, “American Community Survey,” sourced through Haver Analytics on September 28, 2018. View in article

      10. Ginger Pinholster, “Sleep deprivation described as a serious public health problem,” American Association for the Advancement of Science, March 14, 2014. View in article

      11. Patrick K. Skerrett, “Sleep deprivation’s true workplace costs,” Harvard Business Review, January 12, 2011. View in article

      12. According to ATUS data, time spent sleeping also includes time spent on naps and spells of sleeplessness. View in article

      13. Watson F. Nathaniel et al., “Recommended amount of sleep for a healthy adult: A joint consensus statement of the American Academy of Sleep Medicine and Sleep Research Society,” Journal of Clinical Sleep Medicine 11, no. 6 (2015); American Academy of Sleep Medicine, “Seven or more hours of sleep per night: A health necessity for adults,” press release, June 1, 2015. View in article

      14. Centers for Diseases Control and Prevention, “1 in 3 adults don’t get enough sleep,” press release, February 16, 2016. View in article

      15. Nathaniel et al., “Recommended amount of sleep for a healthy adult;” American Academy of Sleep Medicine, “Seven or more hours of sleep per night.” View in article

      16. The “leisure and sports” activity category is divided into “socializing, relaxing, and leisure” and “sports, exercise, and recreation.” According to the American Time Use Survey user’s guide, “socializing, relaxing, and leisure” includes face-to-face social communication and hosting or attending social functions. Time spent communicating with others via telephone calls, texting, mail, or email is not part of this category. Leisure activities include watching television; reading; relaxing or thinking; playing computer, board, or card games; using a computer or the internet for personal interest; playing or listening to music; and other activities such as attending arts, cultural, and entertainment events. “Sports, exercise, and recreation” includes participating in—as well as attending or watching—sports, exercise, and recreational activities, whether team or individual and competitive or noncompetitive. Recreational activities include yard games such as croquet or horseshoes, as well as activities such as billiards and dancing. For more details, see US Bureau of Labor Statistics, American Time Use Survey user’s guide. View in article

      17. Krantz-Kent, “Television, capturing America's attention at prime time and beyond.” View in article

      18. Loretta DiPietro et al. “The joint associations of sedentary time and physical activity with mobility disability in older people: The NIHAARP diet and health study,” The Journals of Gerontology: Series A, Biological Sciences and Medical Sciences 73, no. 4 (2017): DOI: 10.1093/gerona/glx122. View in article

      19. Center for Diseases Control and Prevention, “National vital statistics reports,” sourced through Haver Analytics on September 27, 2018. View in article

      20. Bureau of Labor Statistics, “Survey of consumer expenditure,” sourced from Haver Analytics on September 29, 2018. View in article

      21. Dr. Daniel Bachman and Dr. Rumki Majumdar, United States economic forecast: 3rd quarter 2018, Deloitte Insights, September 14, 2018; Haver Analytics, October 1, 2018. View in article

      22. Traveling—nearly all time spent traveling is classified here. When a respondent reports doing another activity while traveling—for example, eating breakfast while riding the bus to work—the travel activity is recorded as the main activity. Walking and biking are considered traveling when they are used to get from one destination (an address or a building) to another, but not when the primary purpose is exercise. Travel done as an essential part of one’s job—for example, driving a taxi—is recorded as work, not travel. The American Time Use Survey user’s guide classifies travel activities depending upon the activities that immediately follow and precede them. For more details, see US Bureau of Labor Statistics, American Time Use Survey user’s guide. View in article

      23. From 2003 to 2017, e-commerce’s share of total retail sales grew from 1.6 percent to 7.8 percent. United States Census Bureau, “Monthly retail trade report and quarterly e-commerce report,” sourced from Haver Analytics on September 30, 2018. View in article

      24. Andria Cheng, “Americans’ appetite for delivered food has grown way beyond pizza and Chinese,” Forbes, June 26, 2018; United States Census Bureau, “Monthly retail trade report and quarterly e-commerce report,” sourced from Haver Analytics on September 30, 2018. View in article

      25. Gretchen Reynolds, “In a hurry? Try express weight training,” New York Times, September 12, 2018; Malia Wollan, “Failure to lunch: The lamentable rise of desktop dining,” New York Times Magazine, February 25, 2016; Natasha Bach, “Free office food is as bad as you think,” Fortune, June 13, 2018. View in article

      26. Kasey Lobaugh, Jeff Simpson, and Lokesh Ohri, Navigating the new digital divide: Capitalizing on digital influence in retail, Deloitte Digital, May 13, 2015. View in article

      27. Pete Giorgio, Lokesh Ohri, and Kenneth Marzin, A whole new ball game: Navigating digital change in the sports industry, Deloitte, 2018. View in article

    Show moreShow less

    Topics in this article

    Issues by the Numbers , United States (U.S.)

    Deloitte’s Global Economist Network

    The Deloitte Global Economist Network is a diverse group of economists that produce relevant, interesting and thought-provoking content for external and internal audiences. The Network’s industry and economics expertise allows us to bring sophisticated analysis to complex industry-based questions. Publications range from in-depth reports and thought leadership examining critical issues to executive briefs aimed at keeping Deloitte’s top management and partners abreast of topical issues.

    Learn more
    Get in touch
    Contact
    • Patricia Buckley
    • Director
    • Deloitte Services LP
    • pabuckley@deloitte.com
    • +1 571 814 6508

    Download Subscribe

    Related content

    img Trending

    Global Weekly Economic Update

    Article 2 weeks ago
    img Trending

    Will they, or won’t they return? Addressing the postpandemic labor force deficit

    Article 1 year ago
    img Trending

    United States Economic Forecast Q1 2023

    Article 1 week ago
    img Trending

    Economics: Europe, the Middle East, Africa (EMEA)

    Collection

    Explore Issues by the Numbers

    • Are we headed for a poorer United States? Article5 years ago
    • No college, no problem? Article5 years ago
    • Income inequality in the United States Article5 years ago
    • The aging water infrastructure Article7 years ago
    • A new understanding of Millennials Article7 years ago

    Share article highlights

    See something interesting? Simply select text and choose how to share it:

    Email a customized link that shows your highlighted text.
    Copy a customized link that shows your highlighted text.
    Copy your highlighted text.

    All in a day’s work—and sleep and play: How Americans spend their 24 hours has been saved

    All in a day’s work—and sleep and play: How Americans spend their 24 hours has been removed

    An Article Titled All in a day’s work—and sleep and play: How Americans spend their 24 hours already exists in Saved items

    Invalid special characters found 
    Forgot password

    To stay logged in, change your functional cookie settings.

    OR

    Social login not available on Microsoft Edge browser at this time.

    Connect Accounts

    Connect your social accounts

    This is the first time you have logged in with a social network.

    You have previously logged in with a different account. To link your accounts, please re-authenticate.

    Log in with an existing social network:

    To connect with your existing account, please enter your password:

    OR

    Log in with an existing site account:

    To connect with your existing account, please enter your password:

    Forgot password

    Subscribe

    to receive more business insights, analysis, and perspectives from Deloitte Insights
    ✓ Link copied to clipboard
    • Contact us
    • Search jobs
    • Submit RFP
    • Subscribe to Deloitte Insights
    Follow Deloitte Insights:
    Global office directory US office locations
    US-EN Location: United States-English  
    About Deloitte
    • About Deloitte
    • Client stories
    • My Deloitte
    • Deloitte Insights
    • Email subscriptions
    • Press releases
    • Submit RFP
    • US office locations
    • Alumni
    • Global office directory
    • Newsroom
    • Dbriefs webcasts
    • Contact us
    Services
    • Tax
    • Consulting
    • Audit & Assurance
    • Deloitte Private
    • M&A and Restructuring
    • Risk & Financial Advisory
    • AI & Analytics
    • Cloud
    • Diversity, Equity & Inclusion
    Industries
    • Consumer
    • Energy, Resources & Industrials
    • Financial Services
    • Government & Public Services
    • Life Sciences & Health Care
    • Technology, Media & Telecommunications
    Careers
    • Careers
    • Students
    • Experienced Professionals
    • Job Search
    • Life at Deloitte
    • Alumni Relations
    • About Deloitte
    • Terms of Use
    • Privacy
    • Privacy Shield
    • Cookies
    • Cookie Settings
    • Legal Information for Job Seekers
    • Labor Condition Applications
    • Do Not Sell or Share My Personal Information

    © 2023. See Terms of Use for more information.

    Deloitte refers to one or more of Deloitte Touche Tohmatsu Limited, a UK private company limited by guarantee ("DTTL"), its network of member firms, and their related entities. DTTL and each of its member firms are legally separate and independent entities. DTTL (also referred to as "Deloitte Global") does not provide services to clients. In the United States, Deloitte refers to one or more of the US member firms of DTTL, their related entities that operate using the "Deloitte" name in the United States and their respective affiliates. Certain services may not be available to attest clients under the rules and regulations of public accounting. Please see www.deloitte.com/about to learn more about our global network of member firms.

    Learn more about Deloitte's work for the US Olympic Committee