Changing the lens: GDP from the industry viewpoint Economics Spotlight, July 2019
5 minute read
25 July 2019
With the US economy enjoying the longest sustained expansion in its history, it may be worthwhile to understand which industries are contributing the most to GDP and driving the recovery—and who are demanding these industries’ output.
The current economic recovery turned 10 years this June, marking the longest sustained expansion in US history. While this calls for celebrations, it might be interesting to know what industries propelled the economy to a slow, but steady recovery.
Learn more
Explore the Economics Spotlight collection
Subscribe to receive related content
Download the Deloitte Insights and Dow Jones app
We are most familiar with GDP as the sum of sources of expenditure (consumption, investment, government, and net exports). But the US Bureau of Economic Analysis (BEA) provides data on the contribution of different industries to GDP. The data helps identify the sectors that have been responsible for the economy’s resilience as well as provides insights about who drives output from these industries.
The drivers of GDP
In order to identify the key industries of the economy, we analyze three aspects: each industry’s share in GDP, their respective growth, and the contribution of their growth to overall GDP growth. In addition, we use input-output accounts to show how the total output of these identified key industries is distributed to all other industries as inputs, and/or used for final demand (measured by GDP components).
Industry’s share in total GDP
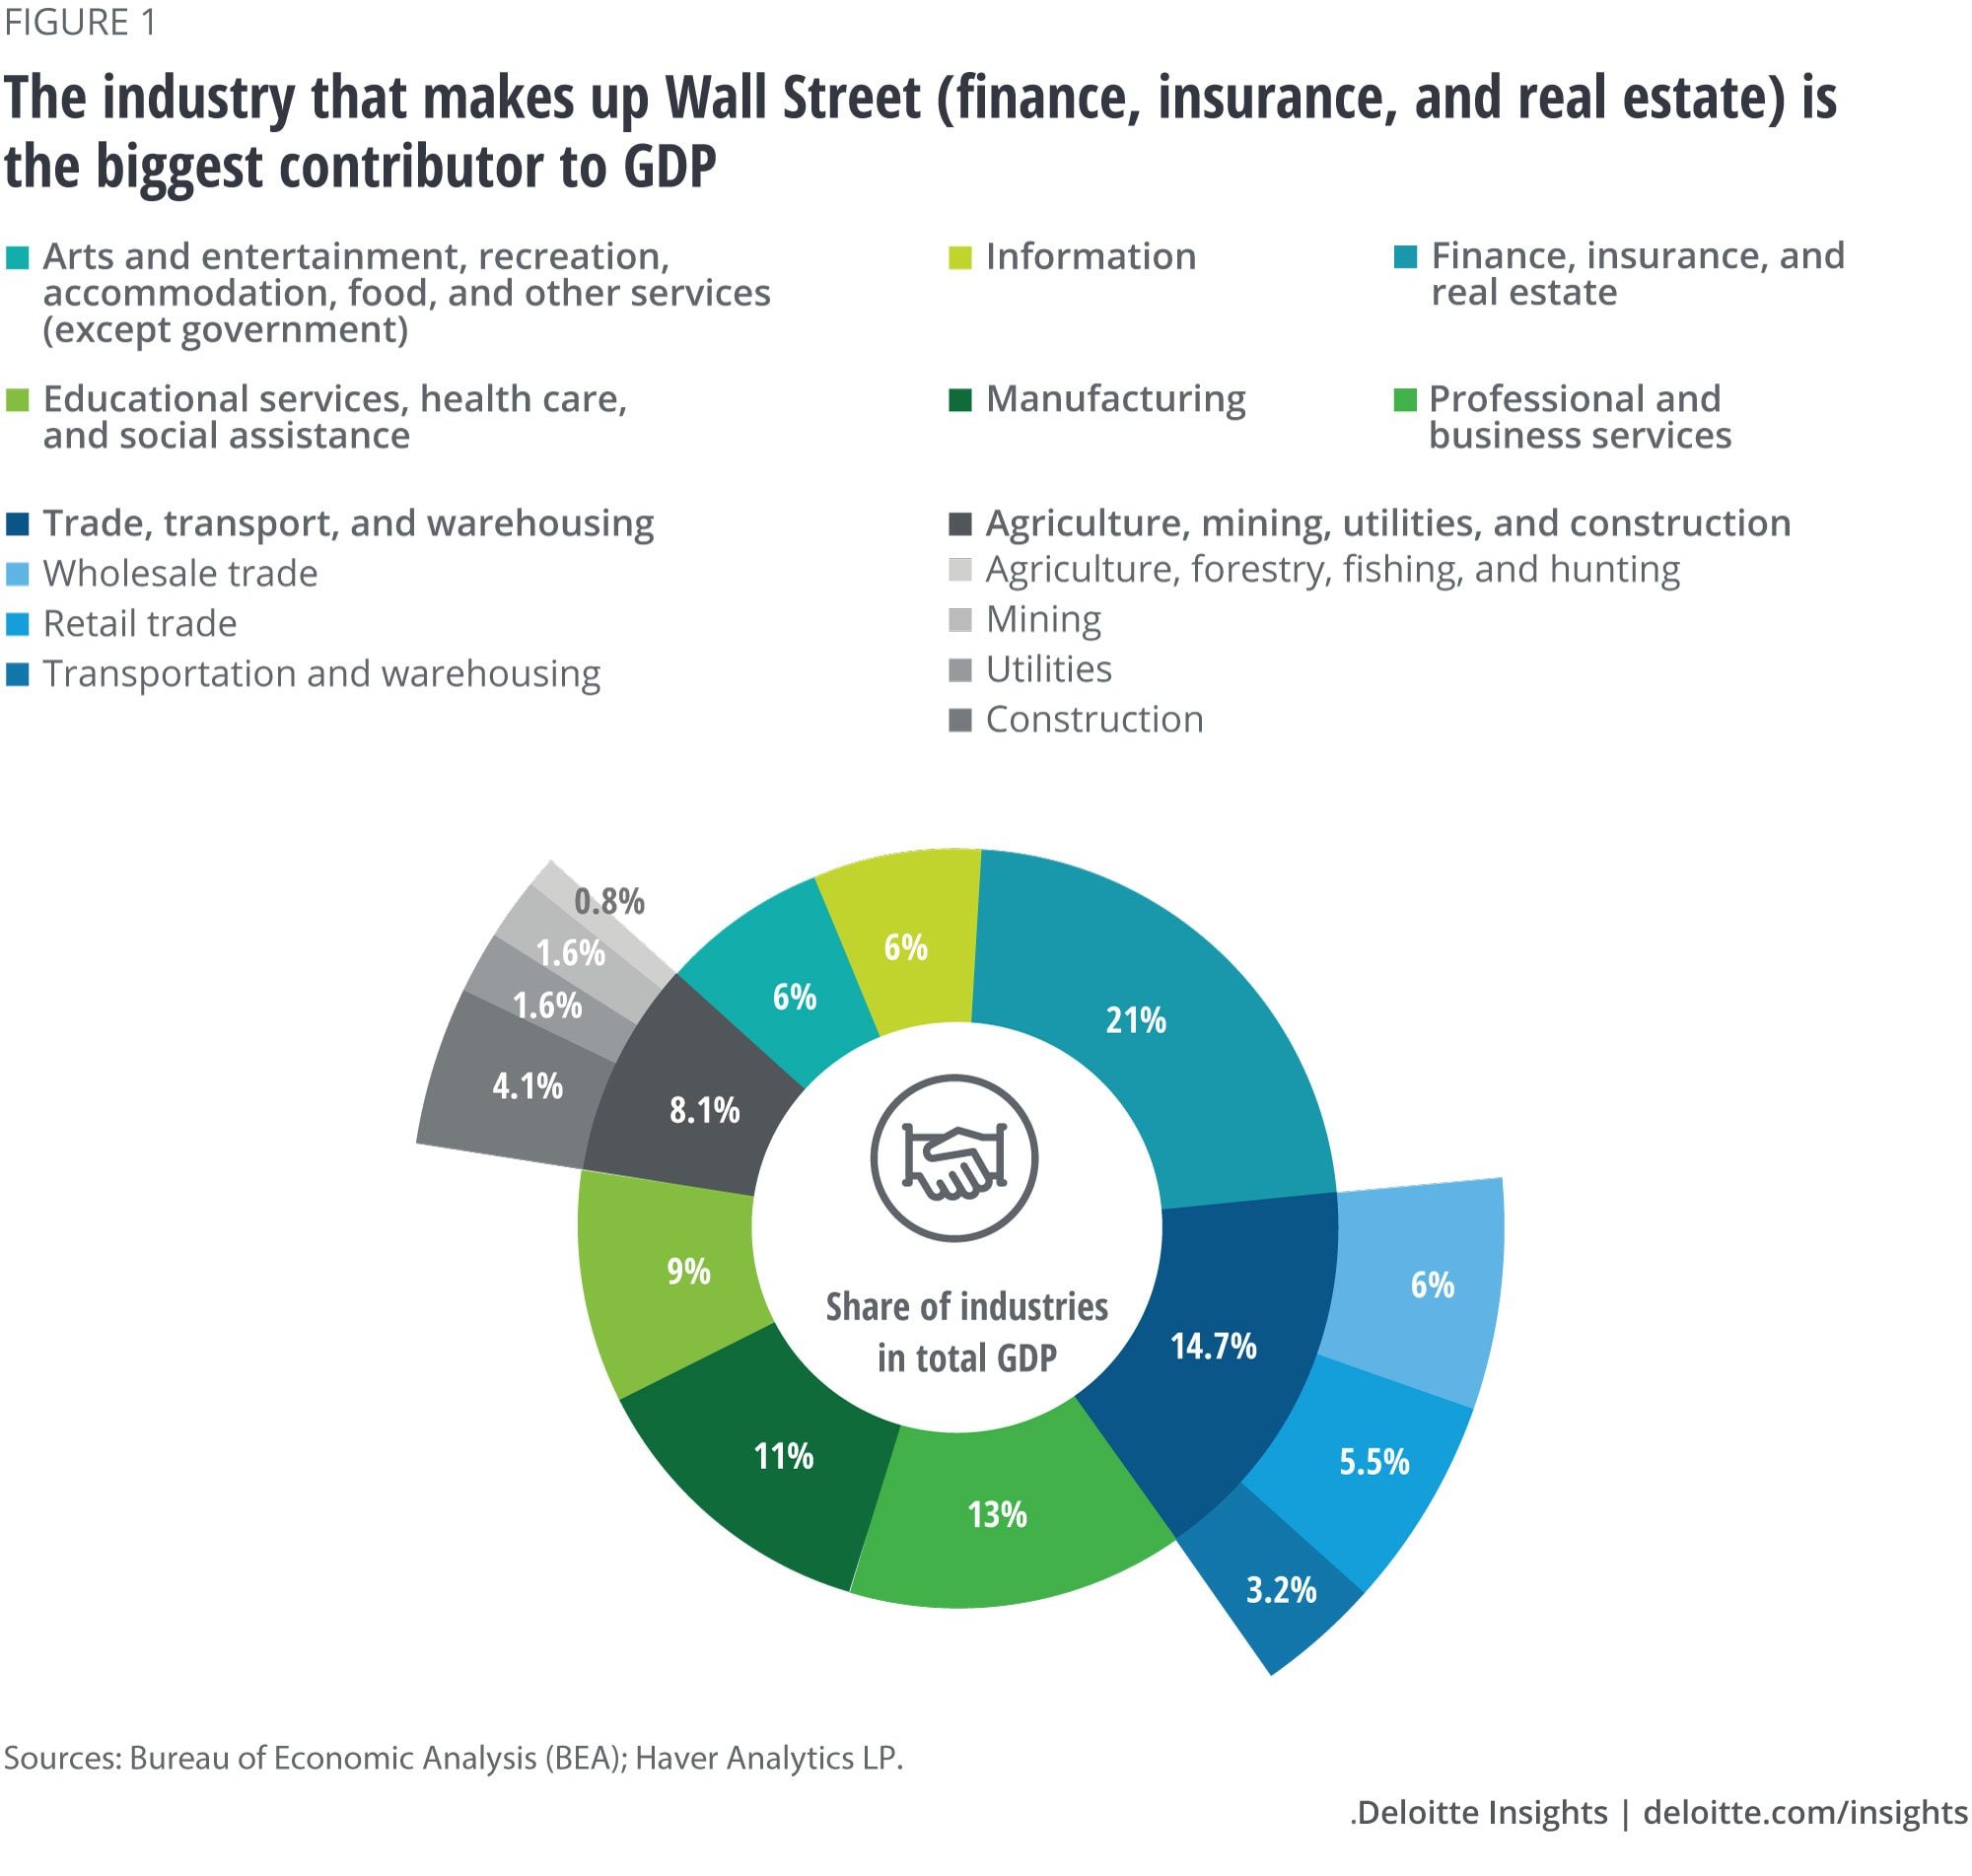
The economy is divided into three broad categories—agriculture (which includes broader activities such as mining, utilities, and construction), manufacturing, and services (figure 1). Services has been, by far, the biggest contributor to GDP, accounting for over 68 percent in 2018 (figure 1). Within services, the industry that makes up Wall Street—finance, insurance, and real estate—alone accounted for a fifth of the total economy, making it the largest industry by contribution to GDP. On the other hand, manufacturing’s share to GDP was 11 percent, while agriculture, mining, utilities, and construction accounted for 8.1 percent of GDP.

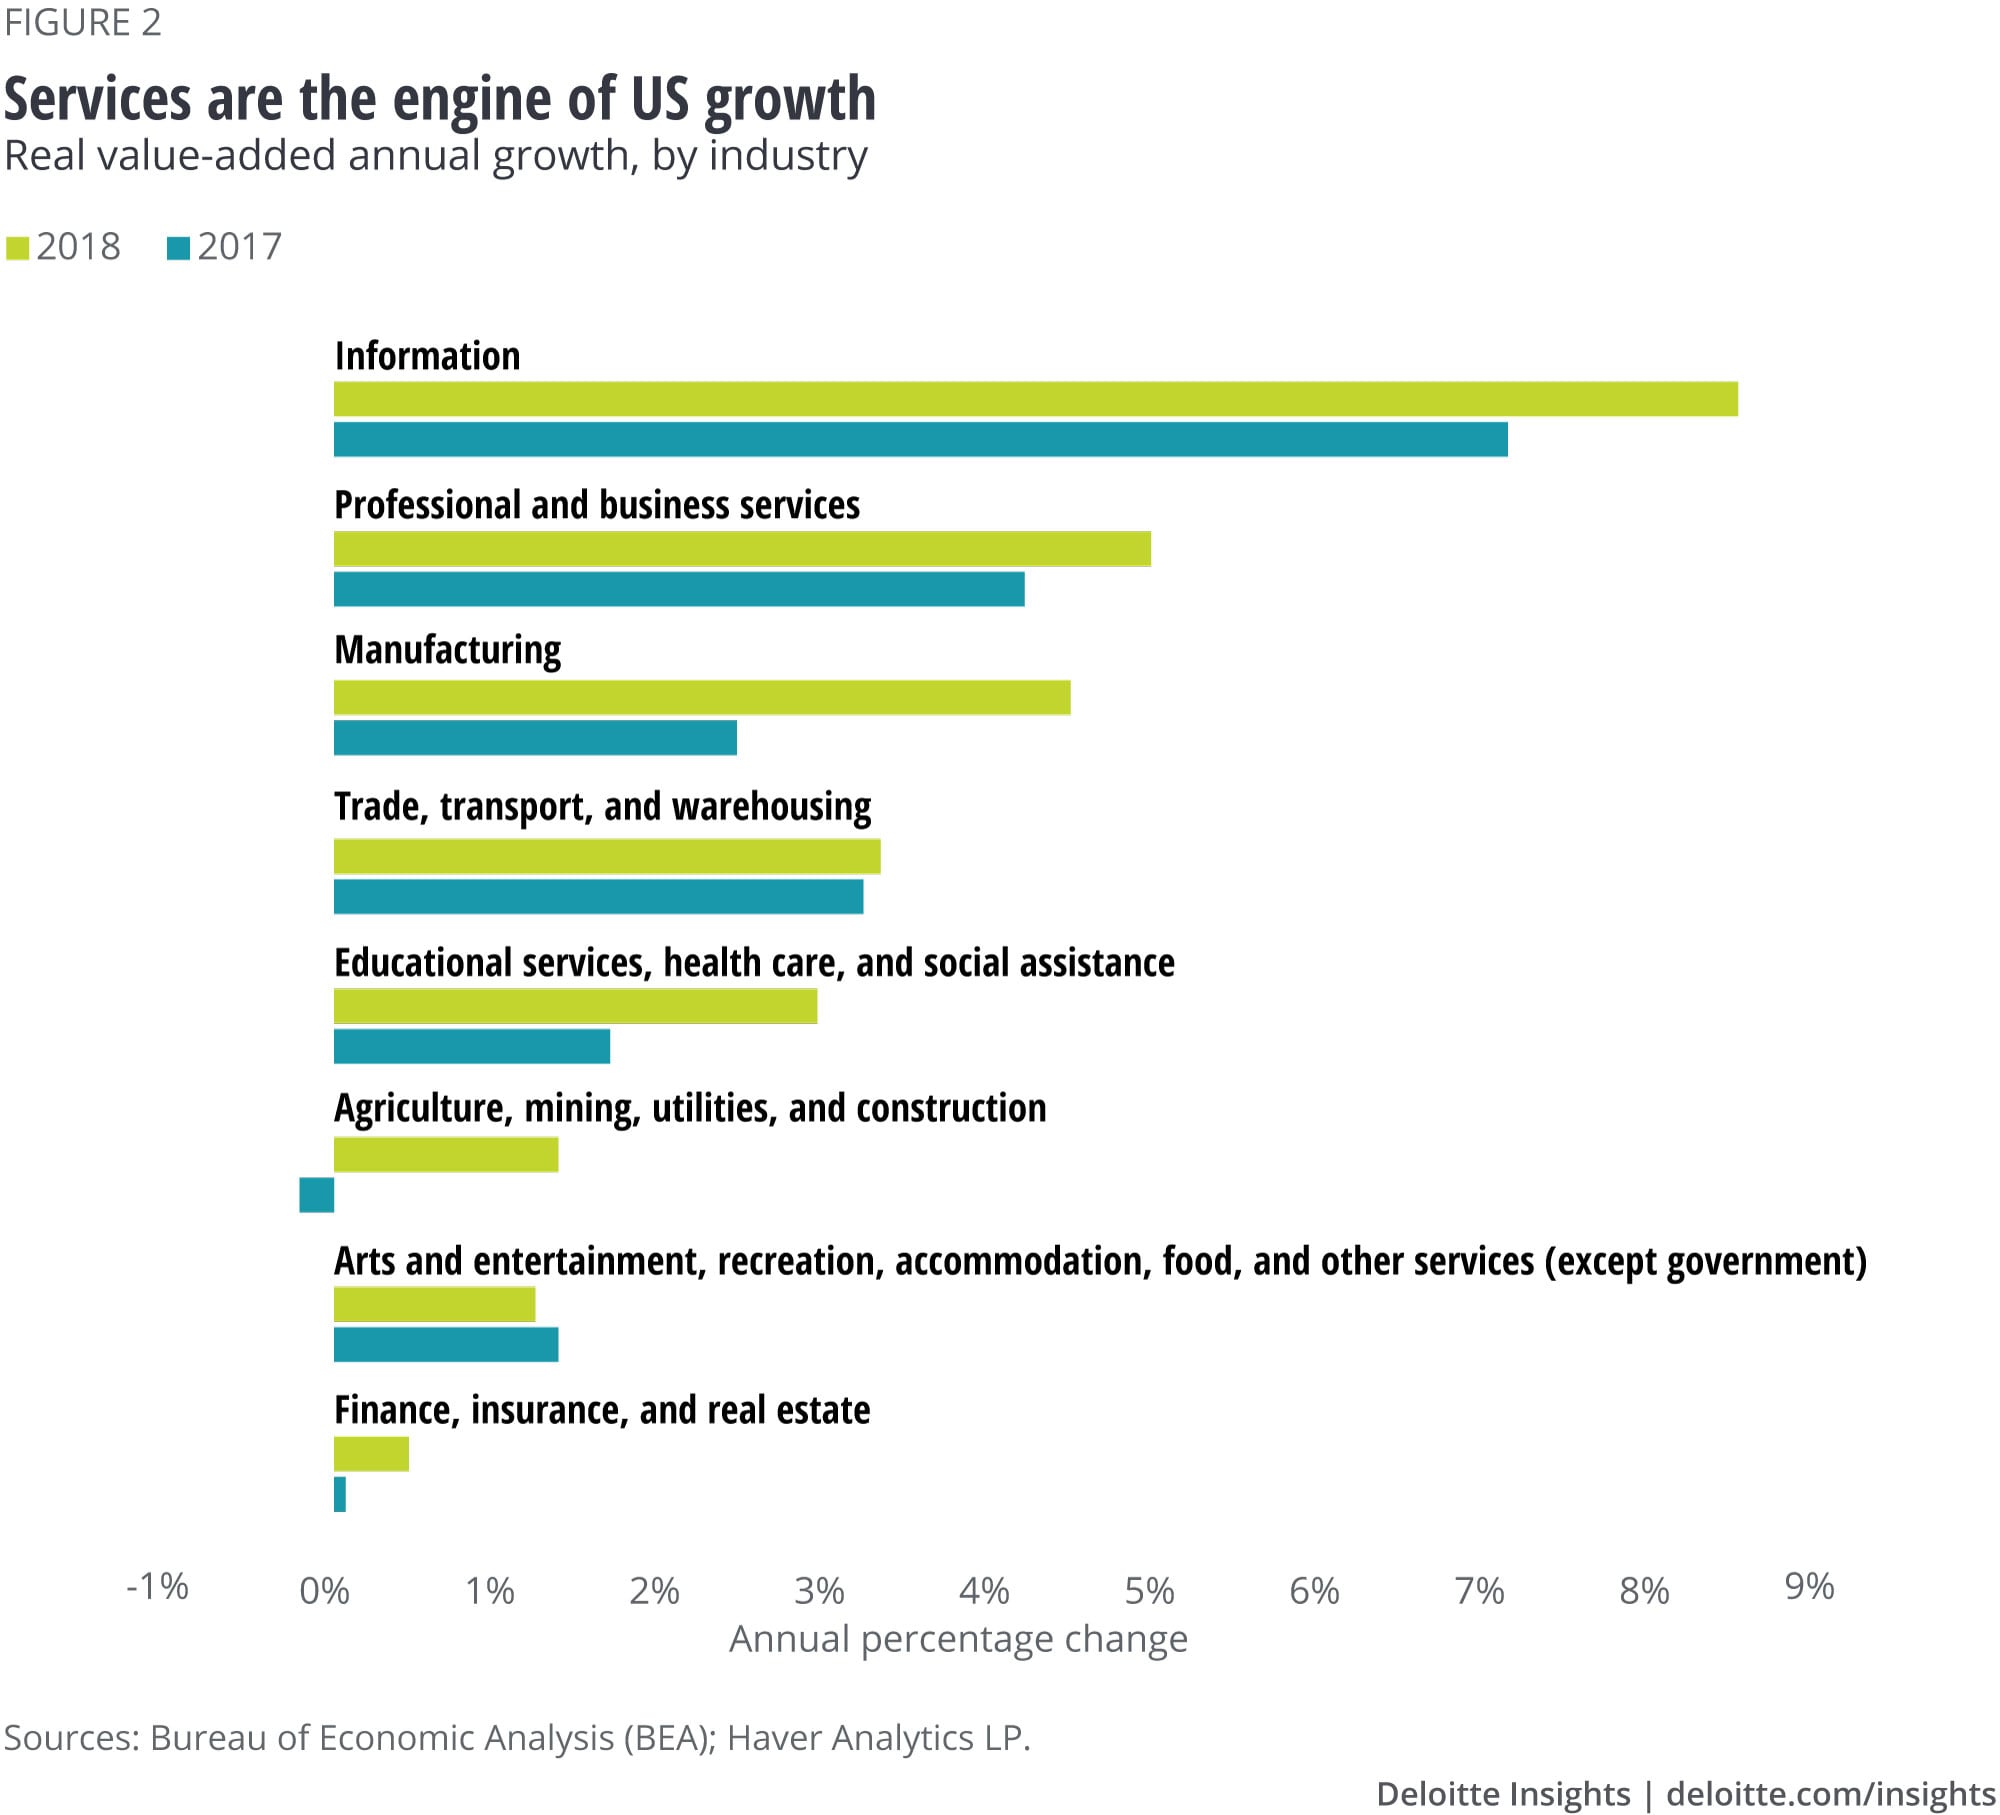
Since the global financial crisis, services did most of the heavy lifting in ensuring economic resurgence and sustained economic growth. The past few years’ data substantiates the trend—in 2018, four out of the top five fastest-growing industries—information; professional and business services; trade, transport, and warehousing; and educational services, health care, and social assistance—belonged to the services industry (figure 2).
Within services, what is remarkable is the growth in the information industry, which has experienced average annual growth of over 9 percent since 2015.1 Encompassing companies and institutions that engage in publishing, broadcasting, data processing, telecommunication, motion pictures, and sound recording, the information industry’s share in total GDP increased 1.5 times to 6.5 percent over the past one decade, which is also the biggest share increase that any industry has witnessed during this period. The other industry that is grabbing attention because of its strong growth and outlook is health care and social assistance (clubbed under educational services, health care, and social assistance). An increasingly aging demographic has been spending more on curative and preventive care and with the expanding pool of retired baby boomers, the industry is poised to grow at a faster pace.2
Not surprisingly, the biggest industry by share of GDP—finance, insurance, and real estate services—didn’t fare well in terms of growth and contribution. In fact, this industry, along with the agriculture, mining, utilities, and construction, was a drag on economic growth for most of the years during this recovery.

Industry’s contribution to GDP growth
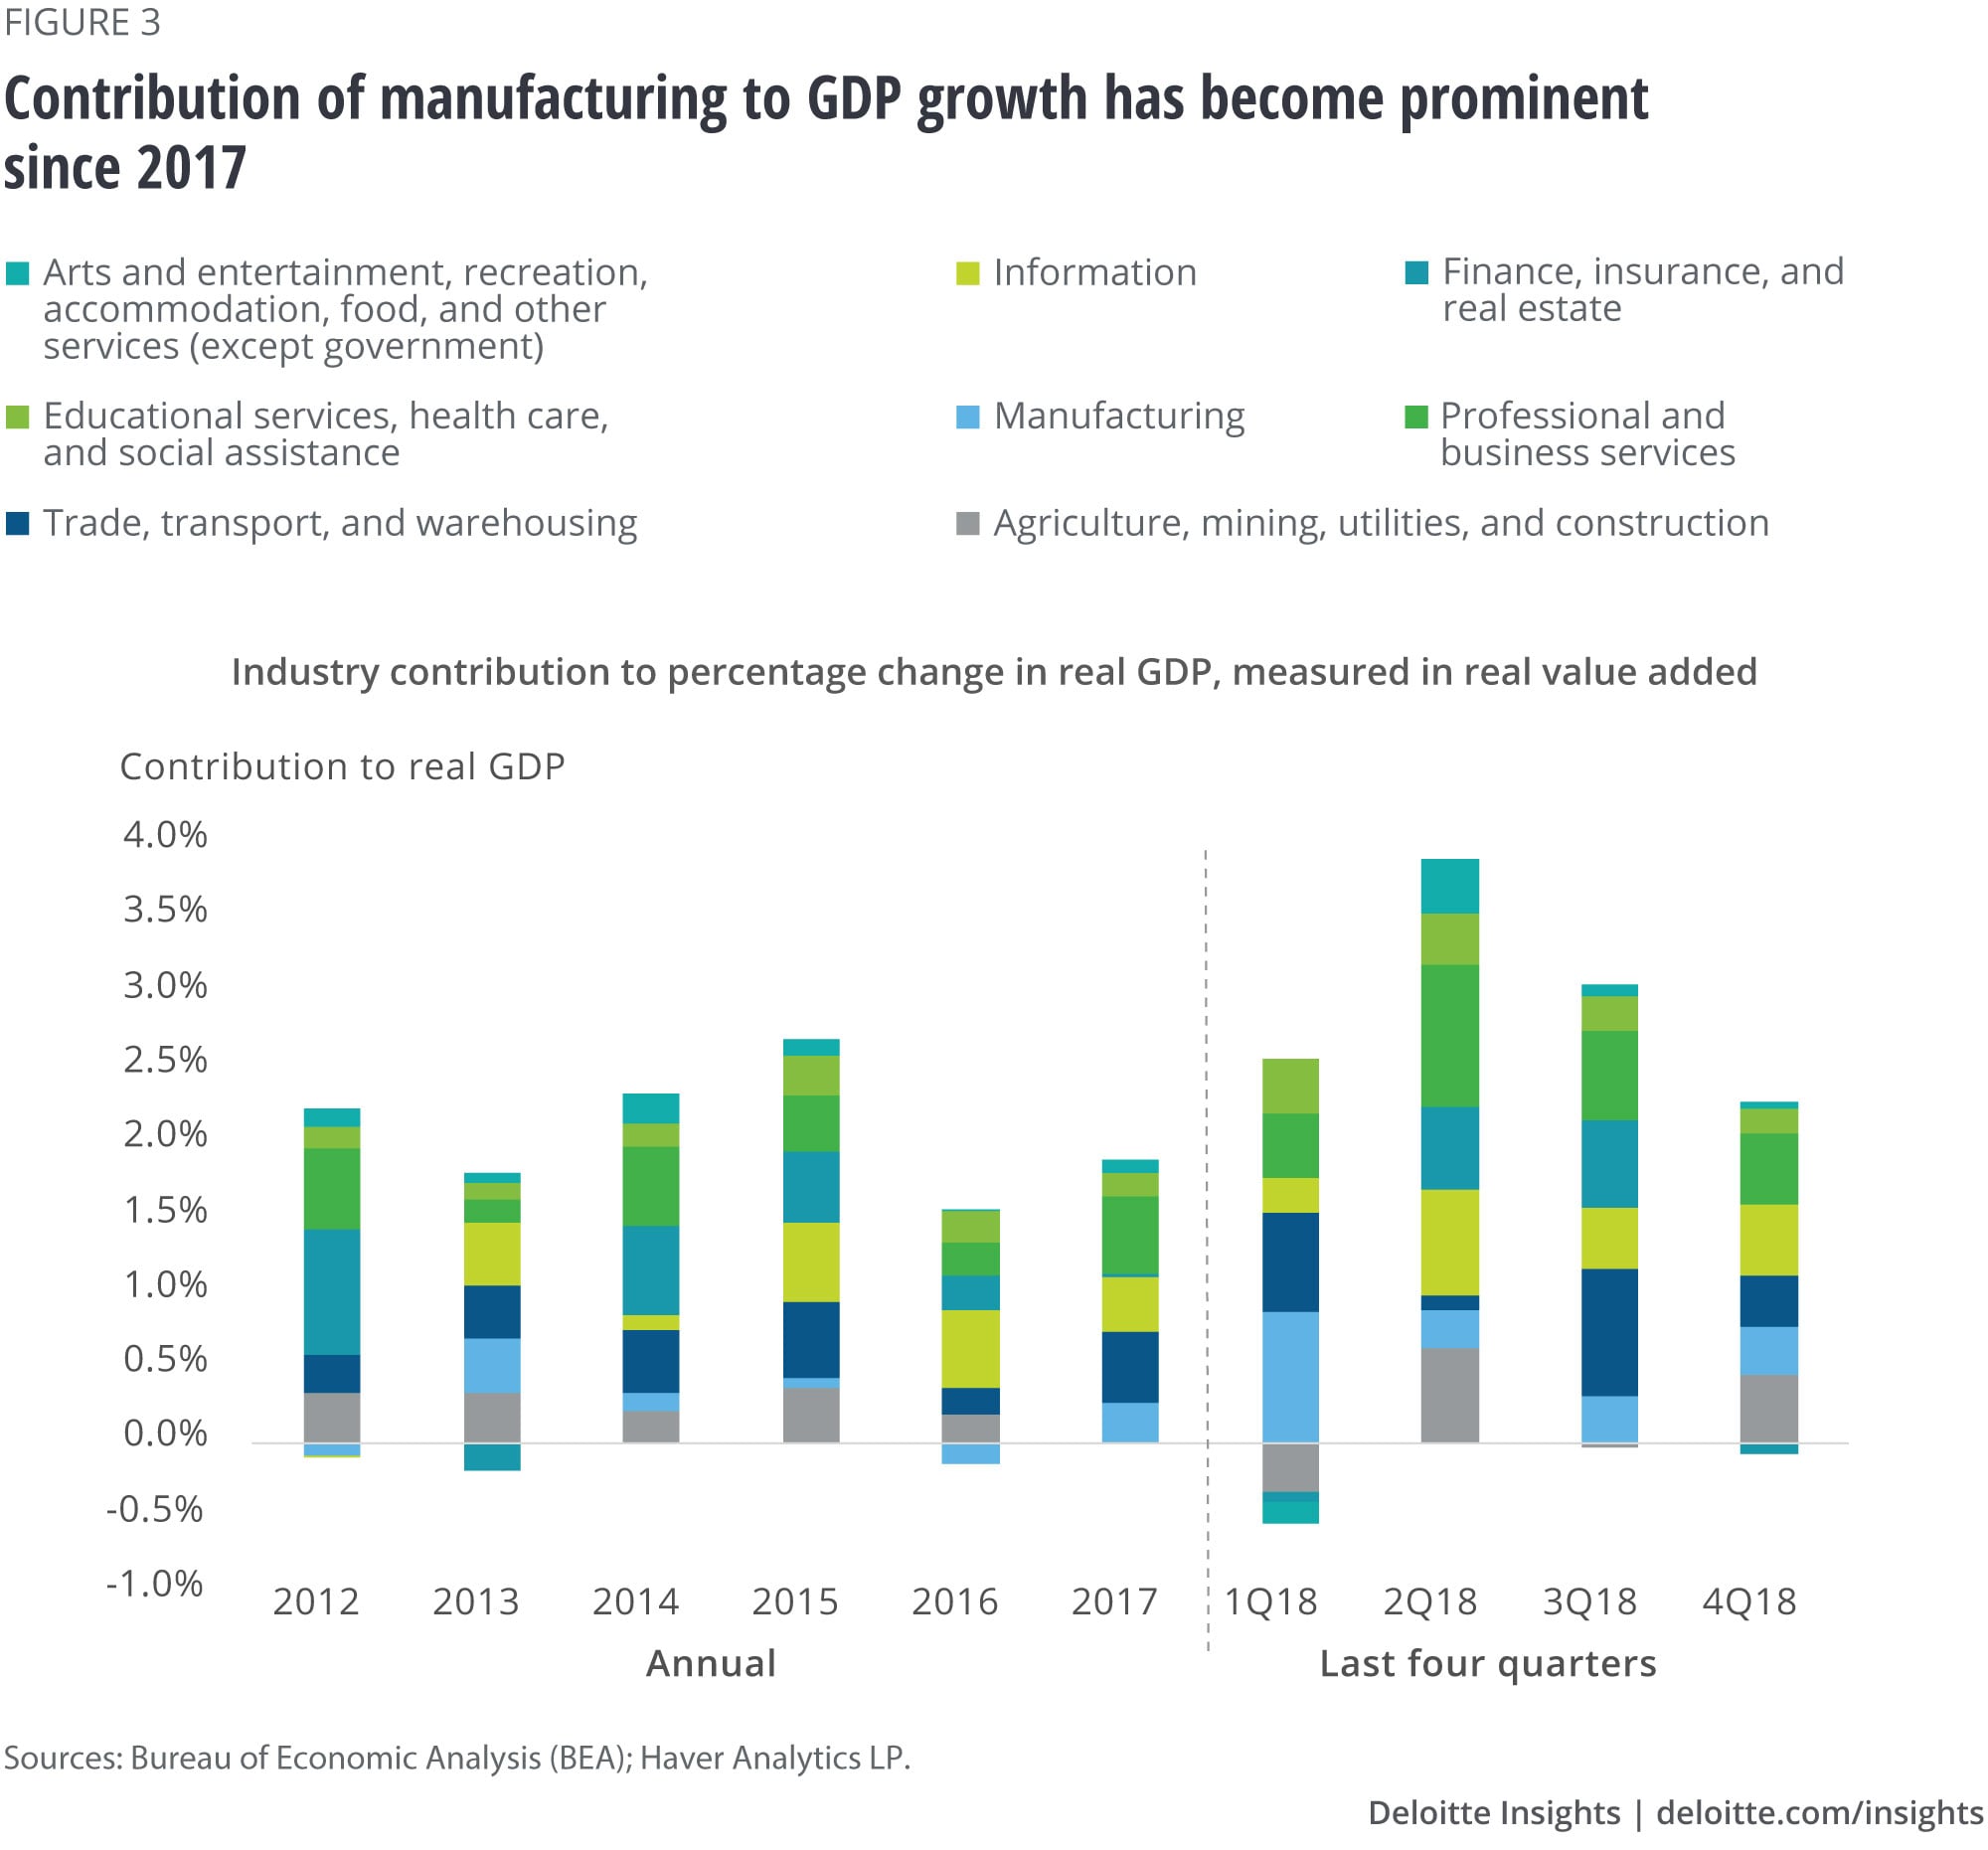
The contributions of different industries to economic growth (measured by GDP growth) paint a similar picture. Services, primarily the four mentioned above, have been the key pillars of GDP growth since 2014—when the economic recovery started gaining momentum (figure 3).3 As noted earlier, smaller services industries, such as information, and educational services, health care, and social assistance, gained prominence for their contribution to growth as well.
A closer view of 2018 shows that the impressive annual real GDP growth of 2.9 percent was bolstered by strong contribution from growth in the professional and business services (0.6 percentage points), followed by the manufacturing; trade, transport, and warehousing; and information industries (close to 0.5 percentage points each) (figure 3).

One of the key industries that made a wild card entry in 2017 was manufacturing. After years of falling output and negligible contributions to economic growth (figure 3), the industry witnessed impressive growth. Its increased contribution to growth seems to have legged up on several factors—such as the tax policies and the regulatory environment encouraging reshoring activities, transportation and energy costs, industry innovations, and rising labor costs in manufacturing bases such as China. That said, its share in total GDP has reduced consistently over the years because of services’ growing contribution. That raises the question about how sustainable the revival is, the answer to which lies in understanding who is demanding manufacturing (and services) output.
So, who demands the output?
BEA’s data on input-output accounts by use of commodities provides a detailed view of the interrelationships between US producers and users. It also helps in understanding the two different uses of industry output—output used as intermediate use by industries (own and others), and output used as final demand by users (measured by GDP components—namely, personal consumption, private investment, inventory changes, net exports, and government consumption and investment). We investigated the use of output produced by the two main contributors to GDP: services (within it, professional and business services; information; trade, transport, and warehousing services; and educational, health care, and social assistance) and manufacturing.
The 2018 input-output accounts reveal that services were predominantly used as final demand by users. For instance, most of the services by educational, health care, and social assistance services (97 percent); trade, transport, and warehousing services (50 percent); and information (37 percent) industries were used for personal consumption only. Only in the professional and business services industry, 72.4 percent of the services produced was primarily used as intermediate inputs by all industries. That said, private investments (final demand) claimed a significant proportion of these services (16 percent).
Interestingly, services industries consumed a significant share of their own output as intermediary inputs. For example, the information industry used 15 percent of its own services output as intermediary inputs.
In the manufacturing industry, while two-thirds of its output is used as intermediary inputs by all industries (67.1 percent), manufacturing itself uses a little more than half of that for producing its own goods. Being uniquely dependent on its own output (in the form of intermediate manufactured goods), relatively small changes in the final demand for manufacturing translate into large changes in manufacturing output. Agriculture, mining, utilities, and construction is the other big industry that uses manufacturing output as inputs.
By final use, one-third of the total manufacturing output produced goes toward personal consumption, while both private fixed investment and exports of goods and services demand 16 percent each. Interestingly, a third of manufacturing products used as final demand is imported, which indicates the economy’s sizable dependence on imports of manufacturing goods.4
Who will drive growth?
Services will likely continue to bolster growth, with a handful of its industries likely to outperform and provide the economy a much-needed boost required for sustained growth. However, a lot will depend on final demand by users as they are the primary growth drivers. As long as consumer and business confidence lead to robust consumer spending and investing activity, the wheels of the services industry will remain sufficiently greased. That said, several other factors will likely play an important role in generating demand for services output. For example, the health care industry will gain in prominence on the back of a rapidly aging population and millions of newly insured patients demanding health care services. In addition, technology and information advancements will make it important for all industries to become highly dependent on information services.
Spurred by policy initiatives emphasizing reshoring activities, availability of capital and talent, and market demand, growth in the manufacturing industry will likely remain strong. However, cost of labor, slower global and trade growth impacting the US economy, and possible supply chain disruptions because of uncertainties around trade conflicts may reverse the manufacturing revival.
© 2021. See Terms of Use for more information.
More from the Economics collection
-
How the financial crisis reshaped the world’s workforce Article6 years ago
-
Consumers in advanced economies: A tussle between tailwinds and headwinds Article6 years ago
-
Rising corporate debt: Should we worry? Article5 years ago
-
All in a day’s work—and sleep and play: How Americans spend their 24 hours Article6 years ago
-
Global Weekly Economic Update Article1 day ago
-
United States Economic Forecast Q1 2025 Article1 week ago


