Personal savings: A look at how Americans are saving Economics Spotlight, August 2019
7 minute read
28 August 2019

While the personal savings rate has been trending upward, average savings—calculated using the Consumer Expenditure Survey—has been on a broad declining trend since 2010–2012 for consumers across income levels and for key working-age groups.
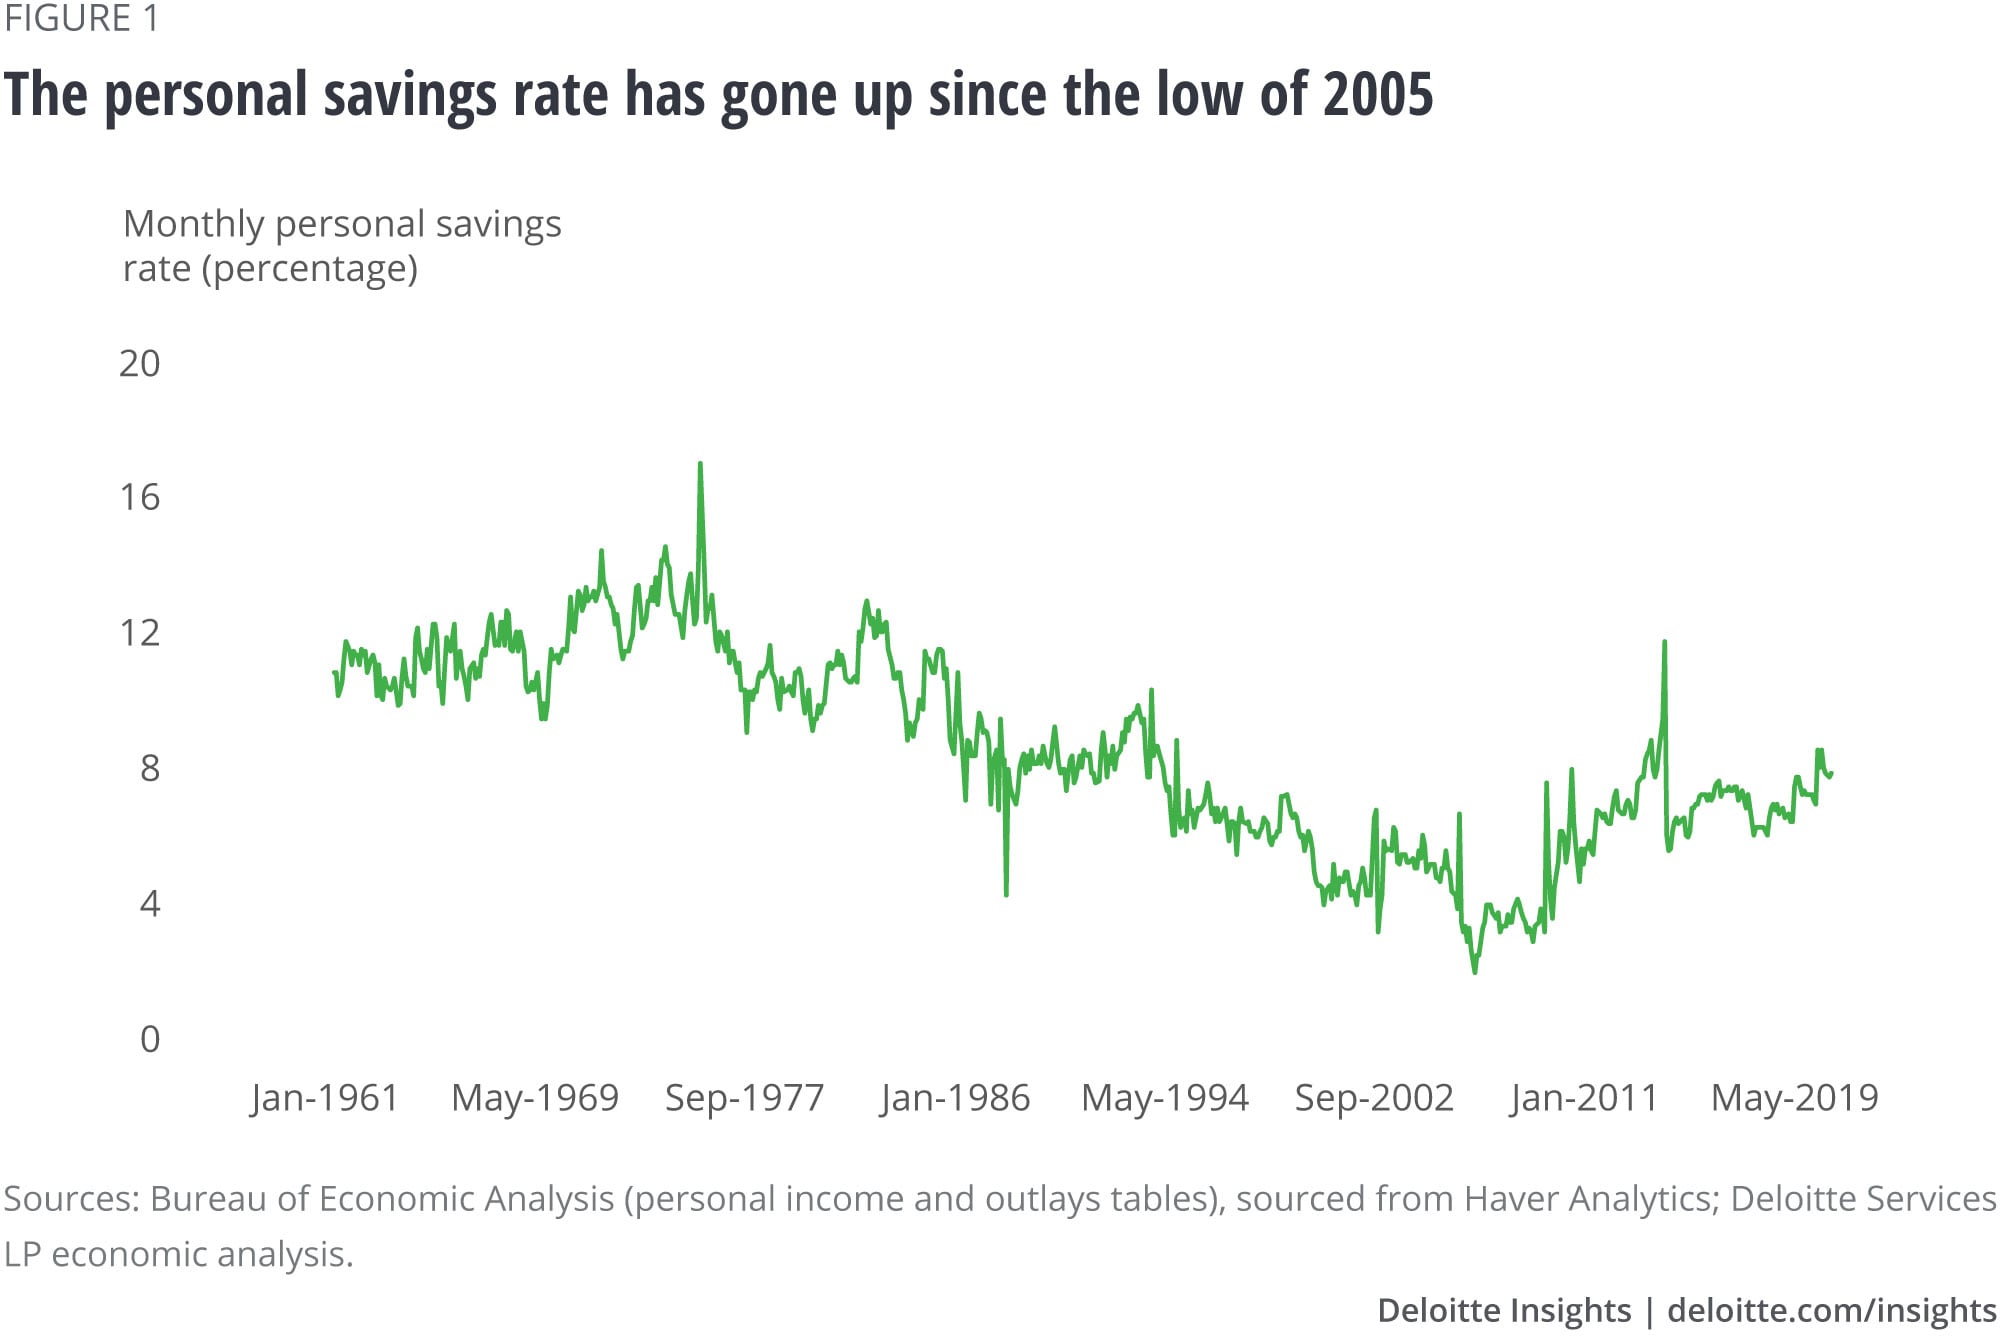
Back in 2005, many economists couldn’t stop worrying about the personal savings rate in the United States.1 The rate, defined as the ratio of personal savings in the country to disposable personal income, had dropped to a low of 2.2 percent in July that year. Low personal savings meant that people were spending more relative to their incomes—good for short-term economic expansion, but not ideal for funding investments critical for long-term growth. And 2005 was hardly an exception; the savings rate had been edging lower since the late 1970s. The new low in 2005, however, left economists concerned.
Learn more
Explore the Economics Spotlight collection
Subscribe to receive related content
Download the Deloitte Insights and Dow Jones app
Since then, the savings rate has bounced back slightly. This rate—measured by the US Commerce Department’s Bureau of Economic Analysis (BEA)2—is, however, not the only yardstick of savings. Data on who is doing the savings and how much is available in the Consumer Expenditure Survey (CES)3 by the US Bureau of Labor Statistics (BLS) and the US Federal Reserve’s (Fed’s) Survey of Consumer Finances (SCF).4 A more detailed look at all these sources reveals some interesting facts on aggregate and individual savings in the economy.
Savings has bounced back in the last 13 years
The savings rate started picking up after 2005—slowly at first and then gathering pace after the Great Recession. As often happens in recessions, the downturn of 2008–2009, with its adverse impact on the labor market, likely forced people to set aside more funds for a rainy day even as they cut down expenses. Personal savings, therefore, started increasing at a faster pace than disposable personal income. Between 2010 and 2018, for example, personal savings grew annually, on average, by 6.3 percent, higher than the 4.2 percent rise in disposable personal income during that period. The savings rate has continued to pick up pace, reaching 8.1 percent in June this year (figure 1).
A little help from the BLS to calculate average savings by income and age groups
While the upswing in the savings rate since 2005 is good news, especially for economists worried about long-term growth, what do we know about the characteristics of savers? To find out, we looked at the CES’ annual data on average income and expenditure from 1984 to 2017. While the CES does not have data on average savings per person, the information available allowed us to create our own measure of average savings using the data for average income before taxes and average expenditure. We calculated two measures of average savings. The first measure is derived by deducting average overall expenditure from average income after taxes. In the second method, we add a consumer’s average expenditure on pensions and social security to the first savings measure to arrive at a broader measure of average savings. This brings our calculation closer to the BEA’s definition.5
- Average savings 1 (AS1) = Average income after taxes – Average overall consumer expenditure
- Average savings 2 (AS2) = Average income after taxes – Average consumer expenditure + Average consumer expenditure on pensions and social security
Average savings has declined in recent years
The CES data reveals that between 1984 and 2017—the period for which CES data is available—average savings per year rose steadily until 2010 before declining. While CES does not provide data on the savings rate—just like it doesn’t for savings—we can arrive at two average savings ratios by dividing our two savings measures by income after taxes.6 These ratios, however, portray a similar trend as average savings—rising steadily until 2010 before declining (figure 2). That’s because although growth in average income after taxes has slowed (0.7 percent on average per year) since 2010, average savings has contracted during this period—the narrower AS1 measure by 16.6 percent and the broader AS2 measure by 7.9 percent.

The gap in average savings between high- and low-income earners has widened
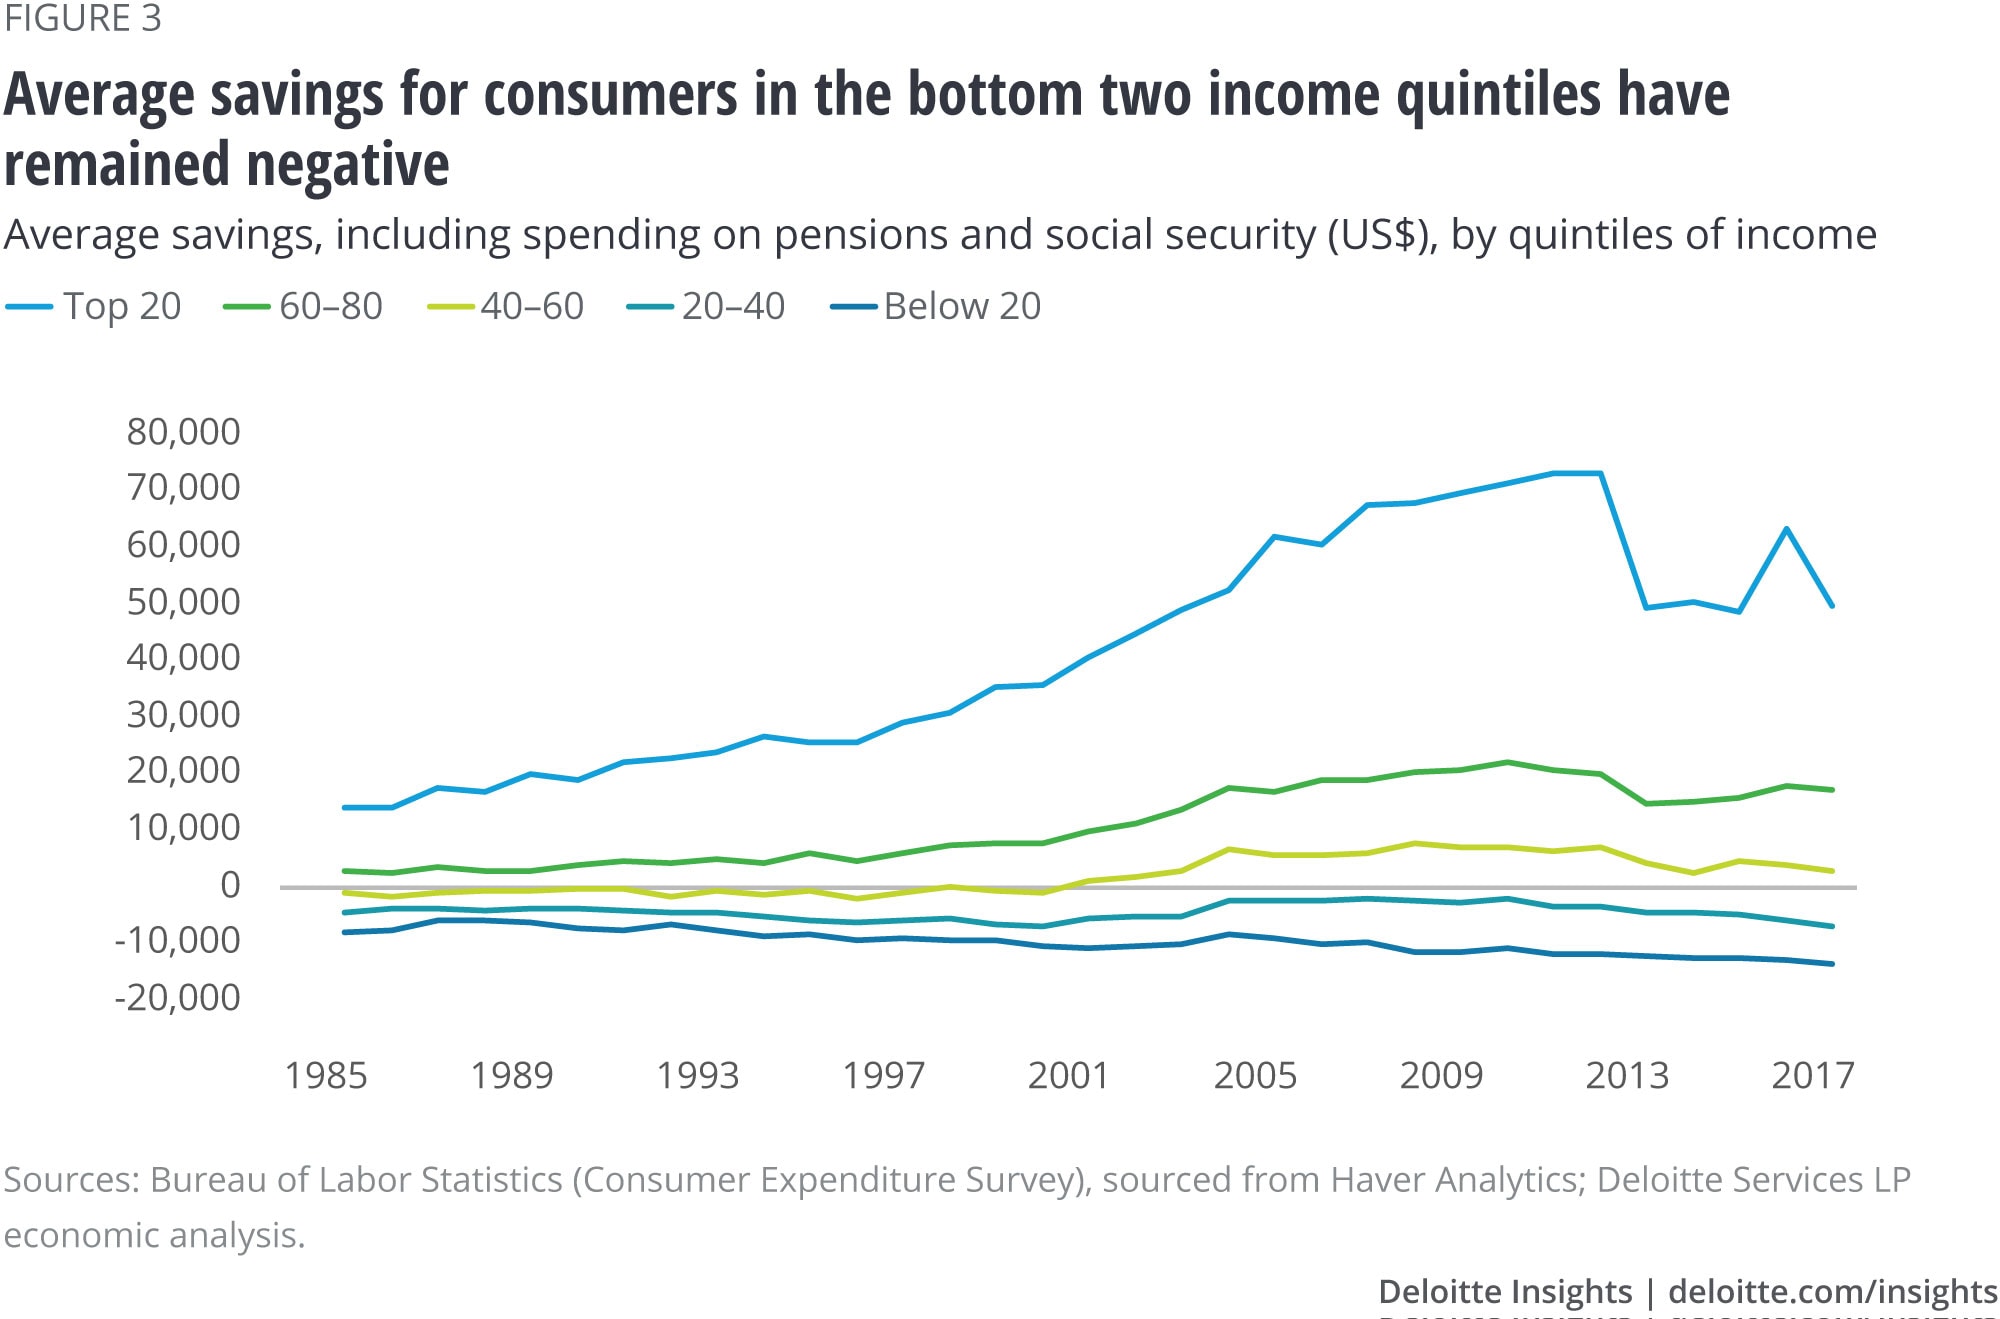
The CES data reveals—no surprise—that consumers with higher incomes save more than those who are at the bottom of the income ladder. Nevertheless, the data offers some interesting insights. First, average savings—both AS1 and AS2—have been negative for the bottom two quintiles of consumers by incomes. And even for the third (40–60 income quintile), the savings rate was zero, and turned positive only in the new millennium. Second, overall average savings is mostly driven by the top-20 income quintile, followed by the 60–80 income quintile. These are the only income groups that had positive saving rates over the entire period. Savings for these two groups steadily rose until 2010–2012 before losing a bit of steam in recent years (figure 3). Third, the gap between average savings for the top-20 and bottom-20 income groups is still much wider than what it was in 1984, despite some reduction over the past few years. Finally, the average savings rate for these groups reveals how much low-income groups overspend relative to their income (figure 4)—in 2017, for example, average savings rate (using AS2—the broader measure) for the bottom-20 income quintile was about -114 percent.

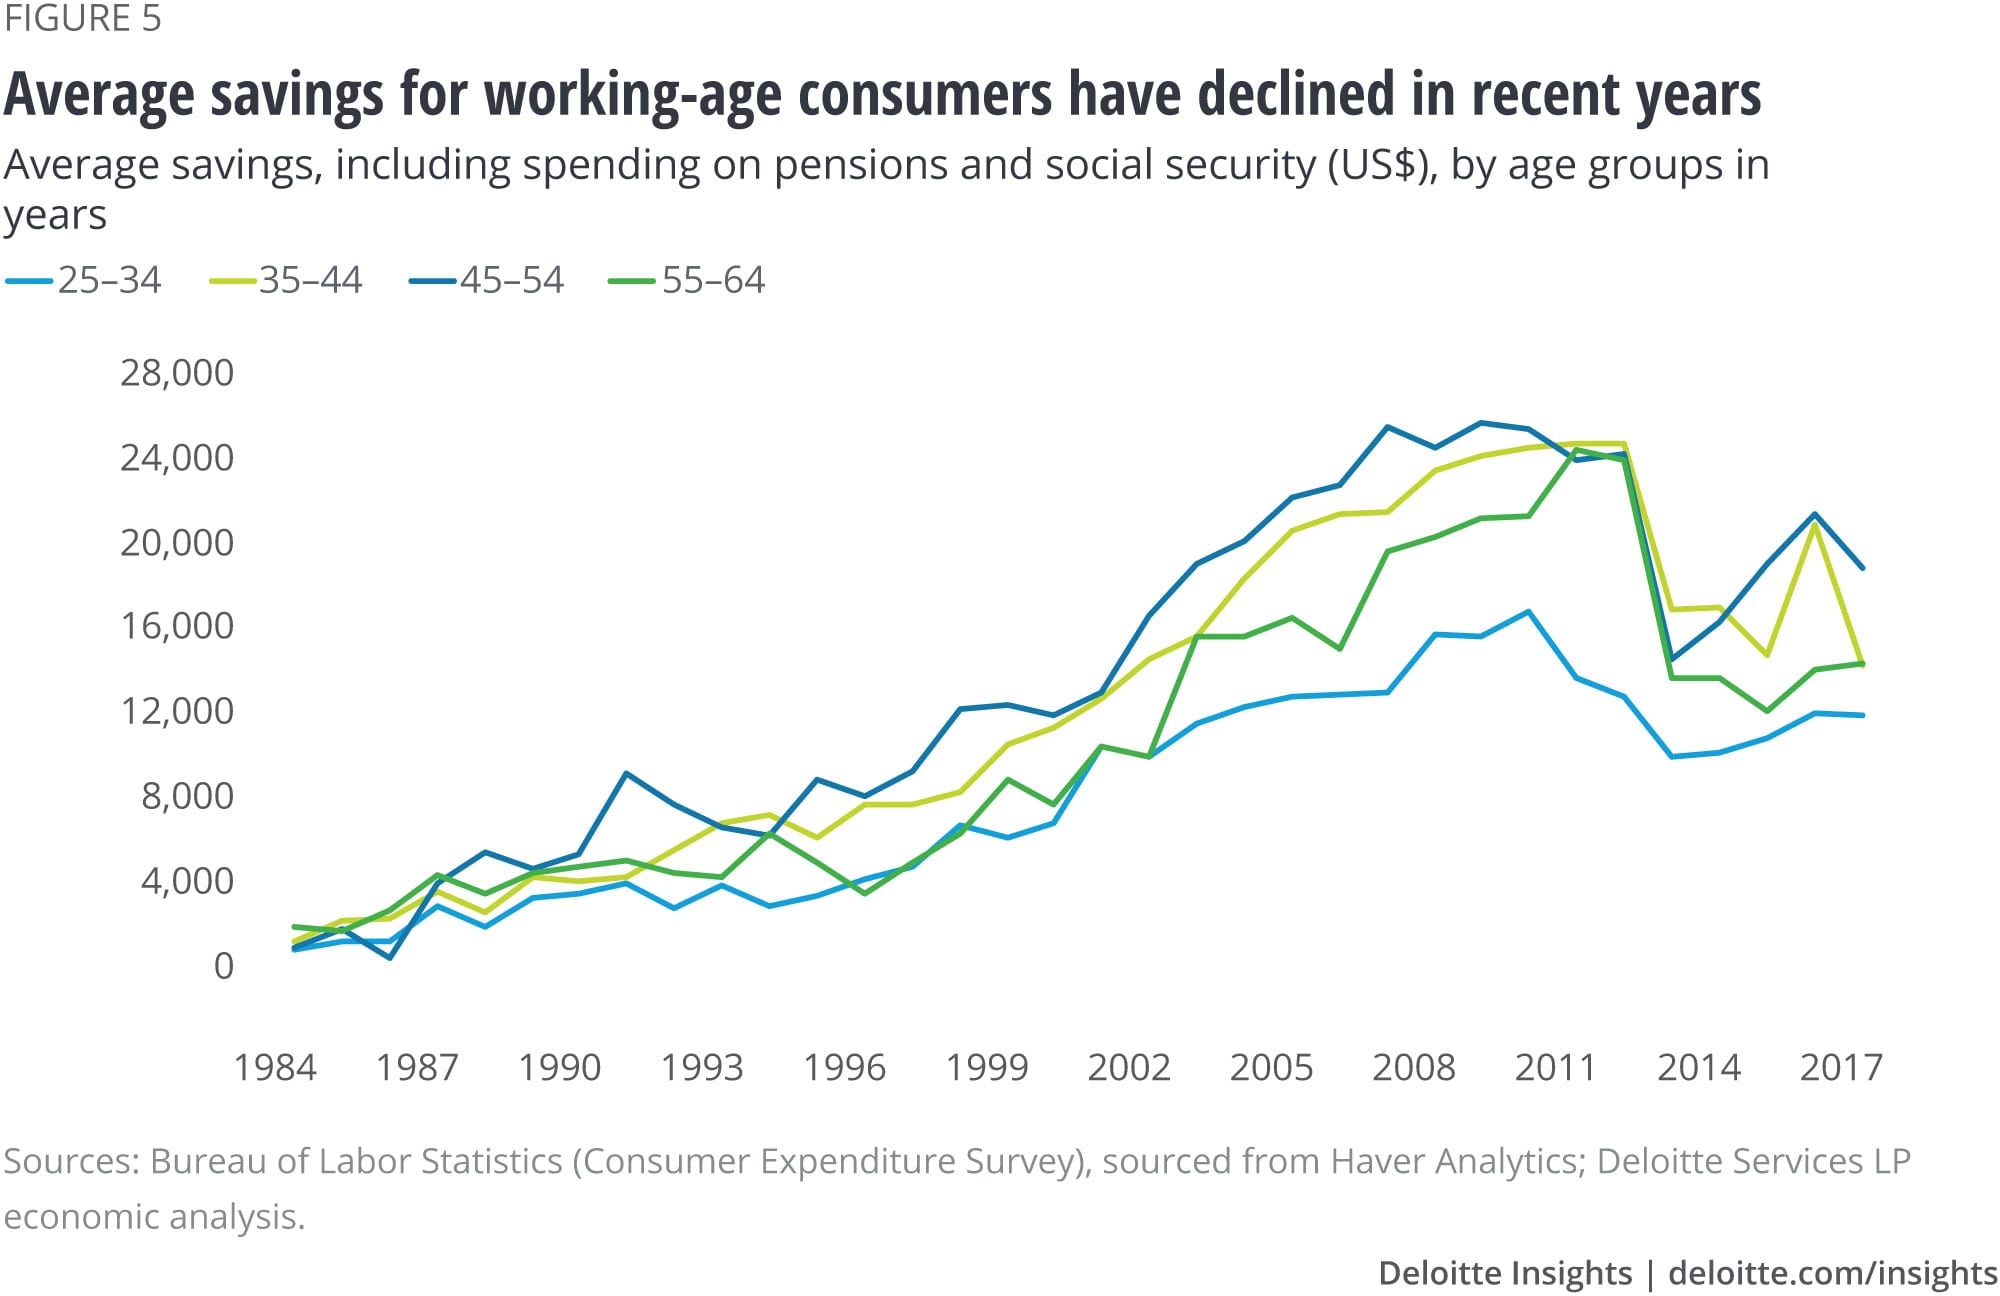
The CES data also enables us to check for savings behavior by different age cohorts. Using the same methodology of calculating average savings as we did for different income groups—aka AS1 and AS2—we find that average savings increase with age before declining for the 65–74 years and 75 years or above cohorts. That’s not surprising as savings typically rise with age as people save during their working age and then spend their life’s savings when they retire. Interestingly, the data also reveals that average savings for four working-age cohorts—25–34 years, 35–44 years, 45–54 years, and 55–64 years—display a similar trend to the one we observed for key income groups in figure 3: Average savings went up steadily until 2010–2012 before losing momentum (figure 5).
Share of households who save goes up with household income
The negative average savings figures for low-income earners makes us wonder whether any of them save at all. And what about the wider economy?
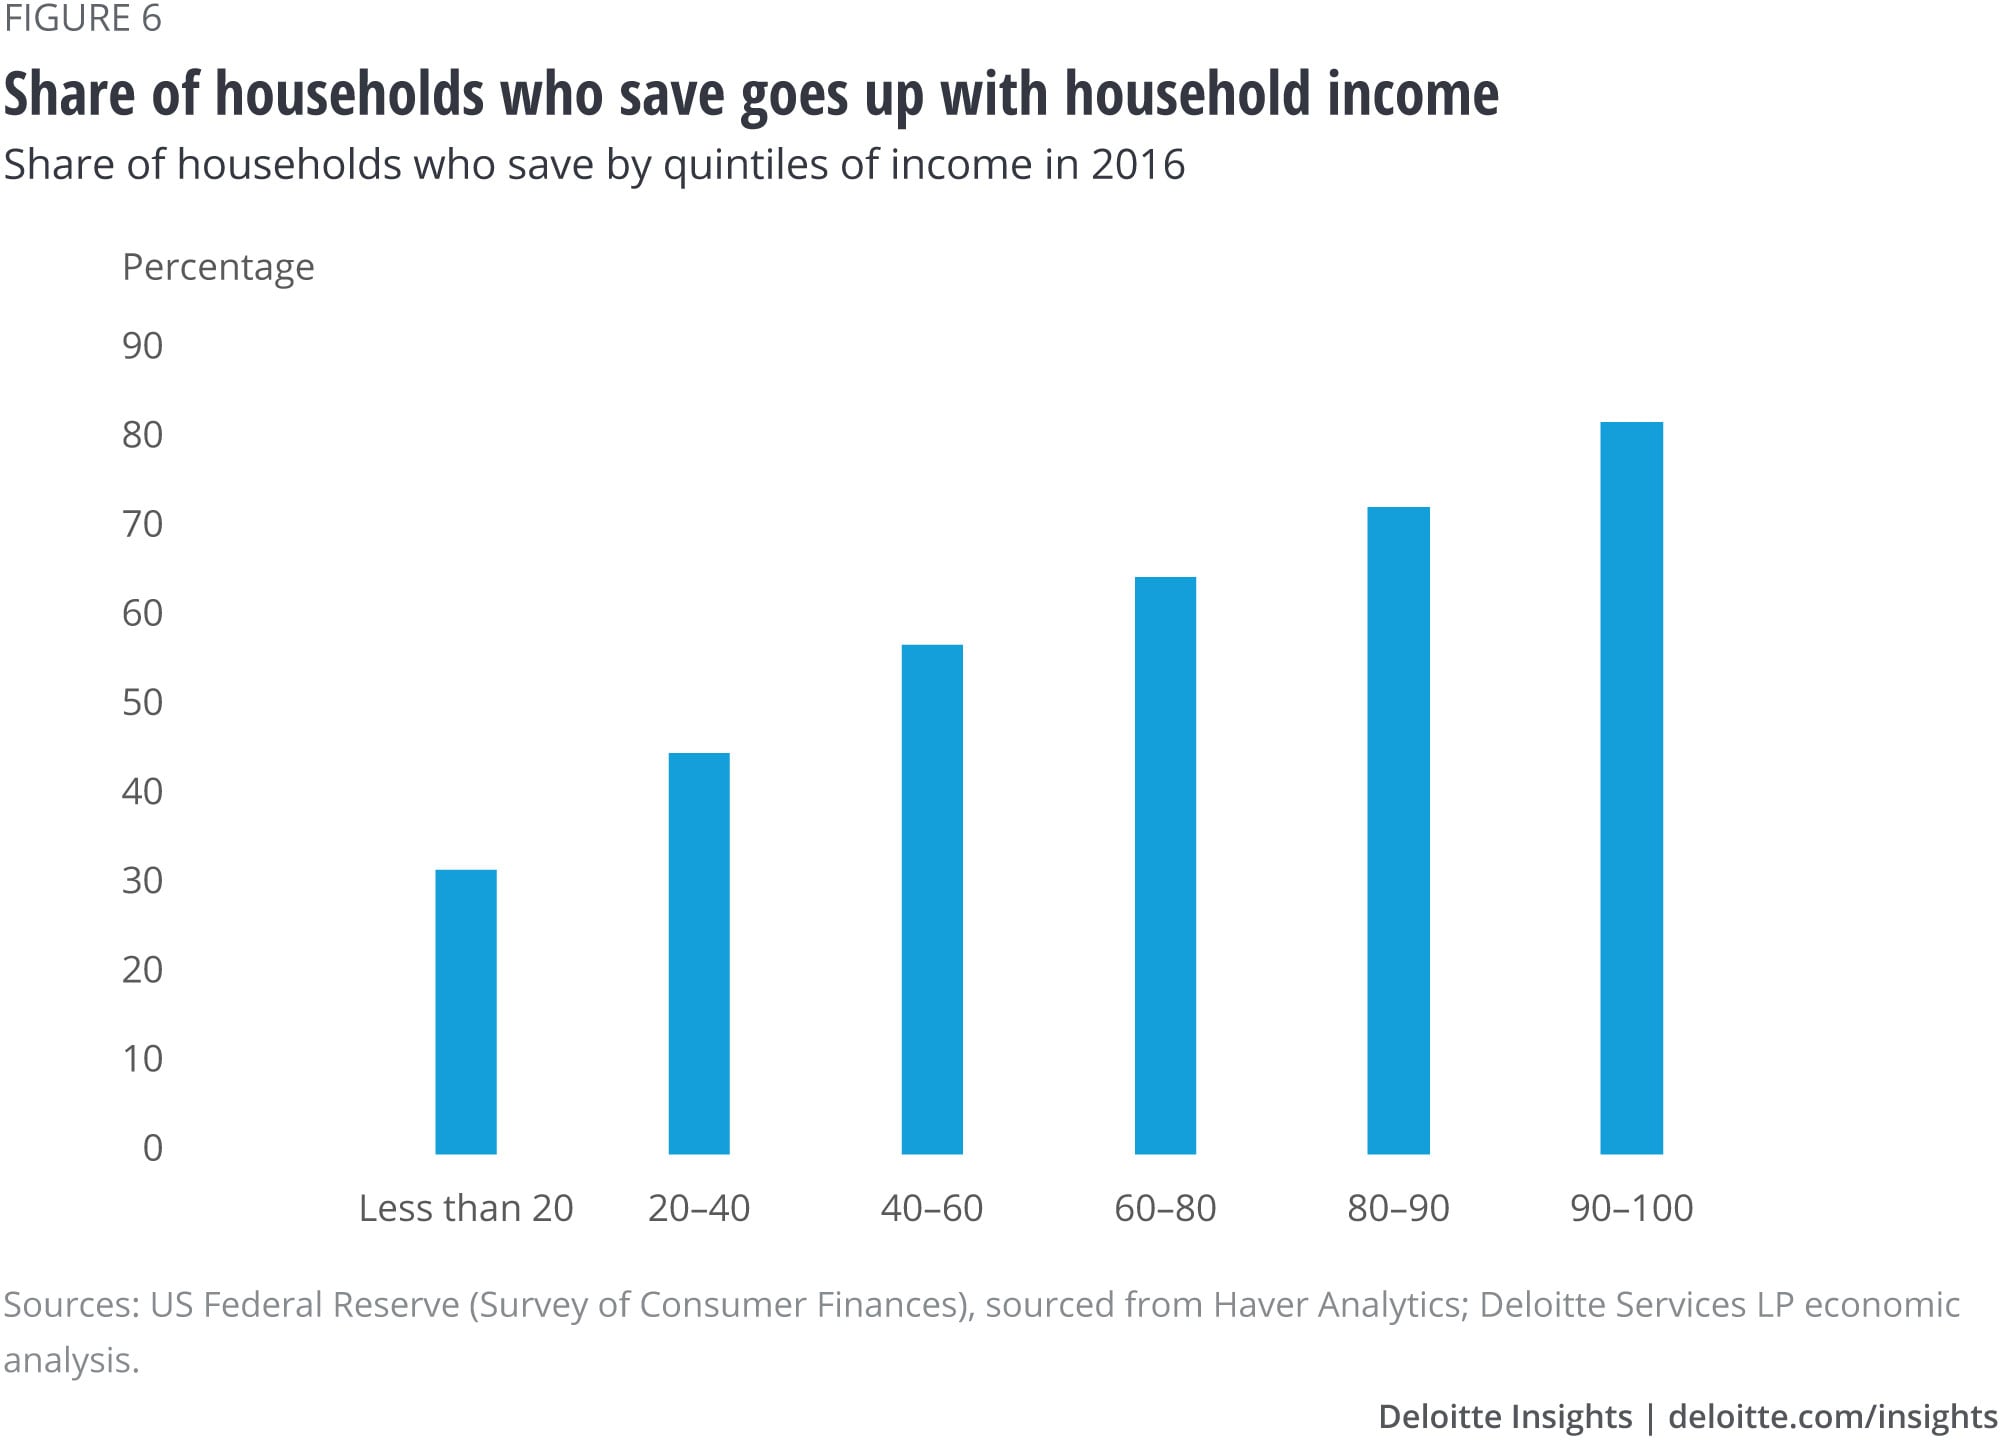
While the CES does not provide such data, the Fed’s SCF does. According to the SCF, only 55.4 percent of households did some savings in 2016. While this figure is up from the one in the previous survey (2013), it is lower than what it was in 2007 (56.4 percent) and 1992 (57.1 percent). From the SCF data by income groups, it is also evident that the share of households who save increases as we move up the income ladder (figure 6), hardly surprising given savings rise with incomes. In 2016, for example, the share of households who saved was highest for the top-10 income group (82.3 percent) and lowest for the bottom-20 percent (32.1 percent). Interestingly, this gap between the top-10 and bottom-20 hasn’t changed much over 1992–2016, barring some small fluctuations.
Less savings translates into lower asset accumulation
While the uptick in the personal savings rate will bring some cheer, the decline in average savings over the past few years will be a cause for concern. Also worrying is the lack of savings for consumers at the bottom of the income ladder. Inability to save not only impedes some semblance of financial security—to handle unfavorable events such as a job loss or sudden illness—but also dents asset accumulation, a reason why wealth inequality has gone up in recent years.7 And if the number of households who save don’t increase over time, it will only exacerbate the inequality.
Economists will, therefore, likely keep an eye on the CES and SCF data for the next few years, just as they did for the personal savings back in the early 2000s.
Deloitte Global Economist Network
The Deloitte Global Economist Network is a diverse group of economists that produce relevant, interesting and thought-provoking content for external and internal audiences. The Network’s industry and economics expertise allows us to bring sophisticated analysis to complex industry-based questions. Publications range from in-depth reports and thought leadership examining critical issues to executive briefs aimed at keeping Deloitte’s top management and partners abreast of topical issues.
Learn more
Get in touch

- Akrur Barua
- Executive manager
- Deloitte Services India Pvt. Ltd
- abarua@deloitte.com
- +1 678 299 9766
© 2021. See Terms of Use for more information.


More from the Economics collection
-
 Global Weekly Economic Update Article6 days ago
 -
 All in a day’s work—and sleep and play: How Americans spend their 24 hours Article6 years ago
 -
 How the financial crisis reshaped the world’s workforce Article6 years ago
 -
 Rising corporate debt: Should we worry? Article5 years ago
 -
 United States Economic Forecast Q1 2025 Article6 days ago
 -
 Canada Economic Outlook Article4 years ago