Fed signals smaller rate cuts in 2025 amid high inflation and trade risks
If FOMC members’ December median view is any indication, interest rates may stay higher for longer
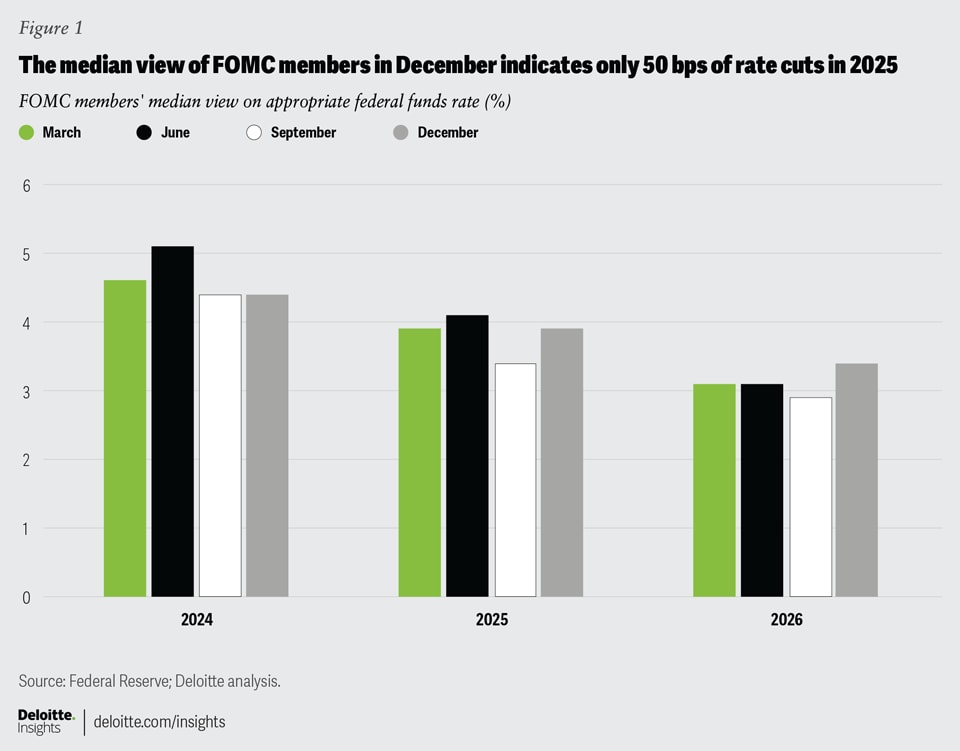
On Dec. 18, 2024, the Federal Open Market Committee (FOMC) cut the federal funds rate by 25 basis points (bps) to 4.25% to 4.5%, the third straight rate cut last year.1 Yet, what attracted more attention was the committee’s outlook on the trajectory of monetary policy over the next three years.2 The median view of FOMC members in December changed from the previous quarter: They now anticipate only 50 bps rate cuts in 2025—half of what the median view was in September—implying that interest rates are expected to stay higher for a longer period.3
What explains this shift? The answer, as always, lies in data on inflation, labor market, and economic growth. Contrary to expectations last September, inflation is still elevated relative to the FOMC’s target.4 Concerns about the labor market haven’t materialized: Job growth remains healthy and unemployment low relative to historical levels.5 Also, it is likely that, by December, the committee had factored in new risks, especially around trade policy: Any hike in tariffs will impact inflation and, hence, the path interest rates take from here.6
Inflation has remained above the FOMC’s target
The median view of FOMC members kept changing throughout 2024 (figure 1). Between March and June, the median view turned conservative, a trend also seen for the period between the last two projections of the year. In December, the median view projected fewer rate cuts for 2025 than in September, with the federal funds rate expected to stay higher for longer. Notably, the view on rate cuts for 2024 remained unchanged; the FOMC indeed cut rates by 100 bps in 2024, in line with its median view from the previous quarter.
What forced a change in the FOMC’s thinking in December? Well, inflation—both headline and core—which remained elevated in the last quarter of 2024. That in fact has been the story for much of the last year.7 Between September and November, personal consumption expenditure (PCE) inflation—the FOMC’s preferred price gauge—edged up to 2.4% from 2.1%.8 Core PCE inflation, which excludes food and energy prices and is key to monetary policy decisions, also increased during this period to 2.8%, still some way off from the FOMC’s 2% target. Both core and headline inflation, as measured by the Bureau of Labor Statistics’ consumer price index, were even higher than the PCE measures.9
Unlike 2022 and 2023, services (not goods) are driving both headline and core inflation higher (figure 2). PCE services inflation, for example, has fluctuated between 3.7% and 4.2% for nearly a year, while inflation for goods has been negative during this period. A key reason driving high services inflation is housing, including rent. Housing-related inflation hasn’t eased much relative to its recent peak of April 2023 and remains higher than it was in the previous decade.10
This, in turn, has kept core PCE inflation elevated relative to target levels (figure 3). And in recent months, rising prices of food services and accommodation, health care, and finance and insurance have added to the pressures of housing on headline and services inflation.11
A strong labor market has lowered the need for large rate cuts
The labor market has defied worries of softening. In November, the economy added 227,000 nonfarm payrolls, bringing average monthly gains in the first 11 months of 2024 to 180,000.12 It’s true this number is lower than the corresponding figure for 2023—an average of 251,000 nonfarm payrolls gain per month—it nevertheless represents solid job growth given the high levels of payrolls in the economy currently. The job openings rate rose in November and is still higher than the average for the previous economic recovery, while quits and layoffs have stayed relatively flat.13 And while unemployment may have edged up slightly since end-2023, it is still low (at 4.2% in November) relative to historical levels.14
The labor force participation rate too has increased. That it remains slightly below pre-pandemic levels can be attributed more to demographic changes such as aging than to any cyclical economic factors. In fact, the participation rate for those ages 25 to 54 at 83.5% is now slightly higher than the figure right before the pandemic (figure 4).
A tight labor market, in turn, has ensured high wage growth (figure 5).15
Strong wage growth in services doesn’t augur well for services inflation. First, the services sector tends to be more labor-intensive than goods-producing ones. Hence, rising wages will increase the cost of production. Second, consumer demand for services has been steadily rising with nominal consumer spending on services up by 5.9% since December 2023, which is much higher than the 2.2% rise in spending on goods. FOMC members would likely be concerned that strong demand for services can combine with wage growth in the sector to keep services inflation higher for longer.
The risk from tariffs is still unknown
The key unknowns for the FOMC in December were the emerging risks from policy changes, especially related to trade. While tariffs are widely discussed, it is still unclear how intense such tariff changes would be. Tariffs tend to raise prices in the near term without boosting domestic output. This, in turn, may influence the trajectory of interest rates.
Deloitte’s latest forecast for the US economy throws some light on likely scenarios that may emerge.16
In the baseline scenario, which has a 50% probability, we anticipate only a moderate increase in tariffs and that too on limited products (and geographies).17 Inflation will rise as a result, albeit moderately. With economic fundamentals expected to remain strong, real GDP will grow on average by about 2% per year till 2029. In such a scenario, the FOMC will cut rates by only 50 bps in 2025, in line with its December view; it will then pause till mid-2027 as it analyzes evolving trends around inflation and unemployment.
Two key risks, however, stand out, and both relate to the severity of trade policy.
First, in an upside scenario,18 which has a 30% probability, strong growth in productivity due to tech-related investments will not only lead to higher economic growth but will likely cover for rising production costs. Trade policy, in this scenario, won’t be used extensively but only for negotiating favorable trade deals. These two factors will keep inflation lower than the baseline, leading to a more accommodative monetary policy (figure 6).
Second, strong tariffs, especially on major trading partners (60% on all goods from China, 20% on goods from all other trading nations19) will have a much bigger impact on inflation than our baseline (figure 7).
Average annual PCE inflation, in such a scenario (probability of 20%),20 will rise to 3.5% in 2026 from an estimated 2.5% in 2024. This will force the FOMC to tighten monetary policy in 2026 before easing again the year after to stimulate the economy.
