The ‘greenback’ gains as global economic uncertainty rises
The March 2025 Economics Insider explores why the US dollar has been gaining against other currencies since September last year


As the world economy tries to find its footing, currency markets have witnessed strong gains in the US dollar.1 By January 13, the nominal Federal Reserve Board broad dollar index (FRBDI)2—a trade-weighted average of the value of the US dollar against currencies of the country’s major trading partners—reached its highest level since records started. While the index has eased a bit since then, the dollar still shows strong increases compared with a swathe of other currencies.3
So, what’s causing this steep climb in the value of the “greenback?”
There are multiple reasons driving this strength in the dollar. First, the potential of US tariffs (and retaliation by other nations)4 has led to a rise in global economic uncertainty,5 at a time when worries over global conflicts6 continue to weigh on sentiment. This has led to a rush to safe assets; the US dollar is quite dominant in this area.7 Second, US tariffs undermine imports and, hence, reduce the US trade deficit. Yet, to ensure that foreign capital fills in for the savings gap (relative to investments) in the United States, the dollar must appreciate to boost imports and, thus, widen the US trade deficit to pre-tariff levels. Third, tariffs also impact the dollar through heightened inflation expectations, which will likely keep US interest rates higher for longer.8 Finally, the dollar’s strength also reflects the strong fundamentals of the US economy, which has outpaced other advanced economies.
The US dollar is on the move
Since September 2024, the US dollar has, on average, gained 6.7% against the euro, 5.5% against the British pound, and 8.6% against the South Korean won.9 Among emerging markets, the dollar has strengthened most during this period against the Indonesian rupiah (6.7%), the South African rand (4.9%), and the Mexican peso (4.5%).
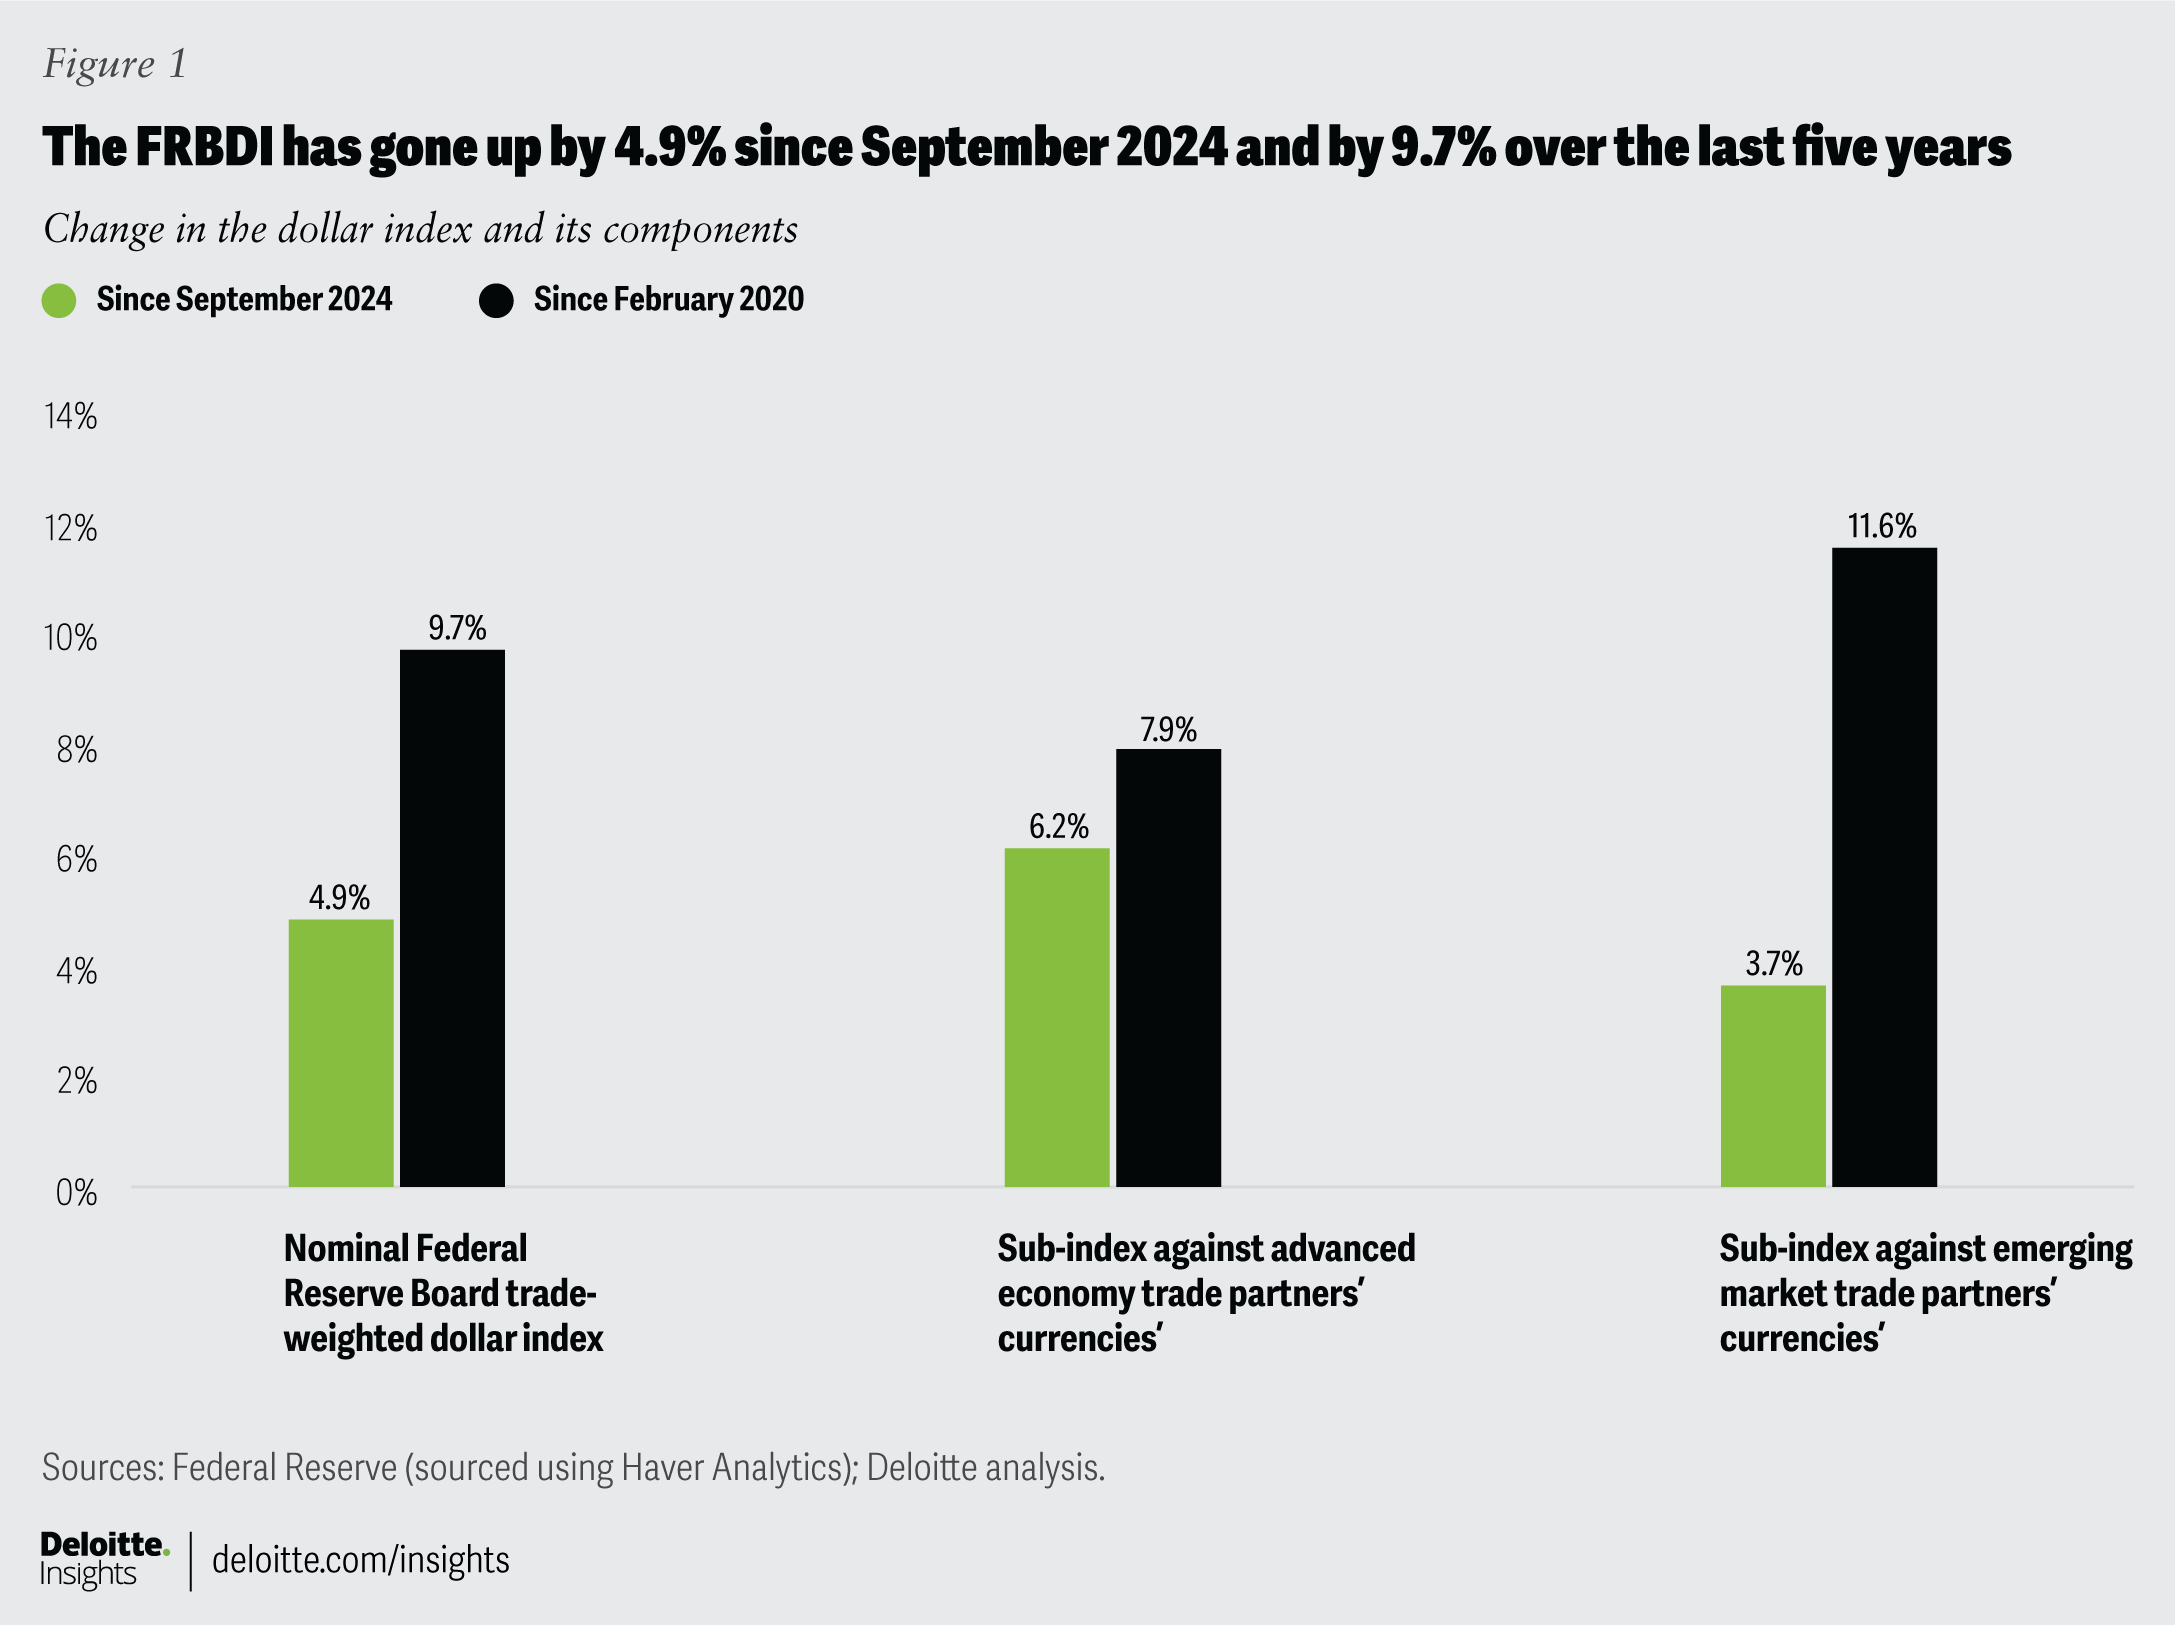
This is also evident from FRBDI trends, with the index going up by 4.9% in the same period. Its subindices show that gains in the dollar, on a trade-weighted basis, have been more against advanced-economy counterparts (6.2%), compared with emerging-market currencies (3.7%).10 However, currencies of the United States’ emerging-market trade partners have lost more against the dollar over a longer period—for instance, since the start of COVID-19 (figure 1).

Factors driving US dollar strength range from global economic uncertainty to domestic economic strength
There are four major reasons why the US dollar has gone up in recent months.
- Changing policies: The rising potential of US tariffs has led to global uncertainty, thereby increasing the lure of safe assets like the dollar. On Feb. 1, 2025, the US administration announced 25% tariffs on imports from Mexico and Canada, barring energy imports from Canada, which would attract a lower (10%) tariff.11
Although these come into force on March 4, 2025, after a month’s negotiations, it is still unclear what the final framework will be, given some exemptions and further discussions.12 A cumulative 20% tariff on imports from China—to which China has retaliated—has also come into effect. The United States has also announced tariffs on steel and aluminum imports, with similar measures lined up for automobiles, pharmaceuticals, and electronic chips. That’s not all—it is also considering reciprocal tariffs on key trading partners.13
With the outlook uncertain, many investors have been making a beeline for the dollar, which dominates global financial markets. The greenback accounts for about two-thirds of all official foreign exchange reserves and nearly 90% of global foreign exchange transactions.14 Hence, in times of economic and political uncertainty, the US dollar typically strengthens, as demand for it increases.
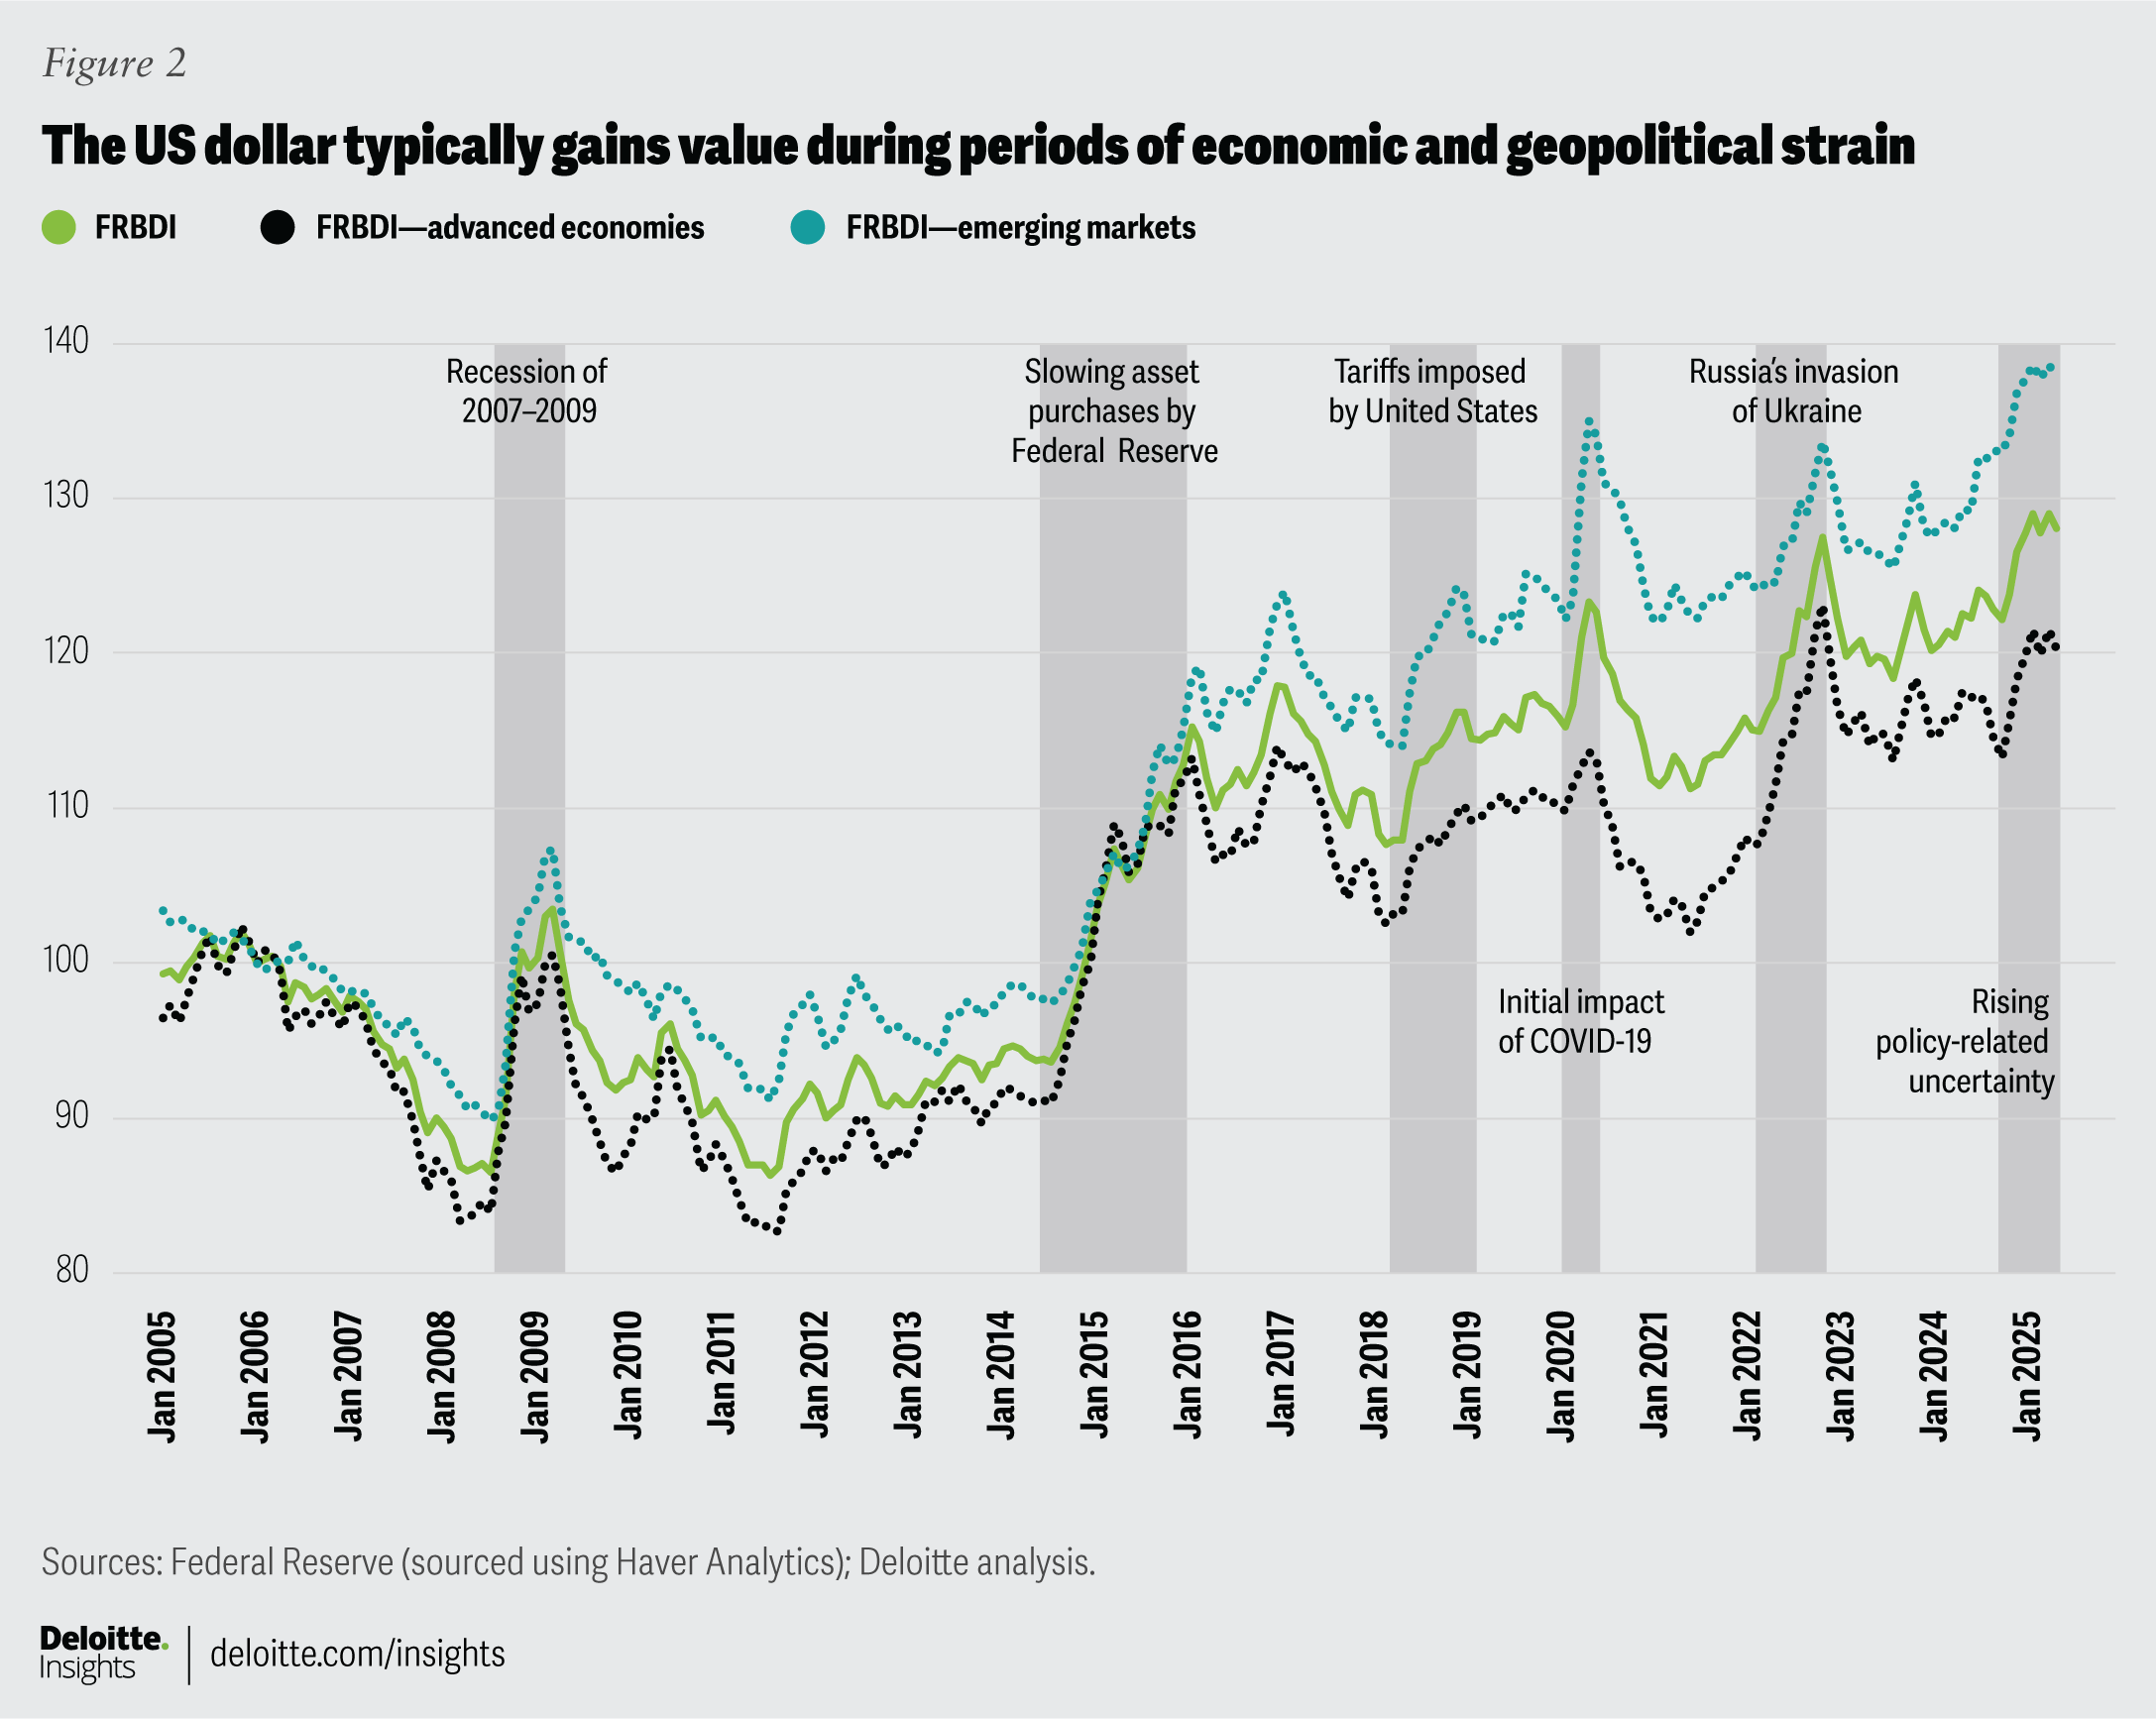
Figure 2 shows trends in the FRBDI for the last 20 years, with the gray bars indicating times of economic and geopolitical turmoil. For example, when the Federal Reserve reduced its pace of asset purchases,15 the index rose by 23% between May 2014 and January 2016. In recent years, the dollar index went up after the outbreak of COVID-19 and in the months after the Ukraine-Russia conflict in early 2022.

For some emerging markets, the economic uncertainty surrounding international trade policy, coupled with high domestic equity valuations, has prompted global investors to book profits and return to safe assets (like the dollar) or redeploy funds to countries where equity valuations are still low.16 Indian equity markets, for example, had a standout three years till last year, with the benchmark NIFTY 50 index gaining 18% on average per year between 2022 and 2024.17 Foreign institutional investors have, since, been pulling out of India steadily and returning to the United States (for safety) or to China (due to low valuations there).18 This, in turn, has contributed to the weakening of the Indian rupee against the dollar.
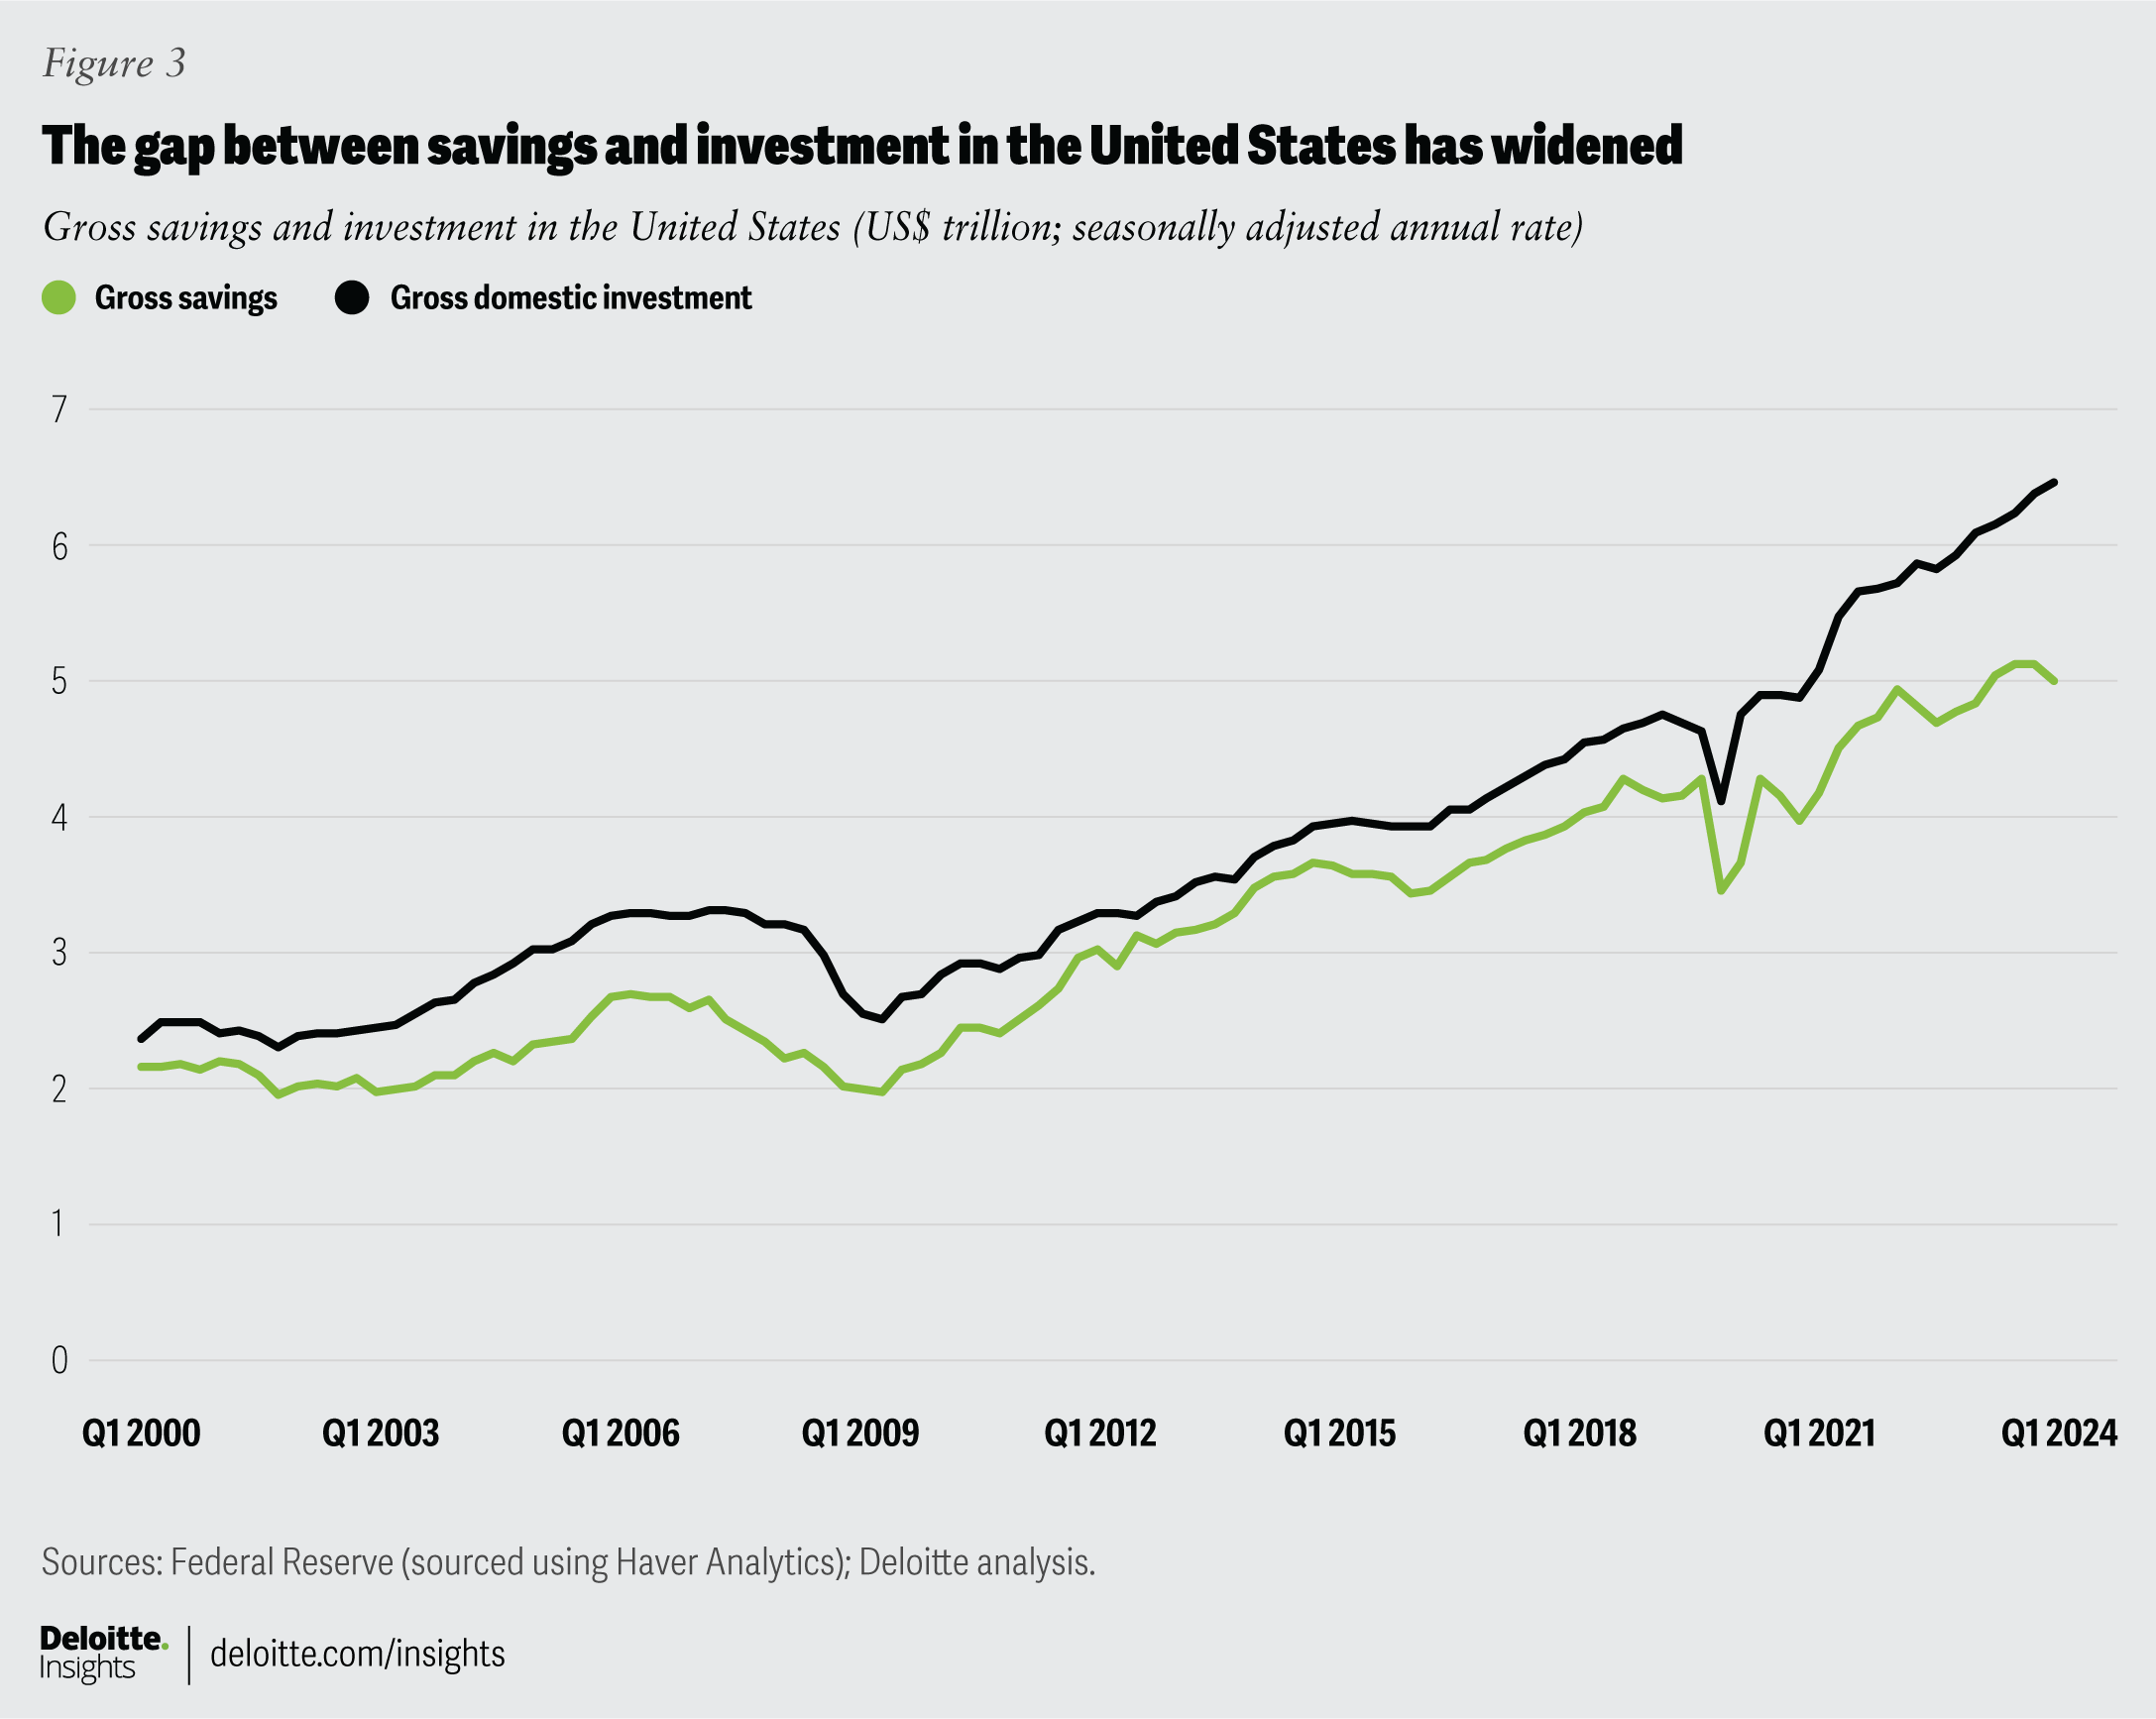
- Plugging the US savings-investment gap: Higher tariffs can undermine imports and, hence, reduce the US trade deficit. However, a reduced trade deficit has implications for a savings-deficient (relative to investments) nation like the United States. In the third quarter of 2024, gross savings in the US economy were about US$5 trillion—lower than total domestic investments of US$6.4 trillion.19 And this gap has been increasing over the years (figure 3).

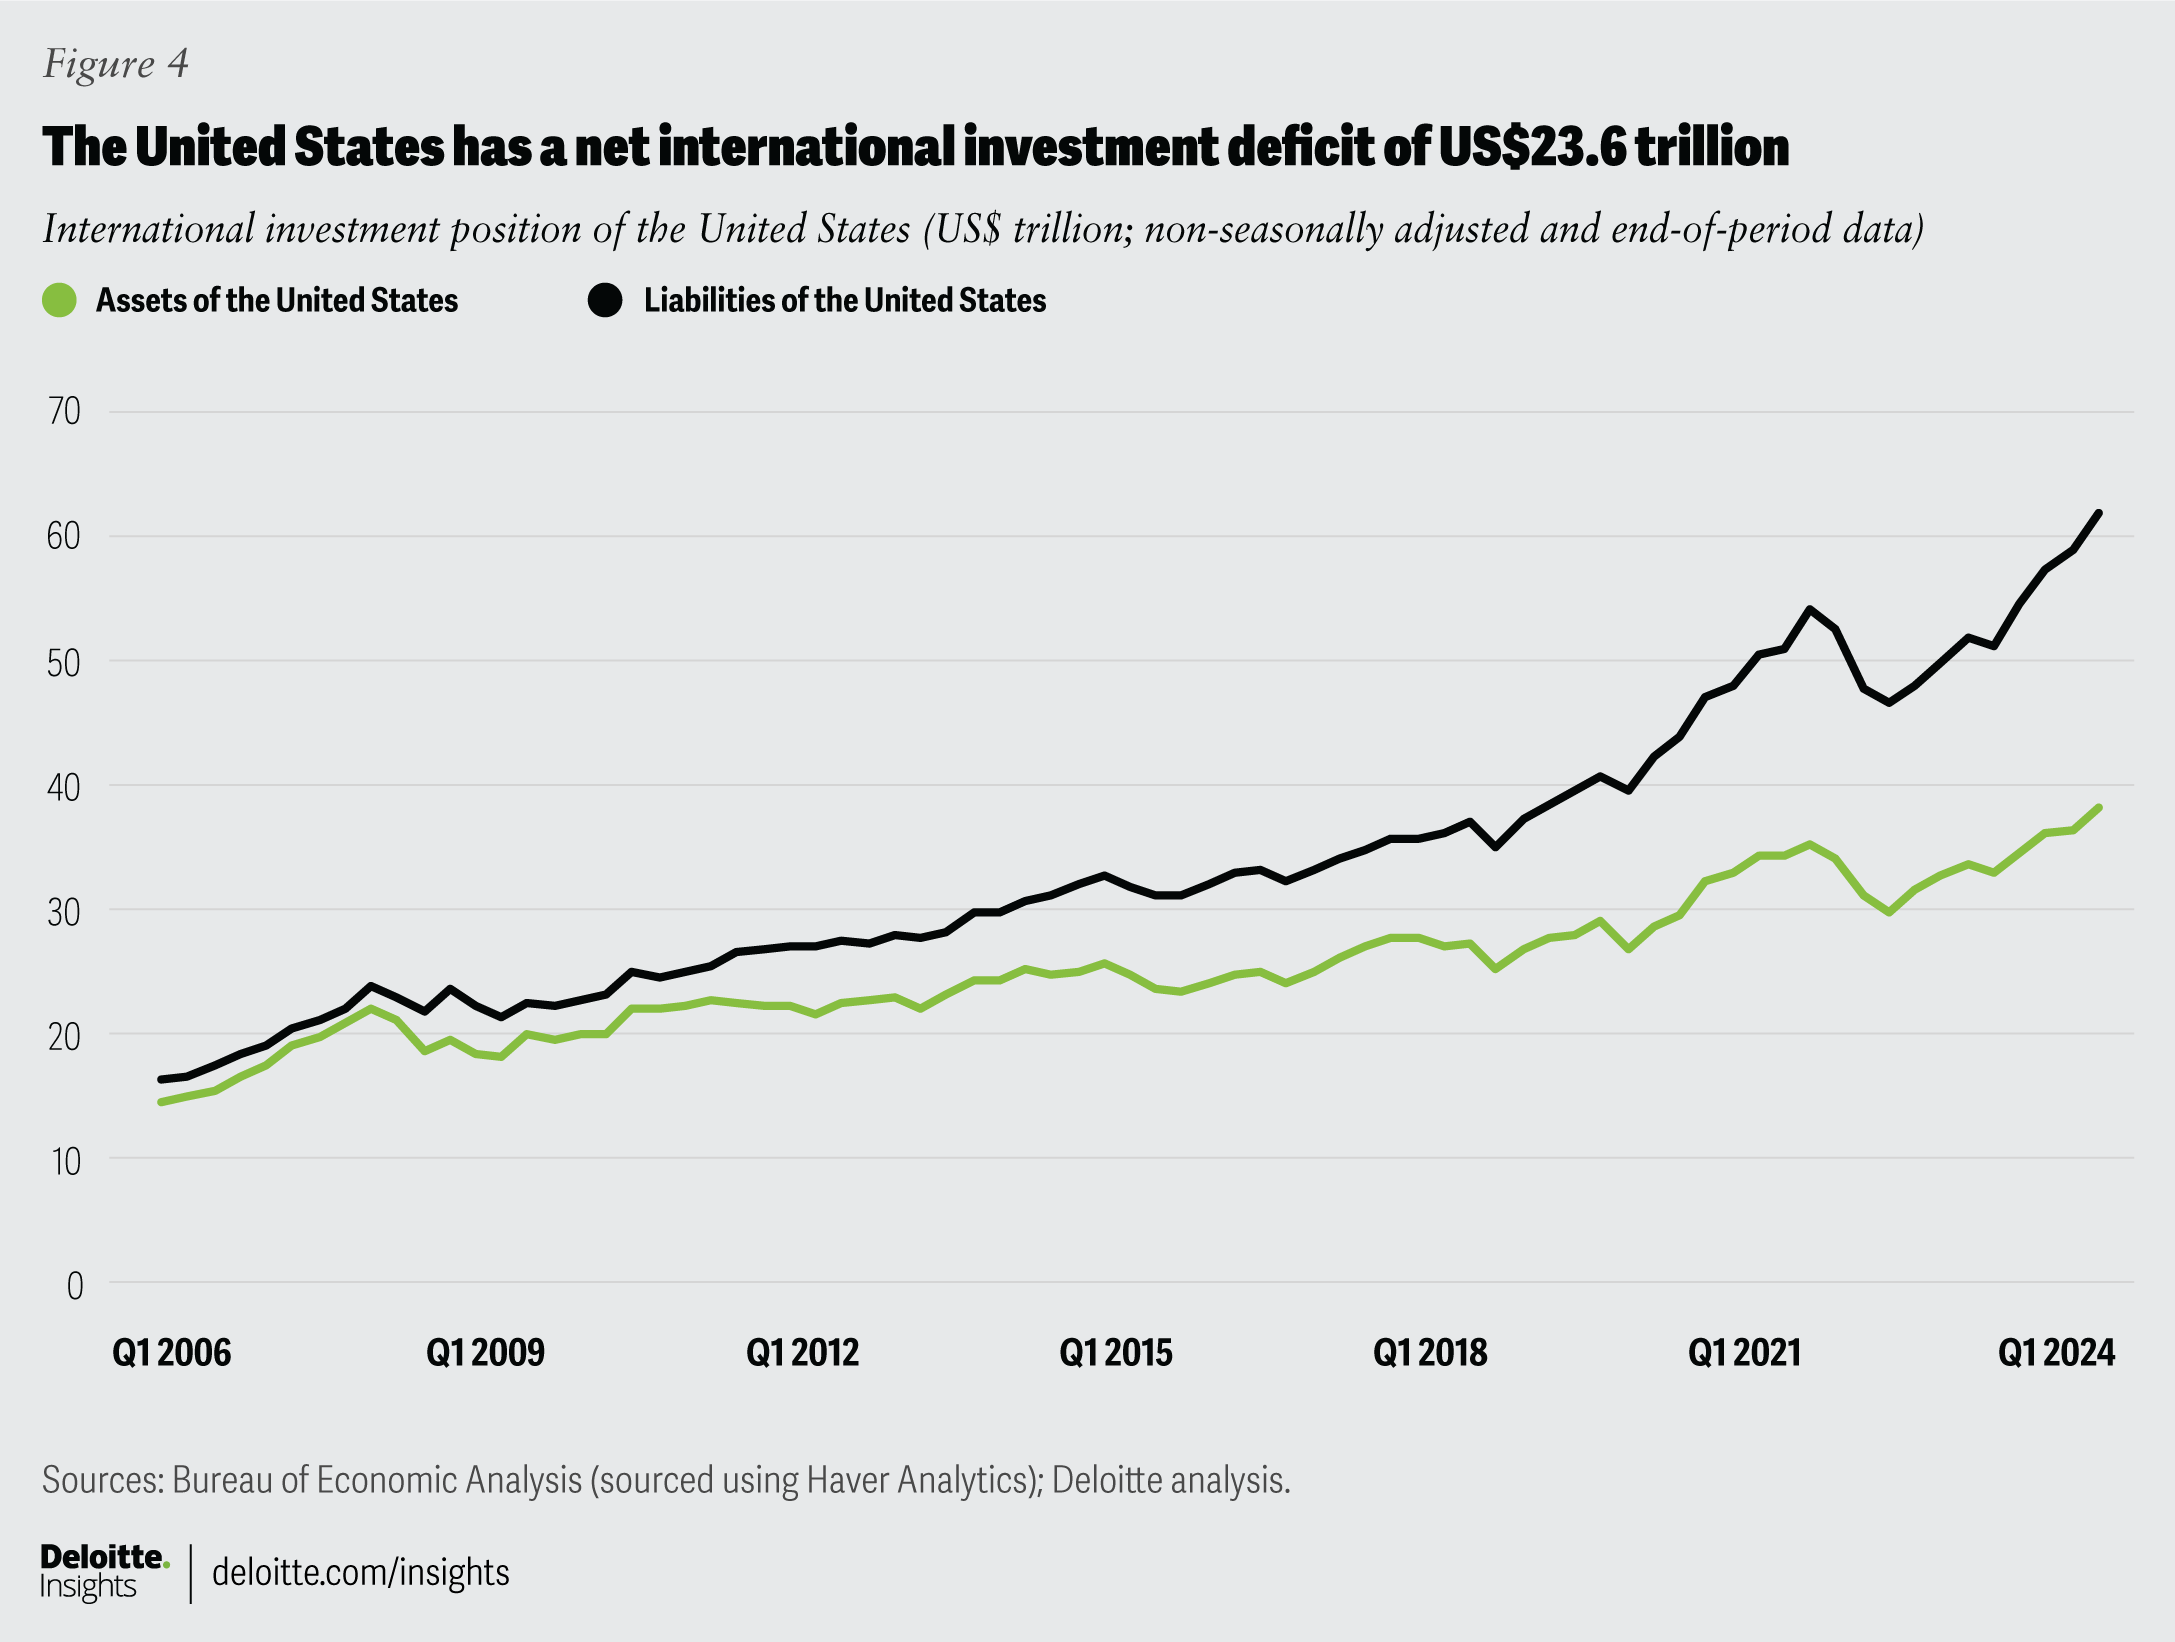
Who funds these additional US investments? Foreign investors who put money into stocks, bonds, and real estate. The scale of this inflow can be gauged from the international investment position data from the Bureau of Economic Analysis.20 International liabilities of the United States (or assets of foreign investors in the United States) are much higher than the nation’s international assets (US residents’ foreign financial assets) (figure 4).
Capital inflow from foreign investors is only possible when they have a trade surplus with the United States or, in other words, when the United States has a trade deficit with the rest of the world. Hence, with the existing US savings-investment gap, all that a declining US trade deficit (due to tariffs) will do is increase the value of the dollar over time to boost imports, and hence, return the deficit to pre-tariff levels. The trade balance, therefore, is not determined by tariffs but by savings and investment behavior. This, in turn, influences the dollar. So, the extent of the dollar’s rise will depend on the degree of tariffs that the United States will impose.

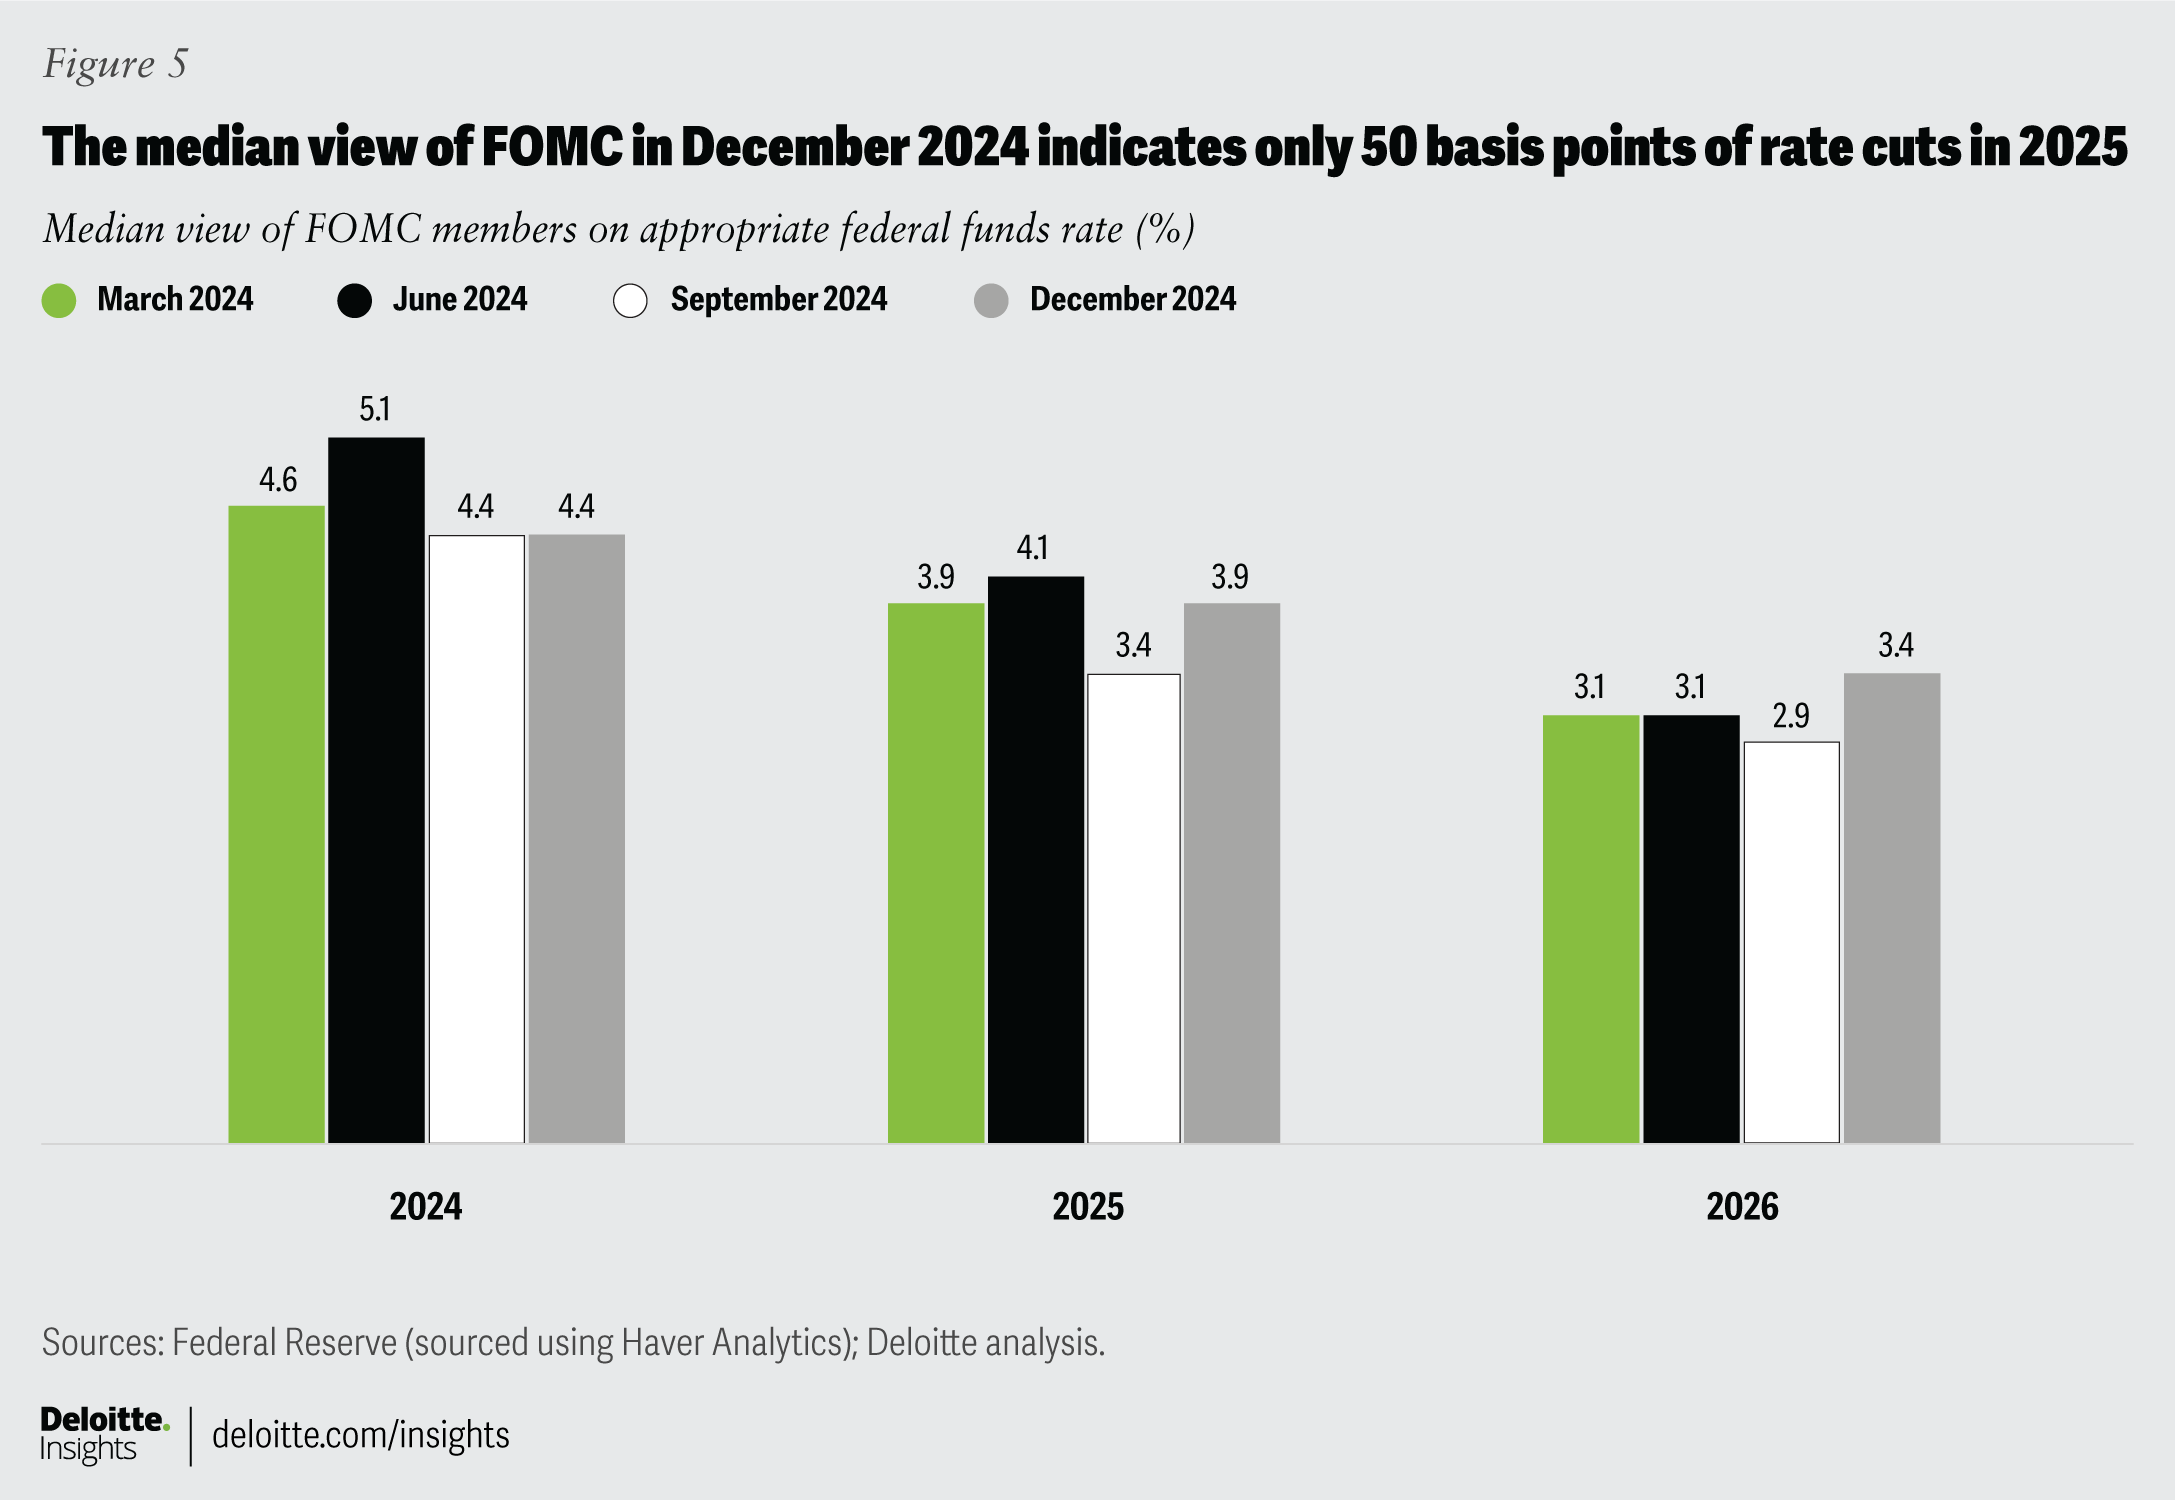
- Interest rates in the United States are expected to stay higher for longer: The dollar has also been gaining value because global investors now expect higher interest rate differentials between the United States and other major economies.21 In December 2024, the median view of the Federal Open Market Committee (FOMC) was just 50 basis points of interest rate cuts in 2025, half of what the median view was in September (figure 5).22 The committee’s more conservative view stems from still-elevated inflation and what it perceives as risks to inflation from rising tariffs.23 A tariff is a tax paid by importers who will likely pass on at least some part of this added cost to their consumers. Even if the imported good is an intermediate product, the impact of a tariff gradually filters through the value chain into the final product. The other reason for the FOMC’s changing projections is that worries about the labor market have haven’t materialized so far—unemployment is low at 4.1%24—with the economy growing at a strong pace in 2024.25

In contrast, the European Central Bank cut policy rates by 25 basis points in January,26 and economists in a Reuters poll (fielded from Feb. 19 to Feb. 27, 2025) expect three more cuts this year.27
The Bank of England cut rates for the third time in over six months in February, even as it expects an unenviable scenario of low growth and elevated inflation.28 In key emerging markets, central banks have been lowering rates as they shift focus from inflation to growth;29 their stance, however, is more cautious as weakening currencies raise the risk of imported inflation. The exceptions to this rate-cut cycle are Japan and Brazil where central banks are raising rates to counter rising inflation.30
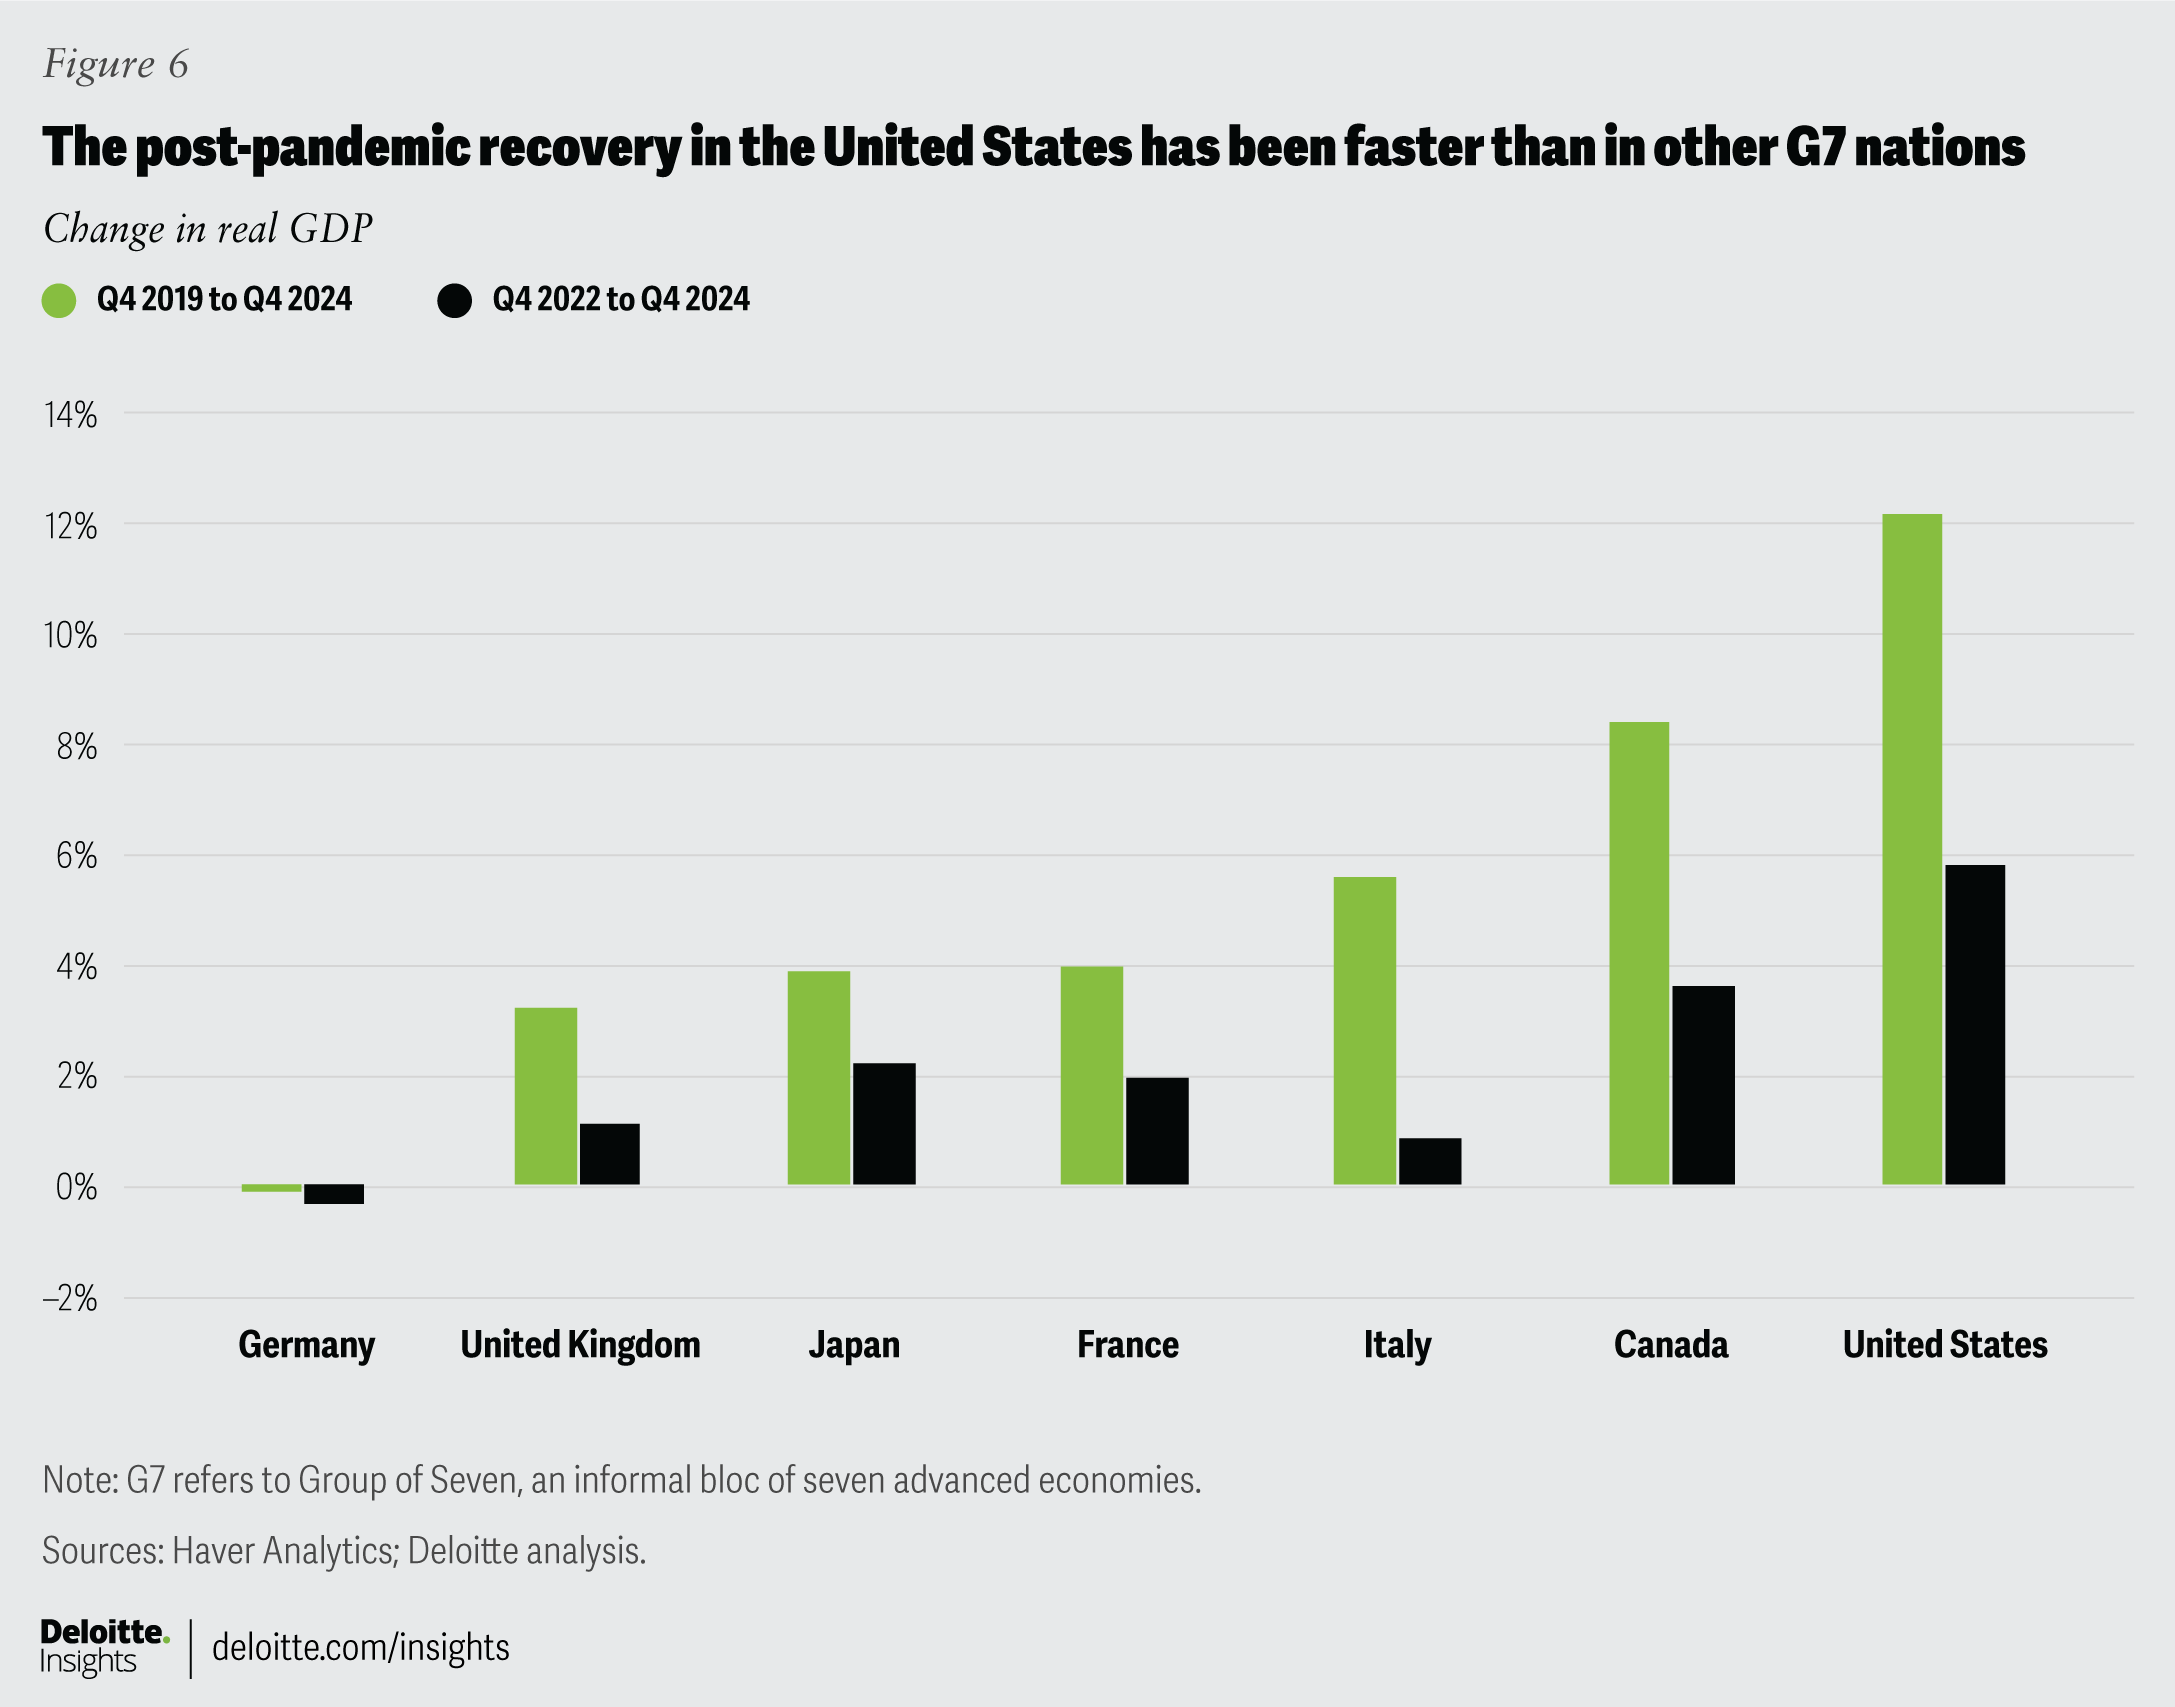
- A vote for the American economy: The dollar’s strength also reflects strong economic fundamentals in the United States, compared to other advanced-economy peers. In 2024, real GDP in the United States grew by 2.8%, far higher than the 0.7% rise in the eurozone, 0.9% in the United Kingdom, and 0.1% in Japan.31
In fact, the United States has been outperforming others throughout its post-pandemic recovery (figure 6). In addition, the United States has been experiencing strong productivity growth over the past two years, thereby increasing its lure as a solid investment destination. For example, labor productivity in the United States grew by about 2% on average in the past two years; in contrast, productivity has been flat in the eurozone during this period.32

Policy will matter from now on
Going forward, the US dollar’s strength will depend on the degree of US tariff announcements: The higher the tariffs, the more the rise in the dollar’s value. The spoiler, however, may be continued uncertainty regarding the tariff regime. Tariff announcements one day with revisions later will likely worry businesses, as without a clear framework—tariffs or no tariffs—it is difficult for them to make investment decisions. This has started to weigh on financial markets with equity prices and bond yields declining since end-February.33 The US dollar too has been impacted, as it has lost ground to the euro and the British pound during this period.34
Over the medium to long term, it may not be just trade policy that will likely impact the dollar over the course of the year; fiscal policy will likely play a part. Prudent fiscal management may increase the allure of fixed-income instruments in the United States, thereby aiding the US dollar. If proposed tax cuts add to debt and deficit levels, the greenback’s shine may fade just a bit.


